

Signals
Signals
Signals is an AI-evaluated notification system that monitors your engineering data and sends alerts to the right people when something noteworthy is happening. Each signal is delivered as a Slack DM or email to its target audience based on a configured cadence.
The Signals page is organized into two tabs: Signals and Activity.
Available signals
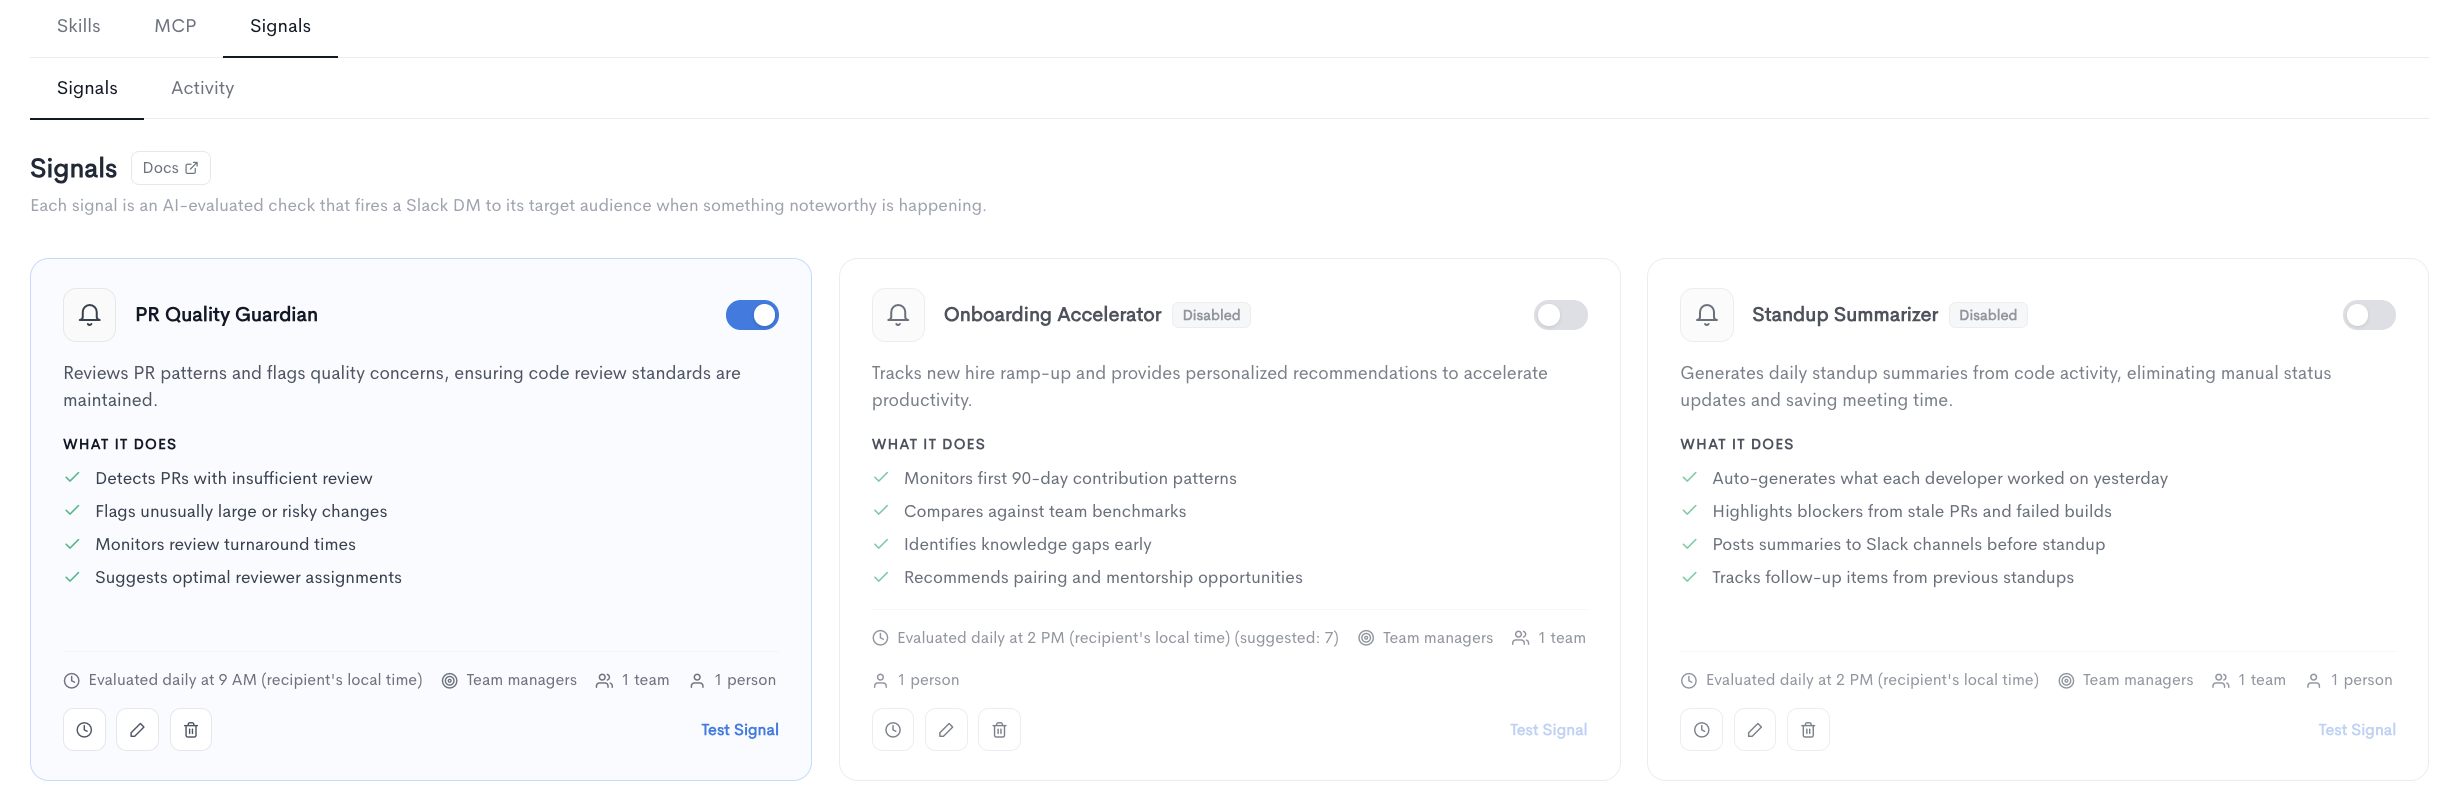
The Signals tab lists all available signals. Each signal card displays a description, what it does, its evaluation schedule, target audience, and action buttons. Use the toggle on each card to enable or disable a signal.
The following signals are available:
-
PR Quality Guardian - Reviews PR patterns and flags quality concerns, ensuring code review standards are maintained. Detects PRs with insufficient review, flags unusually large or risky changes, monitors review turnaround times, and suggests optimal reviewer assignments.
-
Onboarding Accelerator - Tracks new hire ramp-up and provides personalized recommendations to accelerate productivity. Monitors first 90-day contribution patterns, compares against team benchmarks, identifies knowledge gaps early, and recommends pairing and mentorship opportunities.
-
Standup Summarizer - Generates daily standup summaries from code activity, eliminating manual status updates and saving meeting time. Auto-generates what each developer worked on yesterday, highlights blockers from stale PRs and failed builds, posts summaries to Slack channels before standup, and tracks follow-up items from previous standups.
-
Incident Predictor - Analyzes code change patterns and deployment signals to predict potential incidents before they happen. Correlates risky code patterns with past incidents, monitors deployment velocity anomalies, scores each release for incident probability, and sends pre-deploy risk alerts to on-call teams.
-
Capacity Planner - Predicts team capacity and workload distribution to prevent burnout and optimize resource allocation. Forecasts available capacity per sprint, detects workload imbalances across team members, predicts burnout risk based on activity patterns, and recommends work redistribution.
-
Knowledge Flow Analyzer - Maps how knowledge flows through your organization and identifies single points of failure. Builds expertise maps from code ownership, identifies bus factor risks per service, tracks cross-team collaboration patterns, and recommends knowledge sharing initiatives.
-
Tech Debt Tracker - Automatically identifies and quantifies technical debt accumulation across your codebase. Detects code areas with high churn and frequent file rewriting, estimates remediation effort for debt hotspots, tracks debt trends per team and service, and proposes sprint-level debt paydown plans.
-
Team Health Pulse - Measures team morale and engagement signals from work patterns, surfacing early warning signs of disengagement. Detects declining activity patterns per individual, monitors after-hours work and weekend commits, tracks collaboration frequency between team members, and sends confidential health reports to engineering managers.
Editing a signal
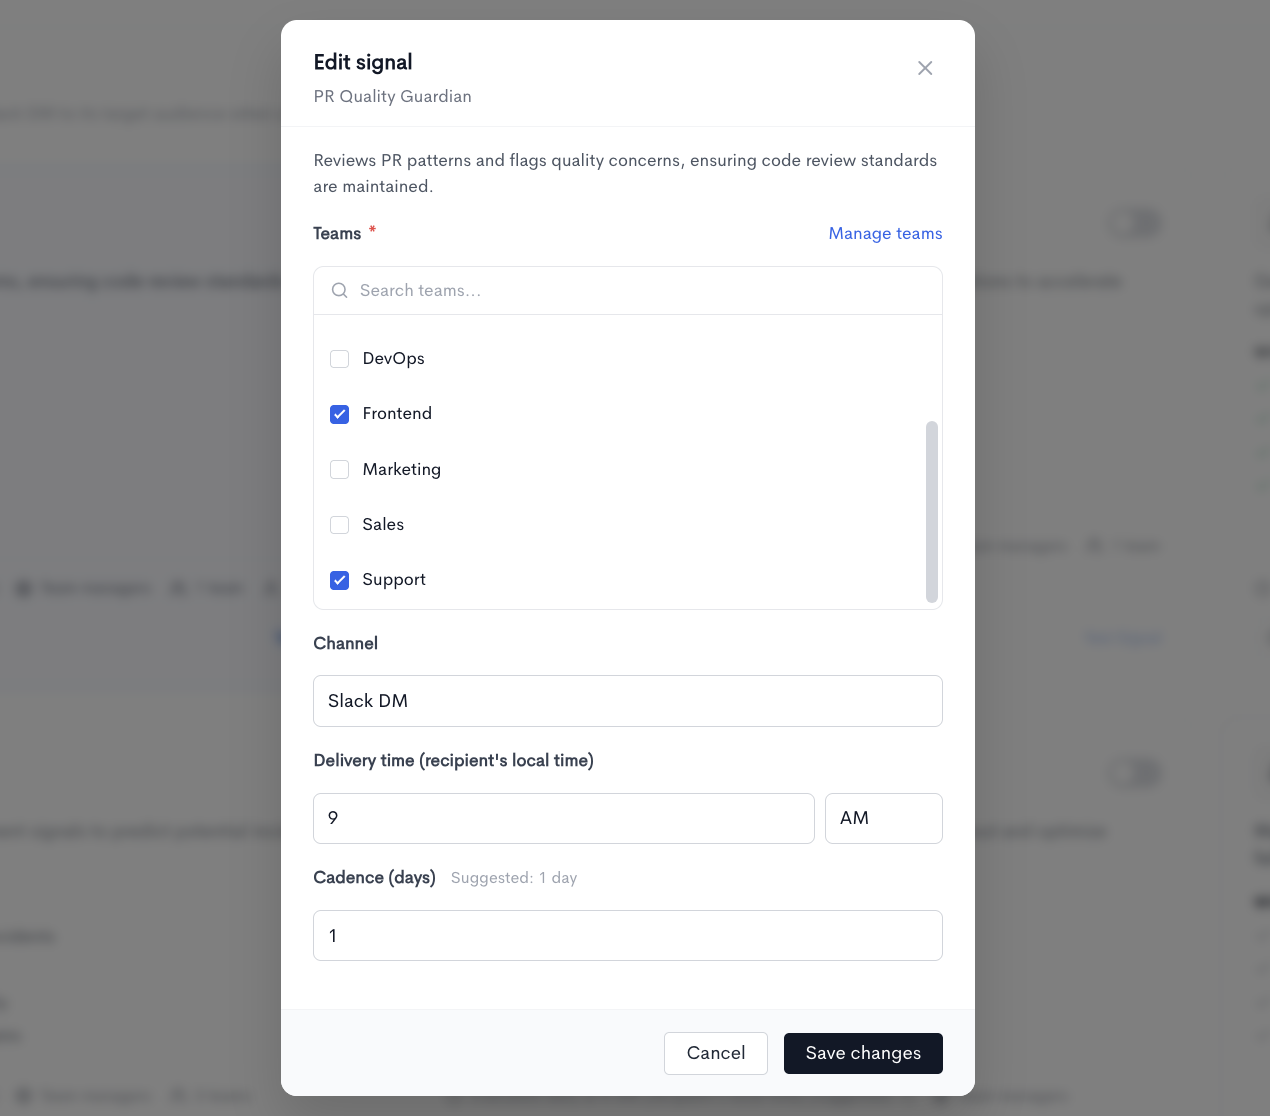
Clicking the edit icon on a signal card opens the Edit signal panel, where you can configure the following:
- Teams - Select one or more teams this signal should monitor and target. You can search for teams by name. Use the Manage teams link to add or update teams in your workspace.
- Channel - Choose how the signal is delivered. Available options are Slack DM and Email.
- Delivery time (recipient's local time) - Set the time of day the signal is sent, in the recipient's local time. Enter the hour and select AM or PM.
- Cadence (days) - Set how frequently the signal is evaluated and delivered, in days. A suggested cadence is shown next to the field label.
Click Save changes to apply the configuration. Click Cancel to discard any changes.
Activity
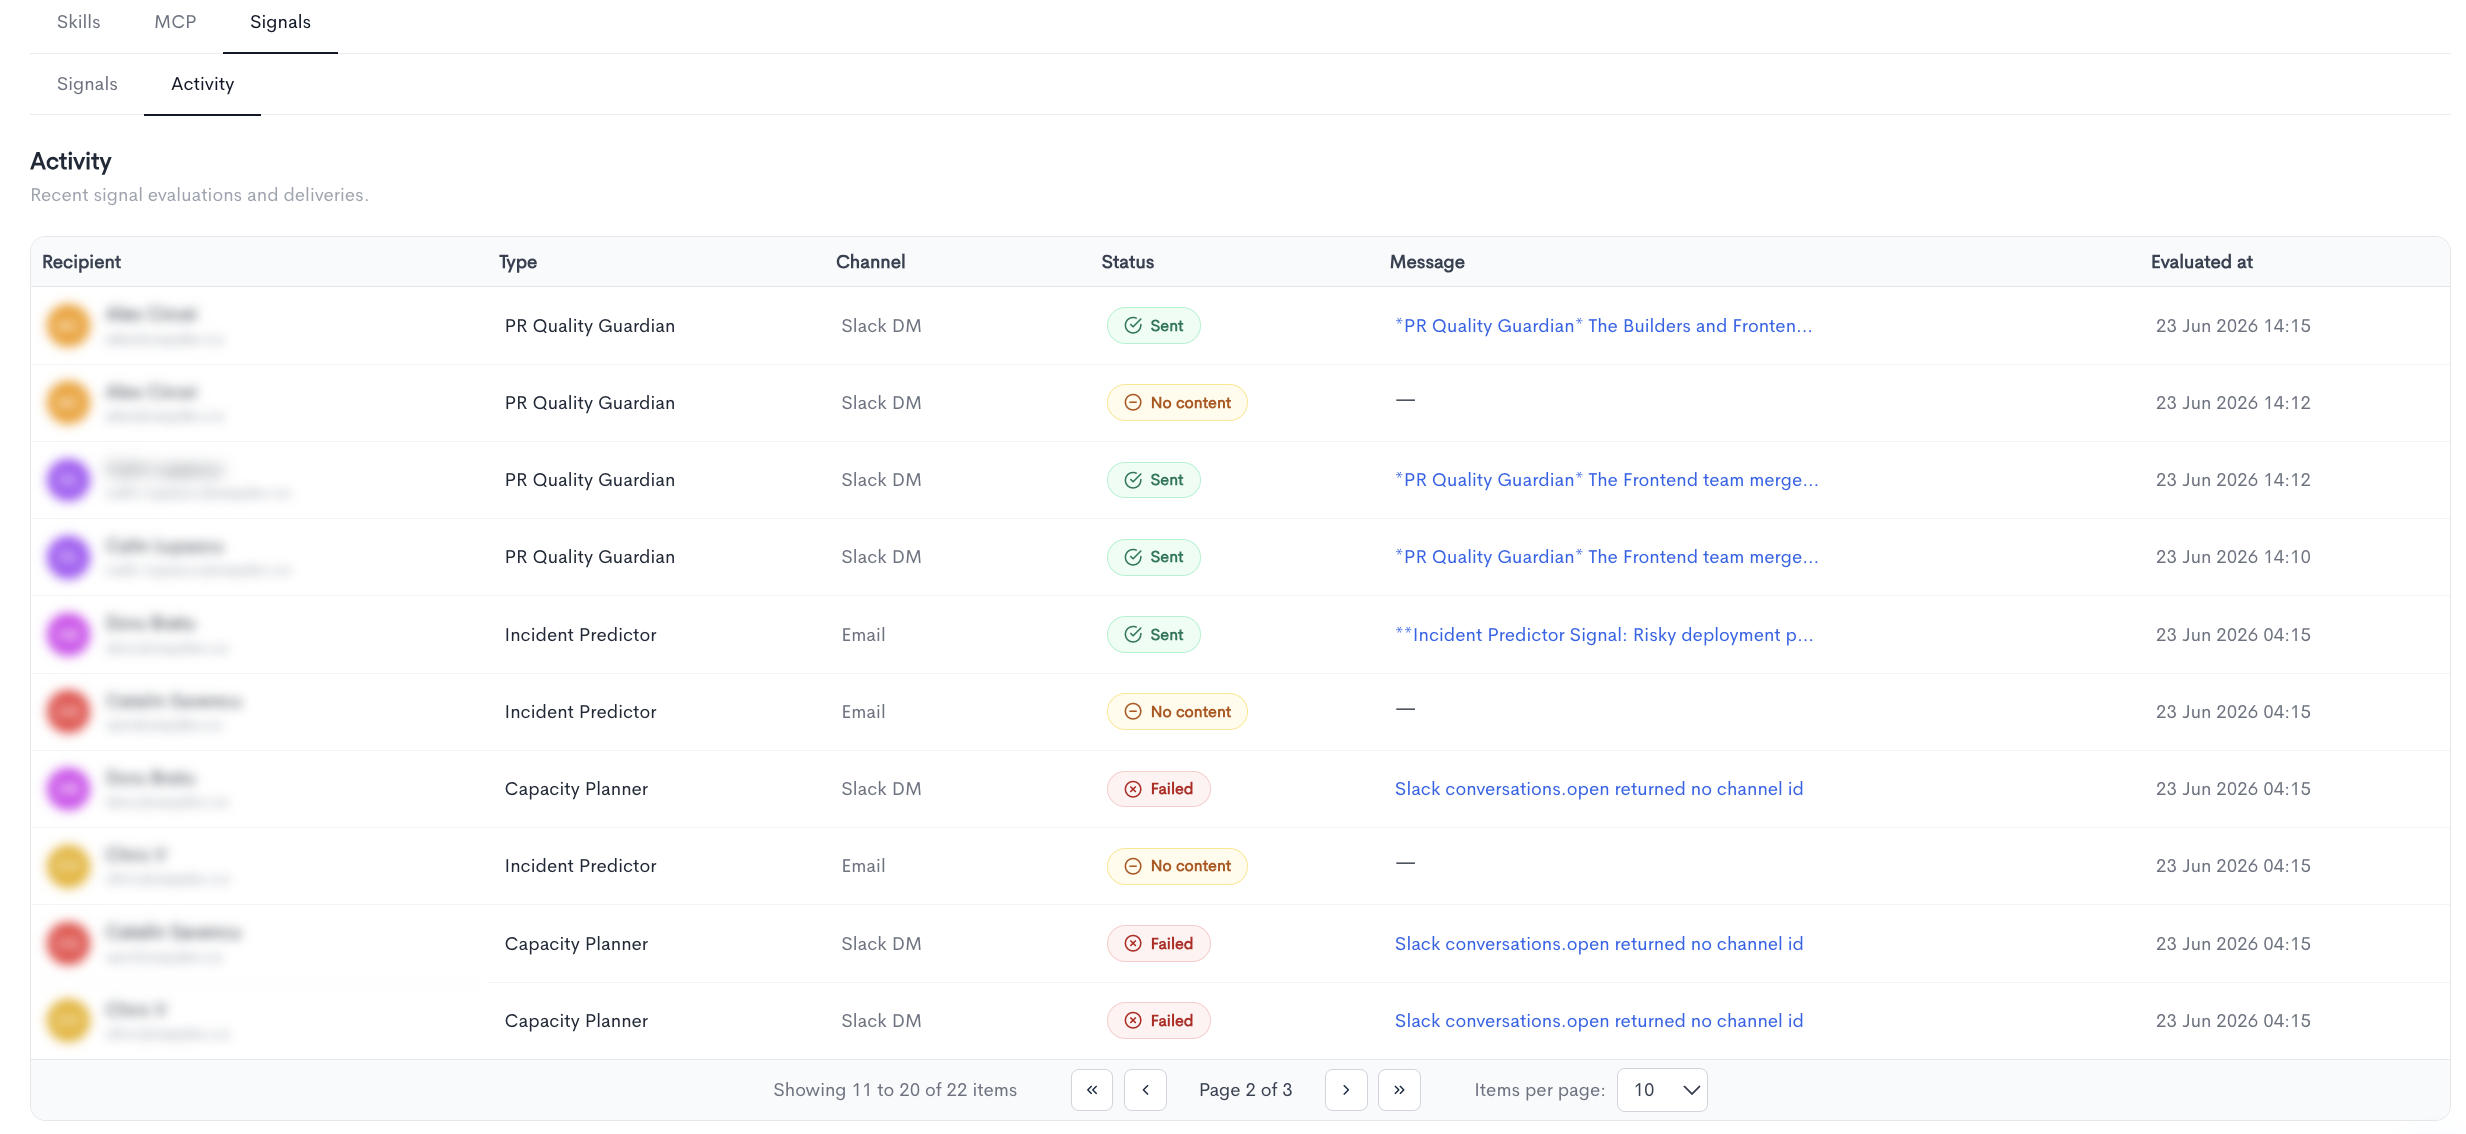
The Activity tab shows a log of recent signal evaluations and deliveries. Each entry includes the following columns:
- Recipient - The user the signal was evaluated for, shown with their name and email.
- Type - The name of the signal that was evaluated (e.g. PR Quality Guardian, Incident Predictor).
- Channel - The delivery channel used, either Slack DM or Email.
- Status - The outcome of the evaluation. Possible statuses are:
- Sent - The signal was evaluated and a message was successfully delivered.
- No content - The signal was evaluated but had nothing to report.
- Failed - The signal could not be delivered (e.g. Slack channel not found).
- Message - A preview of the message sent, if applicable. Shown as a link for sent messages.
- Evaluated at - The date and time the signal was evaluated.
The log is paginated and shows 10 items per page by default. Use the page controls at the bottom to navigate between pages or adjust the number of items displayed per page.
Updated about 1 month ago