

Ticket Cycle Time
Ticket Cycle Time drilldown
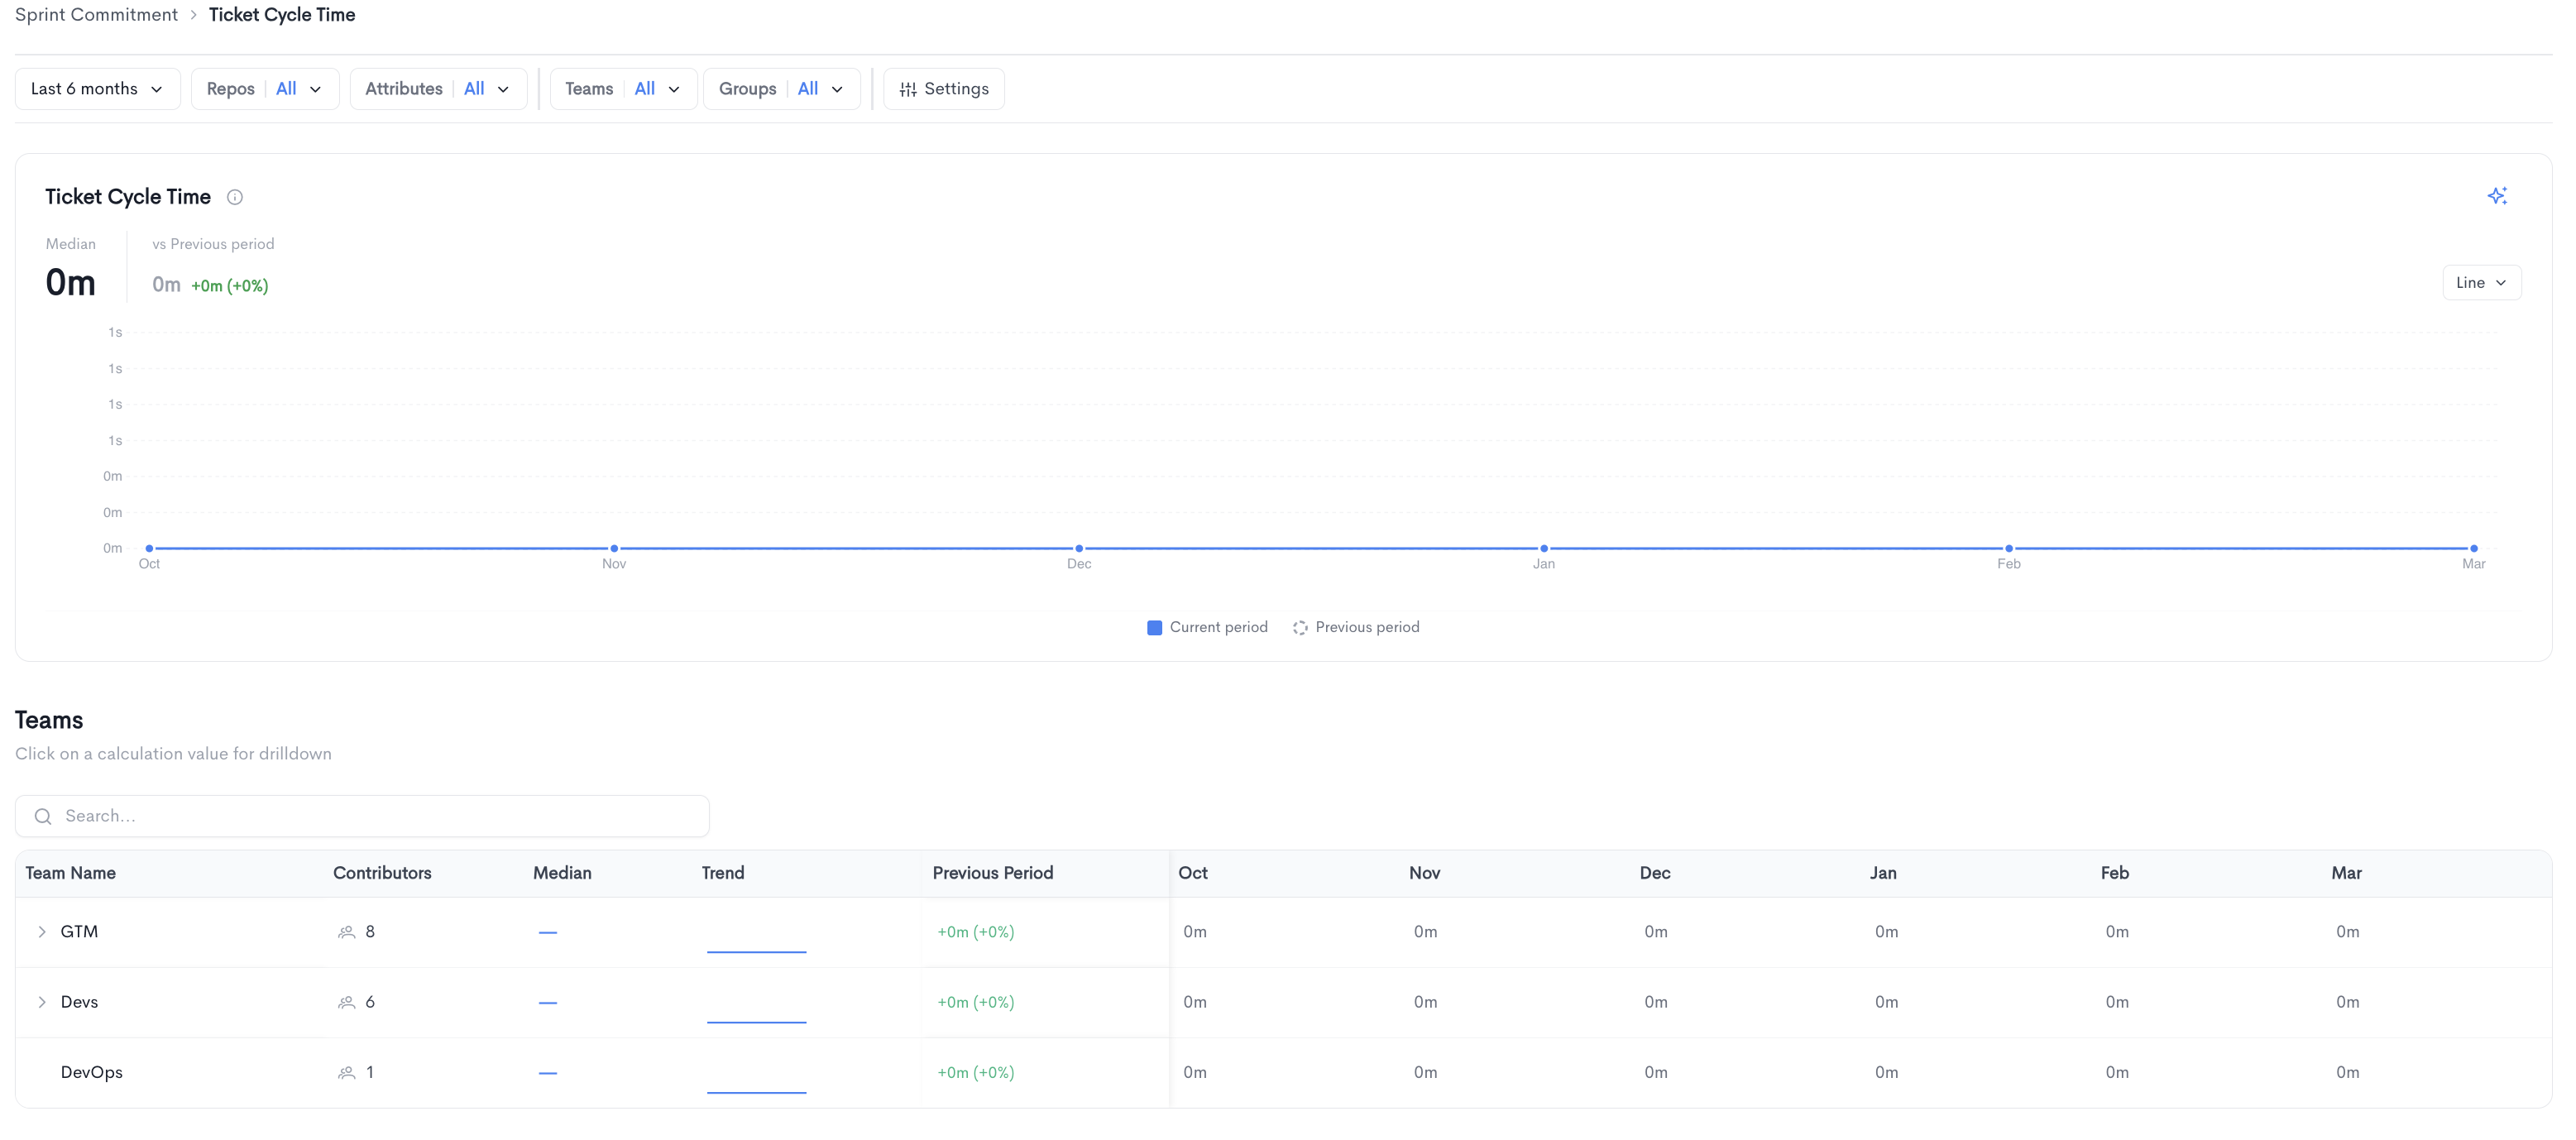
The Ticket Cycle Time page shows a detailed breakdown of the time it takes for tickets to move from start to completion in the selected period.
The top of the page displays the median ticket cycle time alongside a comparison to the previous period, along with a trend chart comparing the current period to the previous period.
Teams - A searchable table breaking down ticket cycle time per team, with the following columns:
- Team Name - The name of the team.
- Contributors - The number of contributors in the team.
- Median - The median cycle time for the team. Clicking on a value opens a drilldown view for that team.
- Trend - A sparkline showing the cycle time trend over time.
- Previous Period - The change in cycle time compared to the previous period.
- Monthly columns showing the median cycle time per period.
Teams can be expanded to reveal sub-teams.
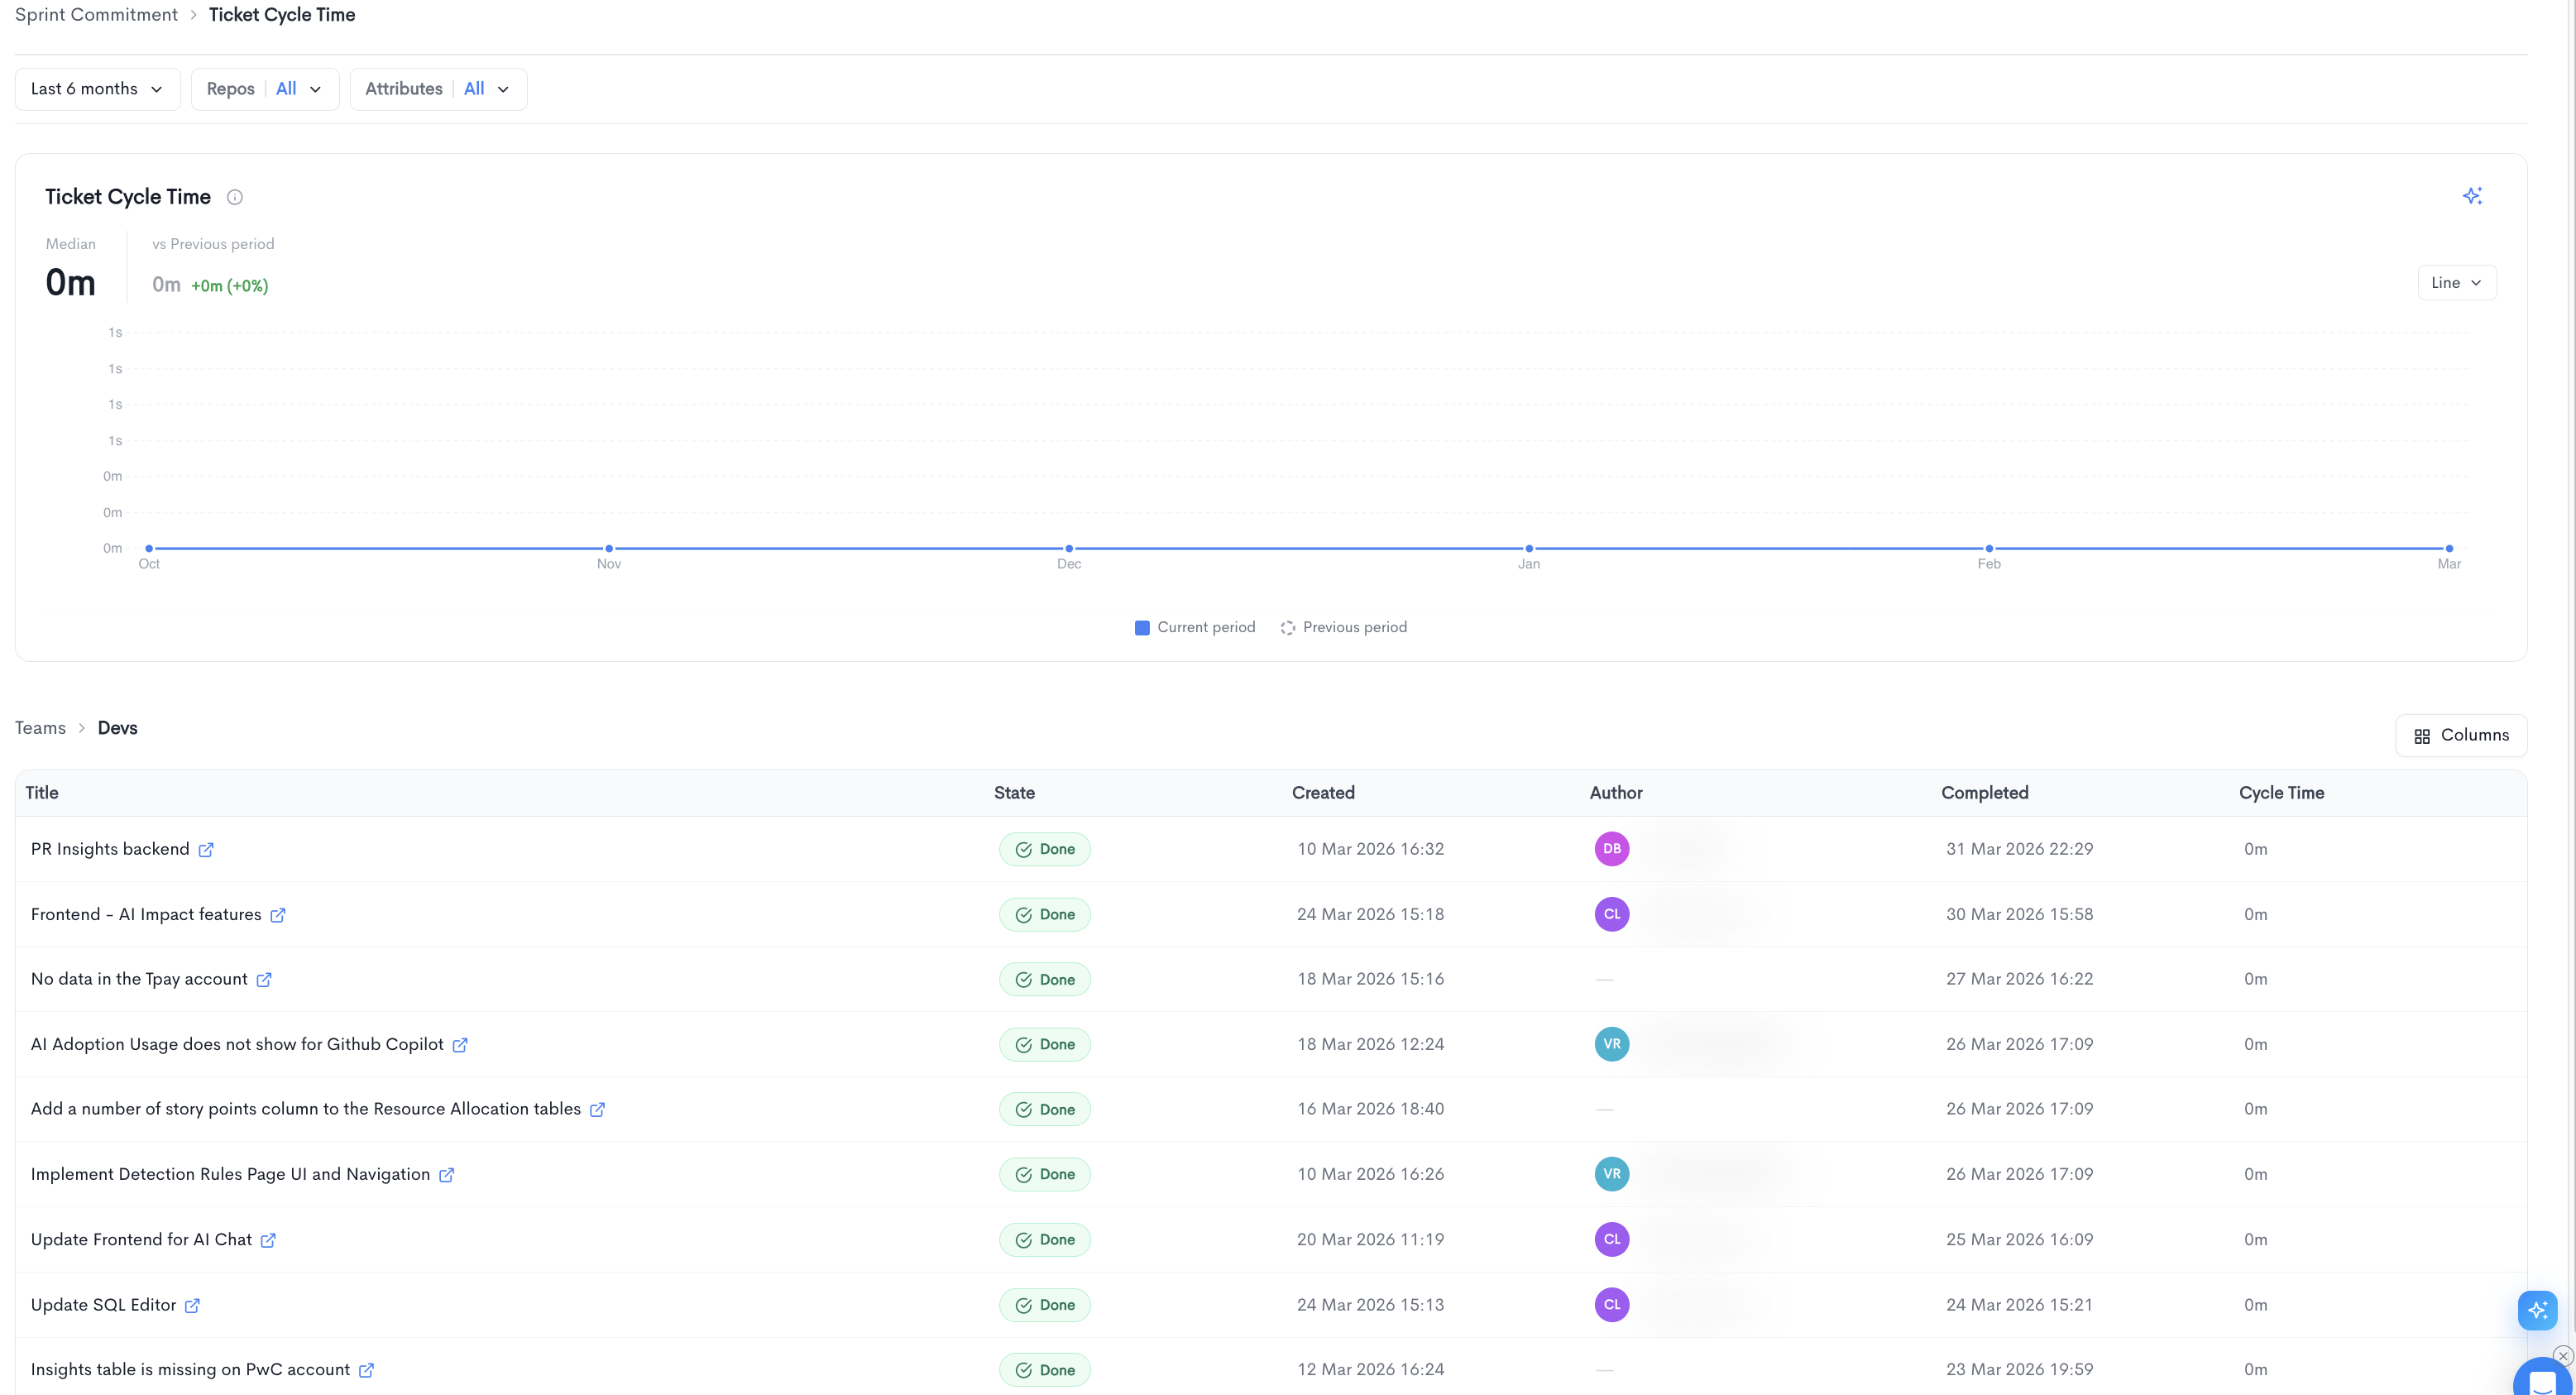
Ticket Cycle Time team drilldown
Clicking on a team's median value opens a drilldown view for that specific team. The drilldown displays the trend chart for the selected team and a paginated table listing all tickets with their cycle time, with the following columns:
- Title - The ticket title, linked to the source provider.
- State - The current state of the ticket (e.g. Done).
- Created - The date and time the ticket was created.
- Author - The developer assigned to the ticket.
- Completed - The date and time the ticket was completed.
- Cycle Time - The time elapsed from when work started to completion.
You can adjust the visible columns using the Columns button.
Updated 4 months ago