

Vendor ROI
The Vendor ROI report helps you measure the return on investment of your AI tools by tracking adoption, active usage, and productivity impact across teams. It is accessible under AI in the left sidebar and is organized into four tabs: Overview, Claude Code, Cursor, and Github.
Overview tab
The Overview tab gives you a consolidated view of AI tool adoption and usage across all connected vendors.
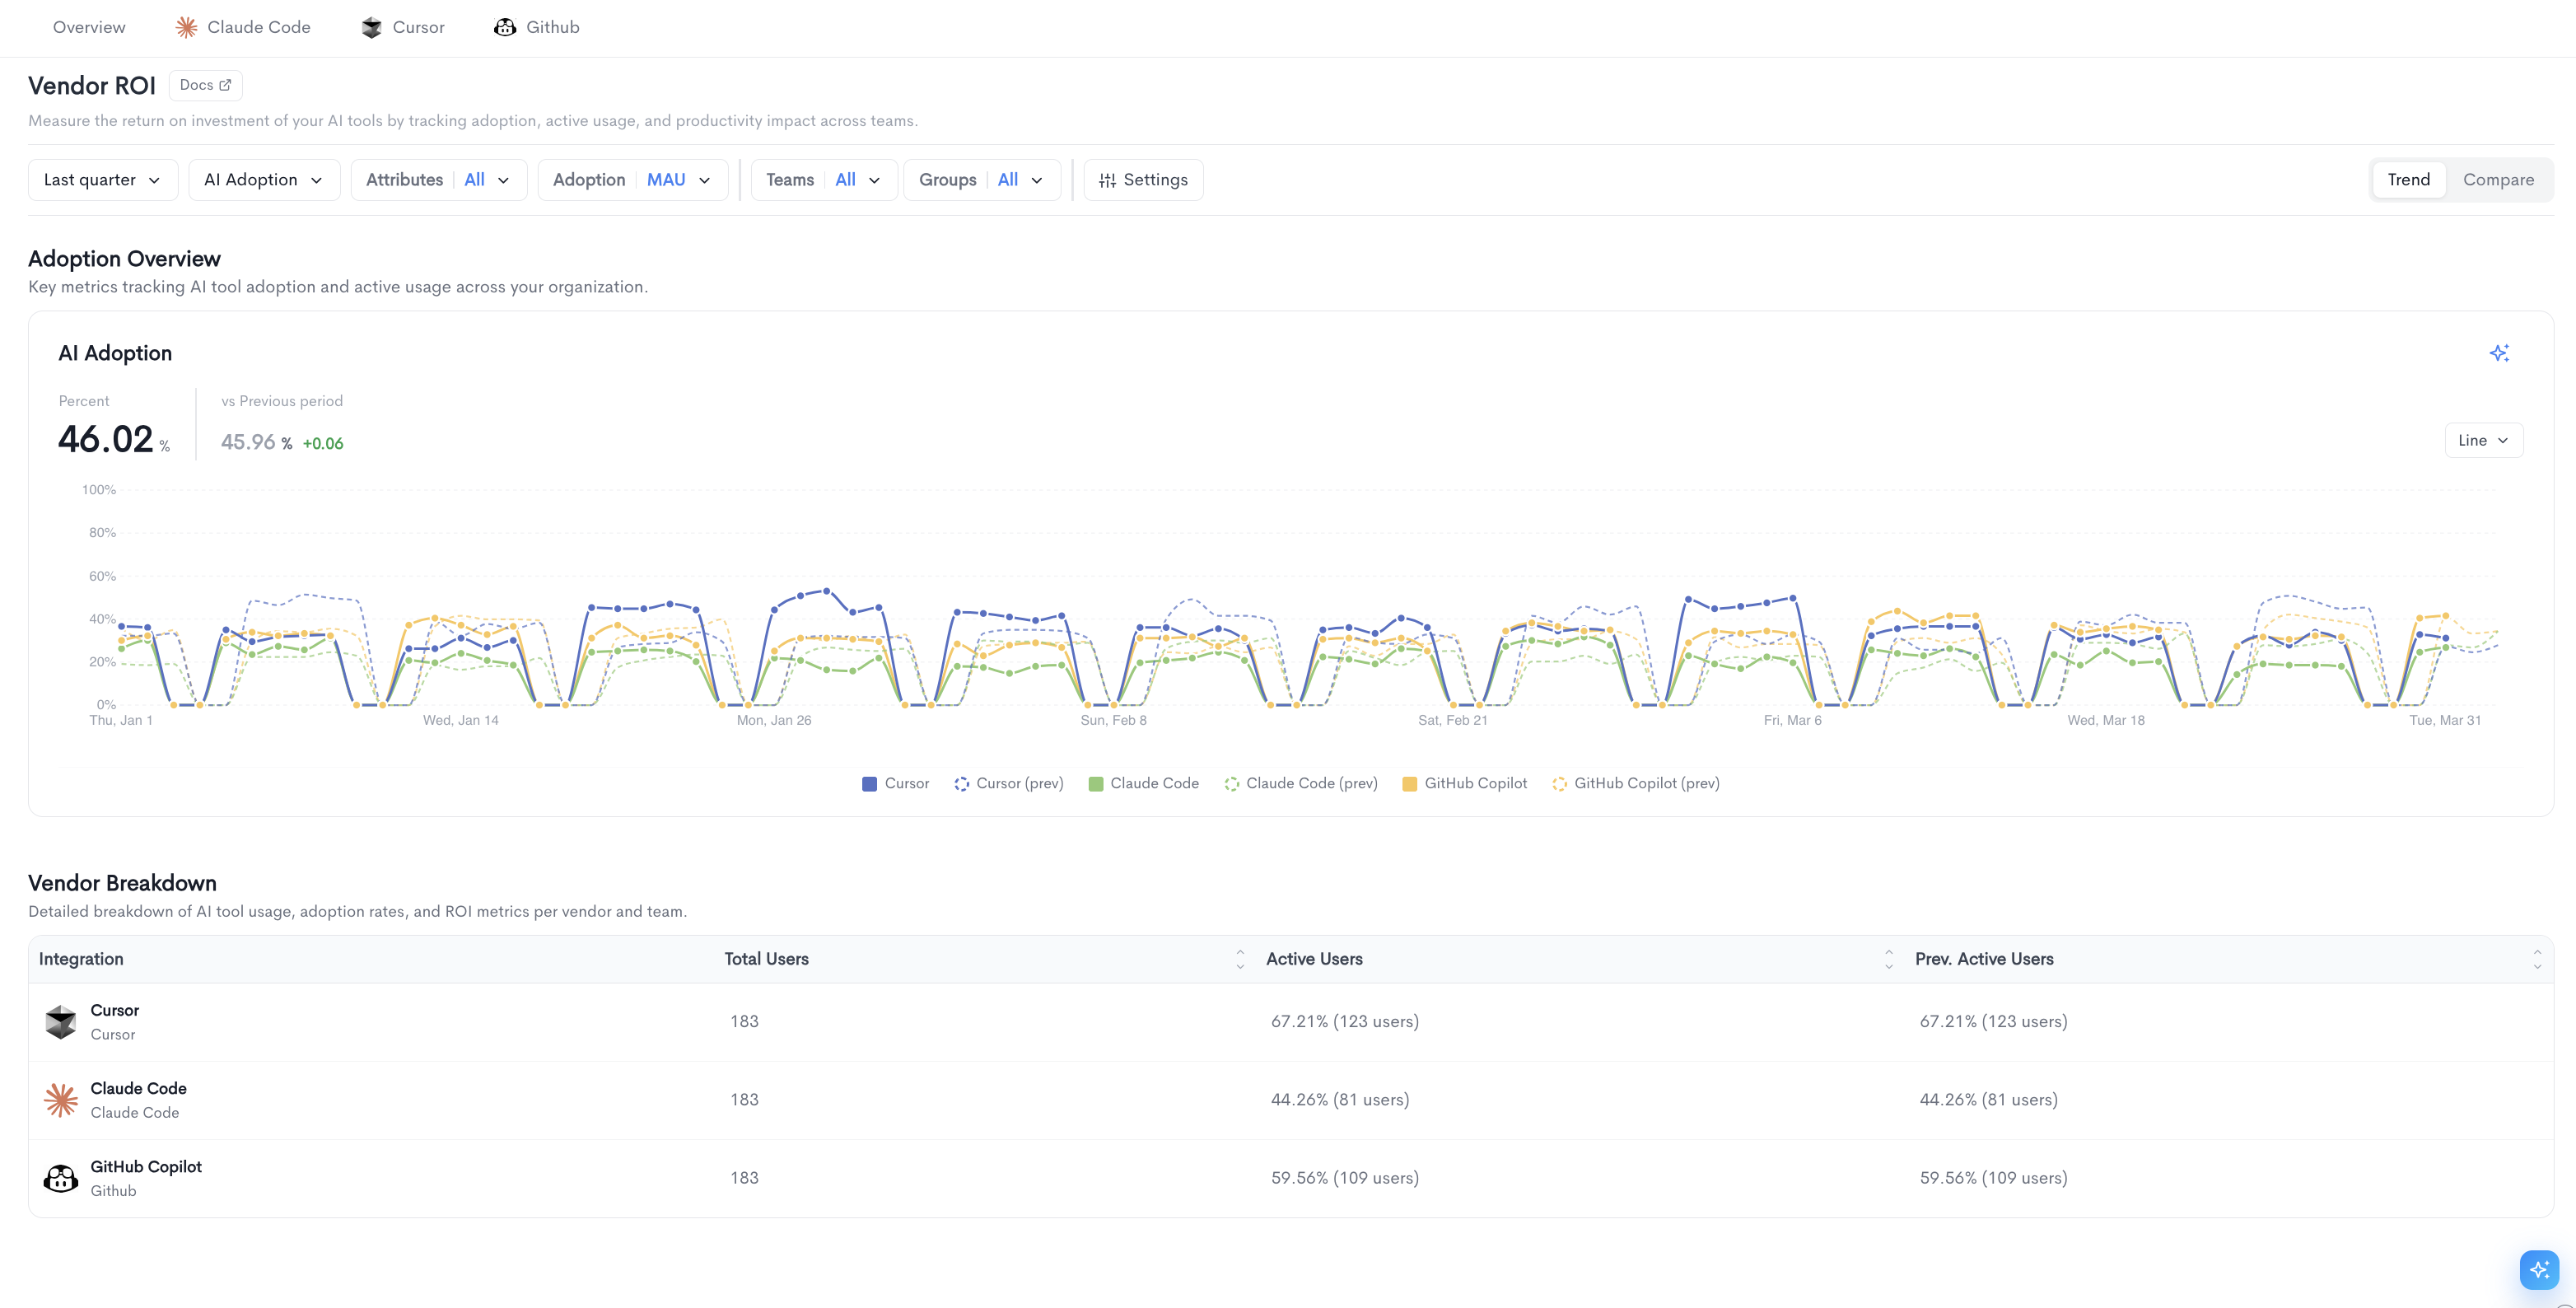
Adoption Overview
The top of the page displays a summary metric:
- Percent - The overall AI adoption rate across your organization for the selected period, compared to the previous period.
The chart shows AI adoption over time for each connected vendor, with the previous period shown as a dotted comparison line. The chart can be toggled between Trend and Compare views.
Filters available at the top of the page include date range, AI Adoption metric, Attributes, Adoption, Teams, Groups, and Settings.
Vendor Breakdown
A table below the chart showing adoption data per vendor with the following columns:
- Integration - The name of the AI tool.
- Total Users - The total number of users provisioned for the tool.
- Active Users - The number and percentage of users active in the selected period.
- Prev. Active Users - The number and percentage of active users in the previous period.
Per-vendor tabs
Each vendor tab (Claude Code, Cursor, Github, etc.) provides a dedicated view of adoption and usage data for that specific tool. Each tab is organized into two sub-tabs: Adoption and Usage.
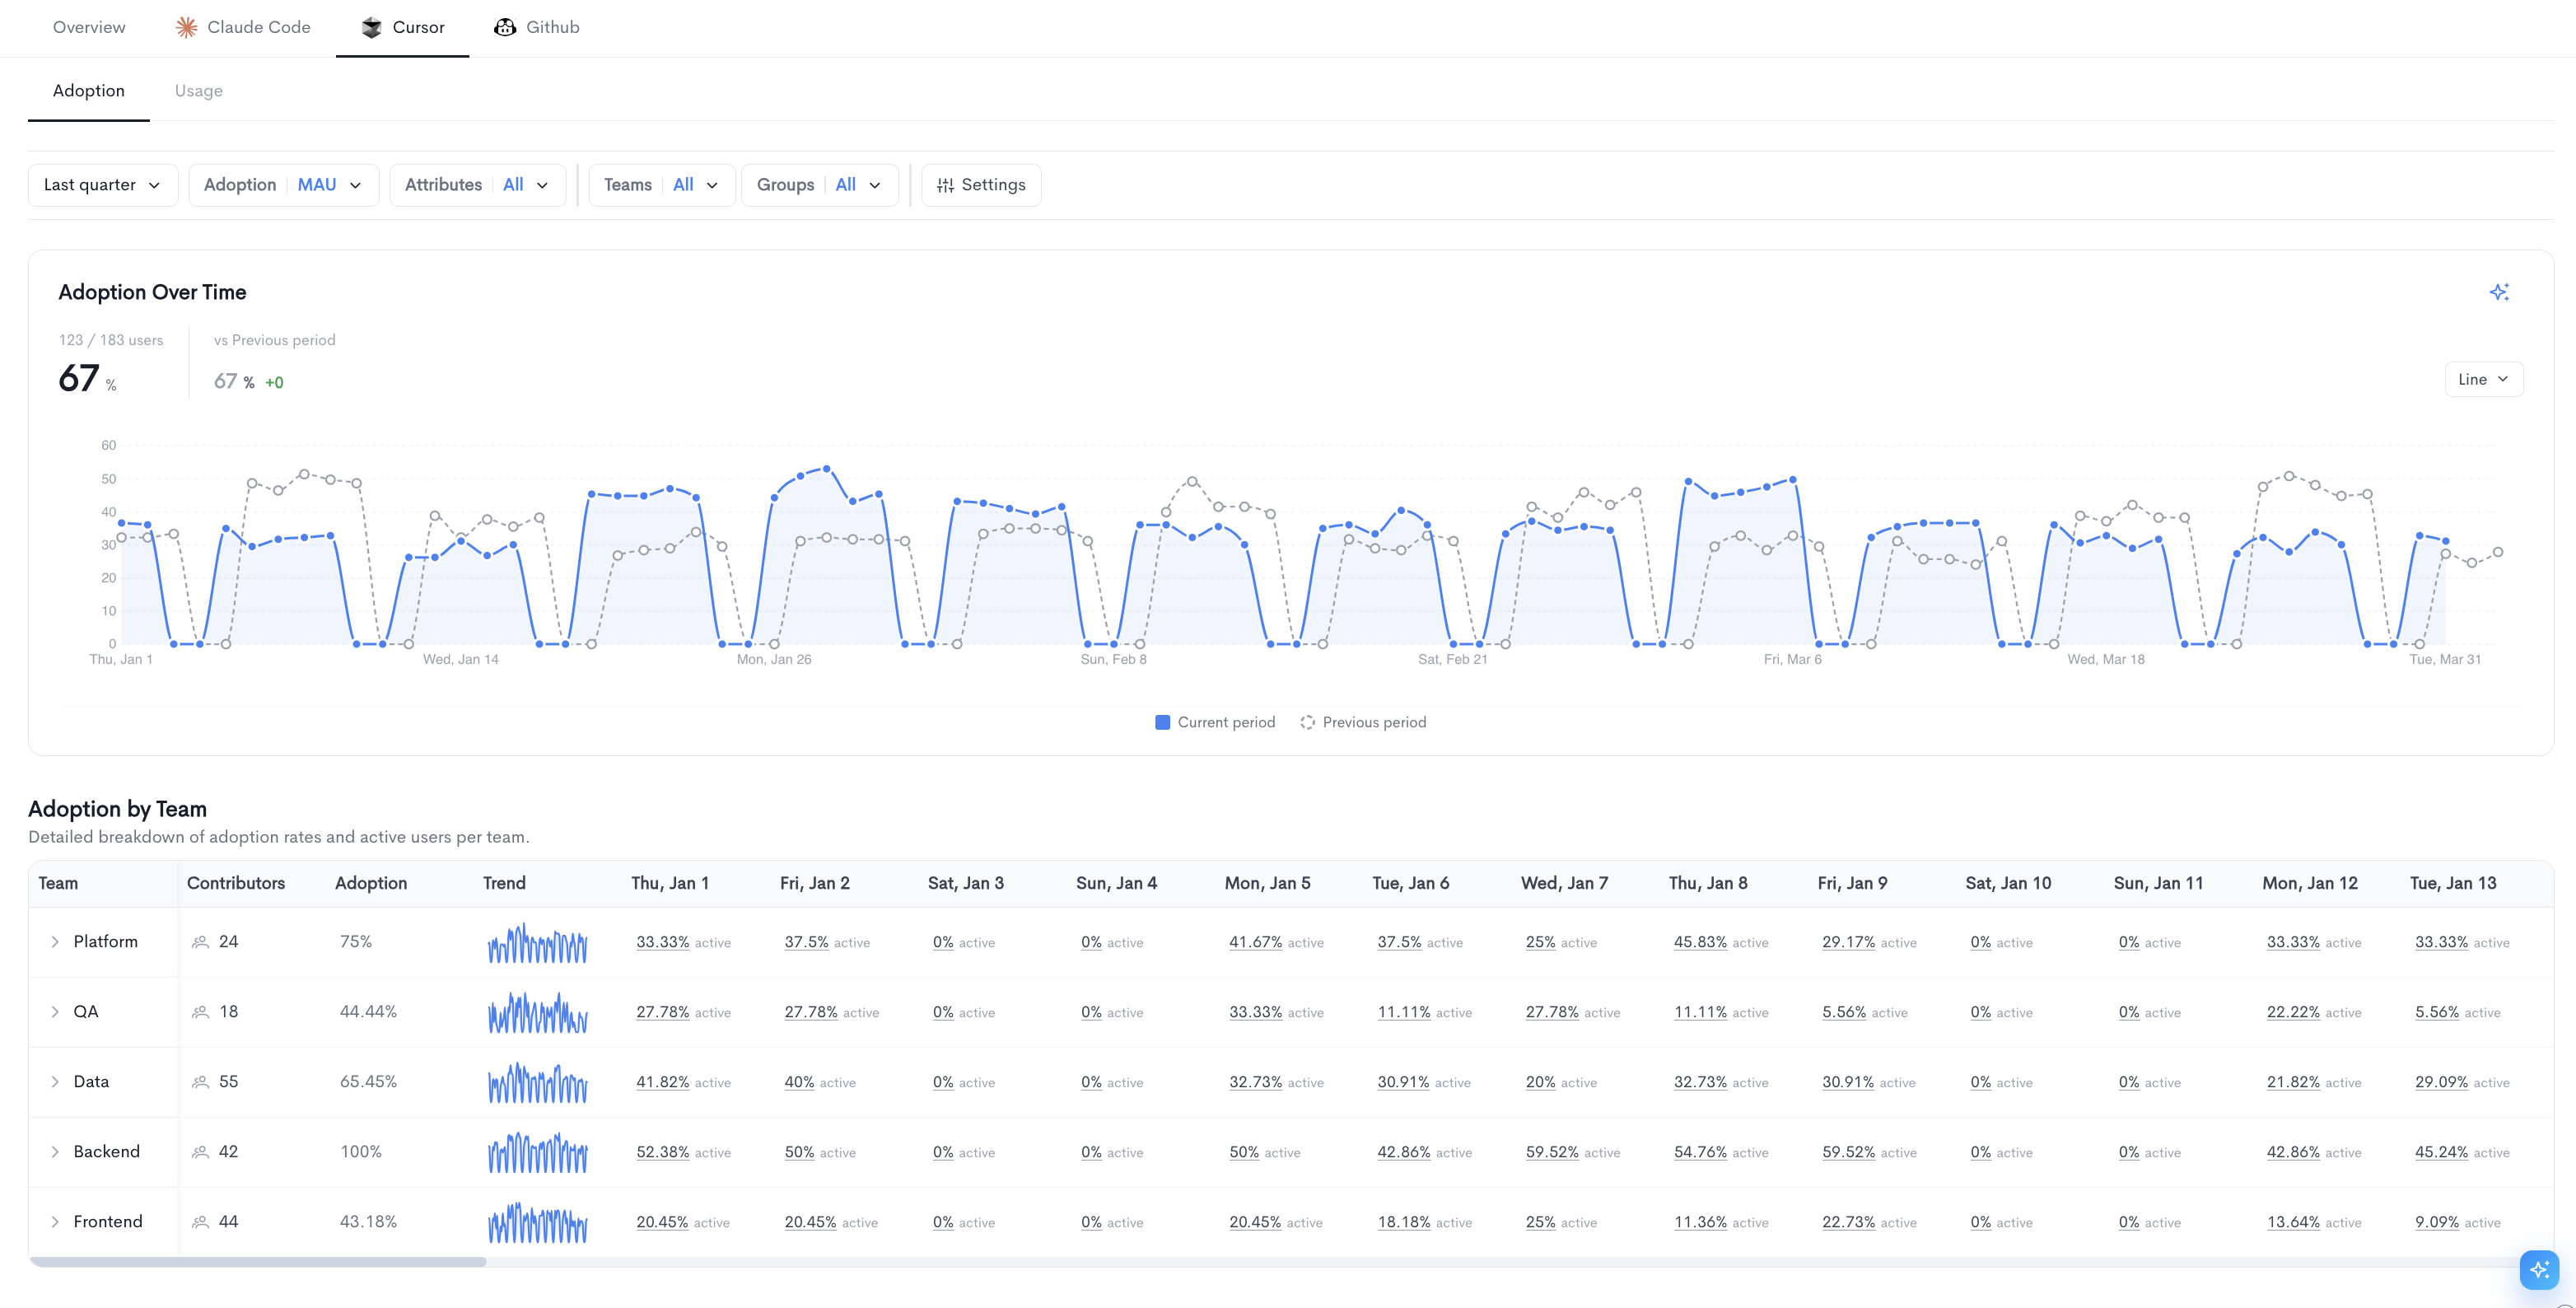
Adoption sub-tab
The Adoption sub-tab shows how broadly the tool is being used across your organization.
Adoption Over Time - A line chart tracking the percentage of active users over the selected period, with a comparison line for the previous period. The total adoption rate and period-over-period change are displayed above the chart.
Adoption by Team - A table below the chart breaking down adoption per team with the following columns:
- Team - The name of the team, expandable to reveal nested sub-teams.
- Contributors - The number of contributors on the team.
- Adoption - The overall adoption rate for the team in the selected period.
- Trend - A sparkline showing how adoption has changed over time.
- Daily columns - The active user percentage for each day in the selected period.
Filters available at the top of the Adoption sub-tab include date range, Adoption metric, Attributes, Adoption type, Teams, and Groups.
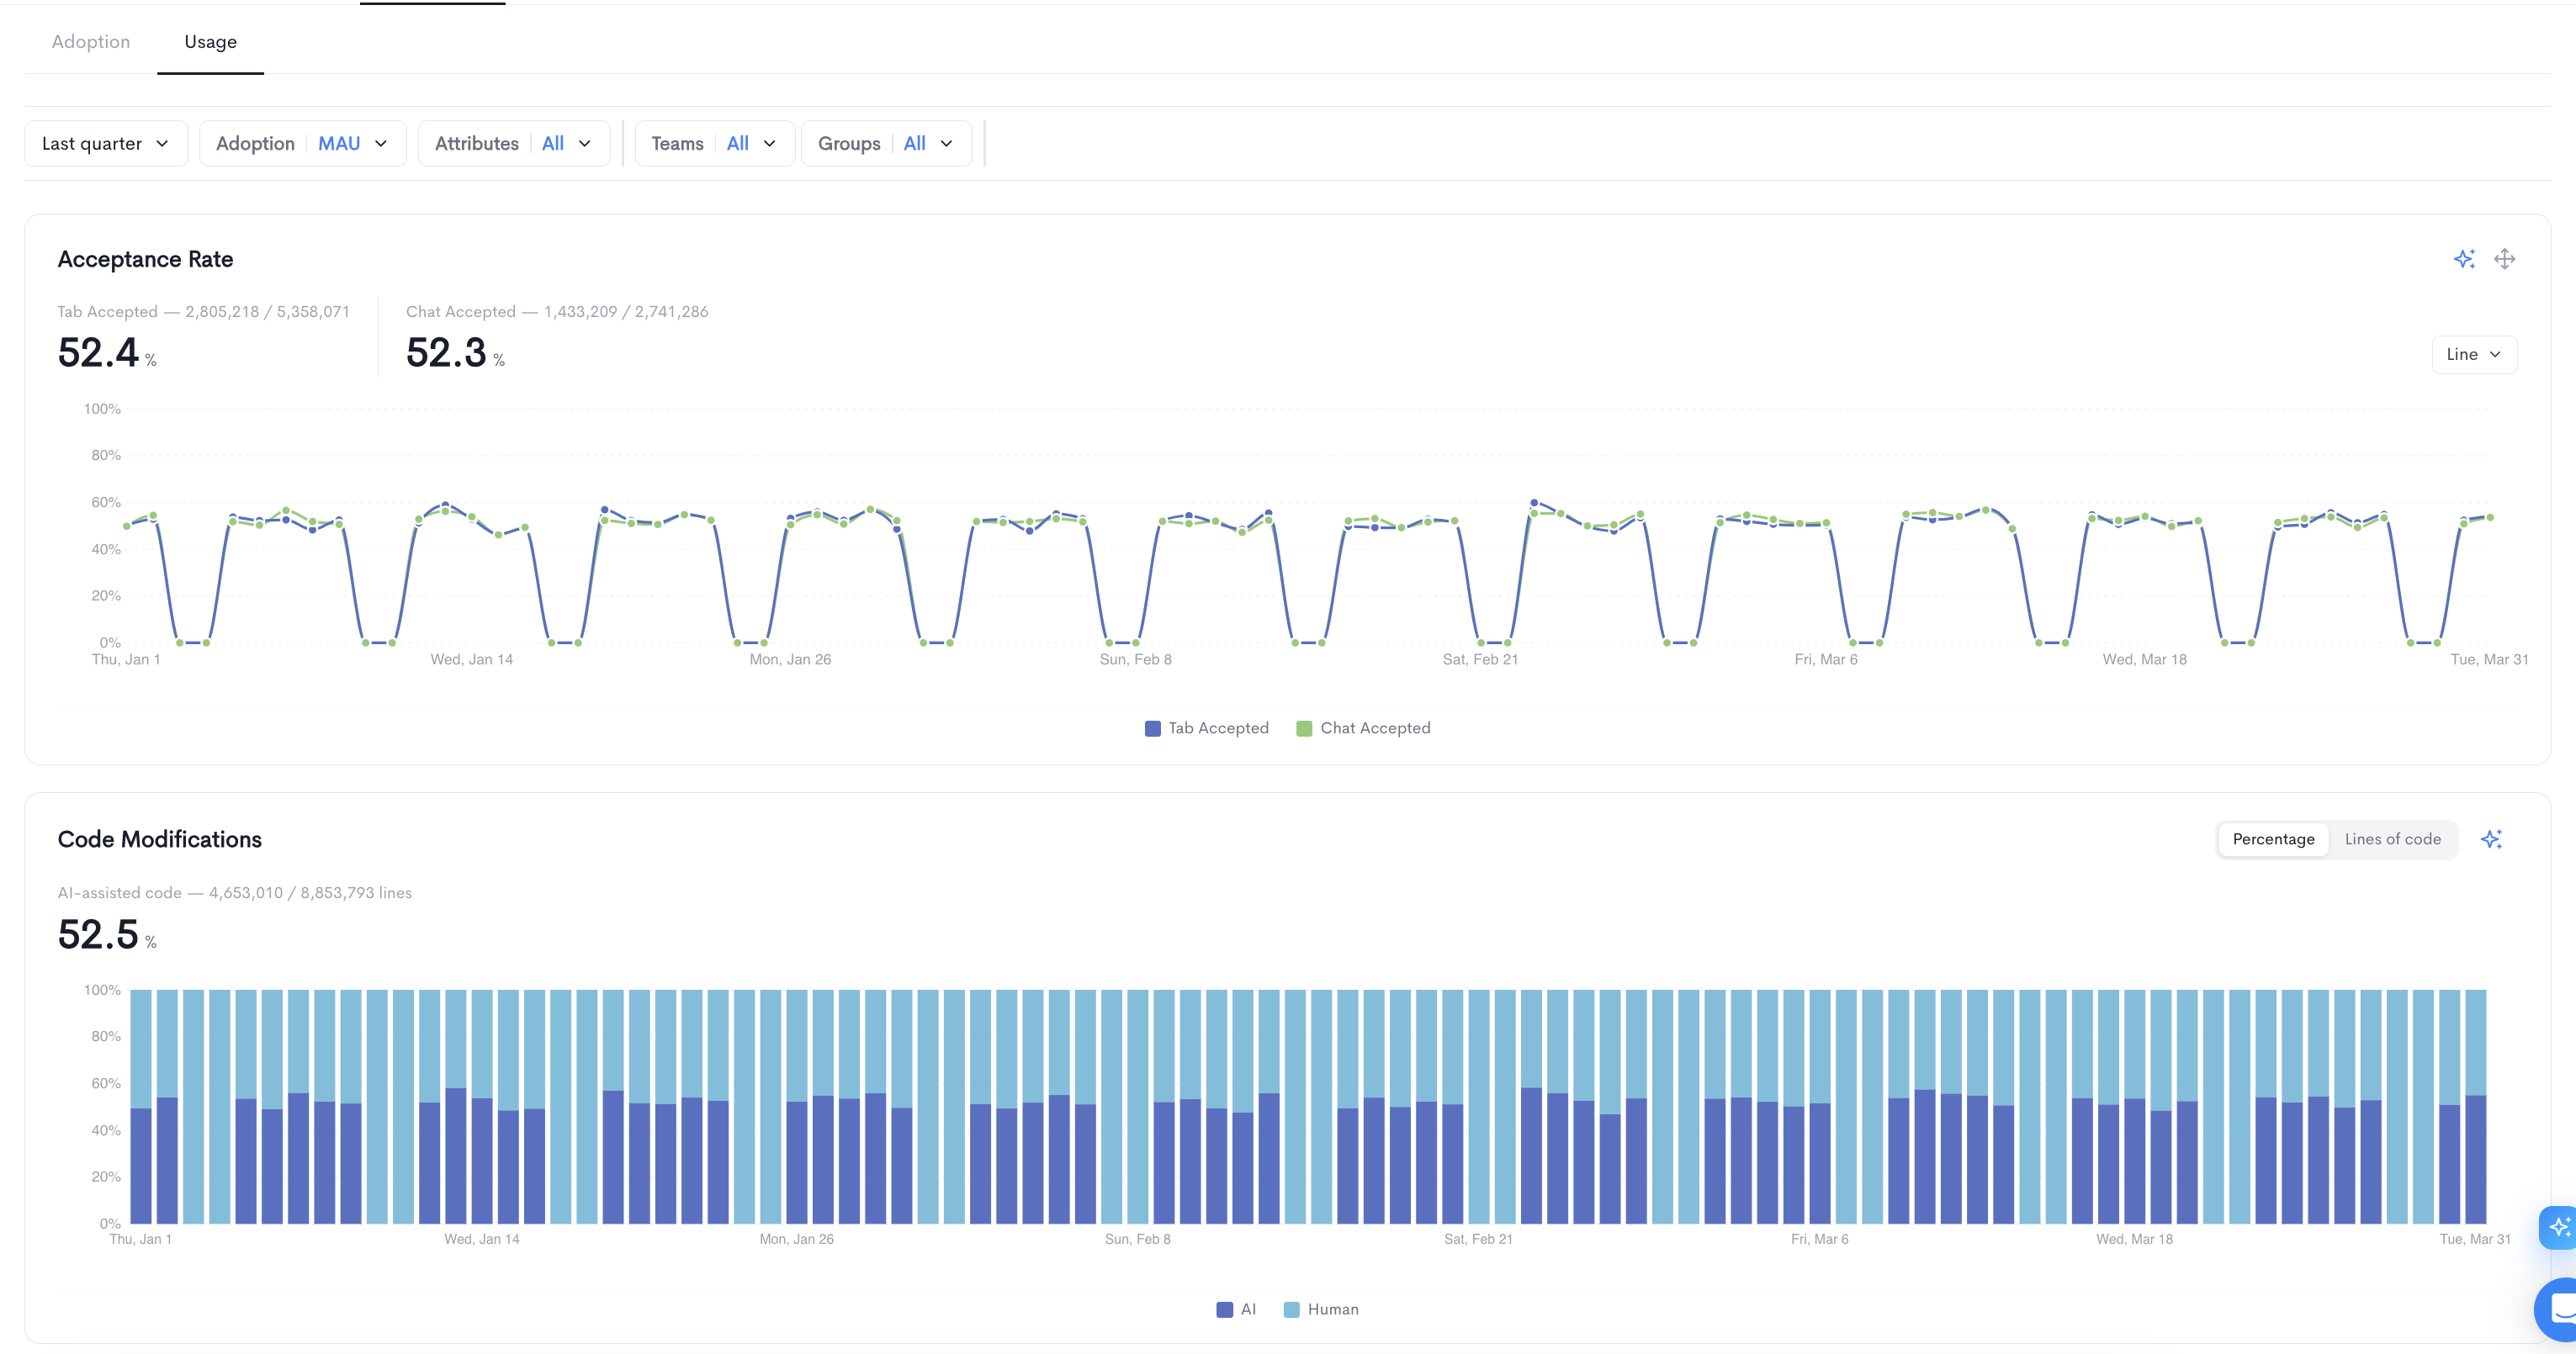
Usage sub-tab
The Usage sub-tab provides a detailed breakdown of how the tool is being used day to day.
Acceptance Rate - A line chart showing the percentage of AI suggestions accepted over time, split between Tab Accepted and Chat Accepted. The overall acceptance rate and the total number of accepted suggestions out of total suggestions are displayed above the chart.
Code Modifications - A stacked bar chart showing the percentage of code that is AI-assisted over time. The overall AI-assisted code percentage and the total lines of AI-assisted code out of total lines are displayed above the chart.
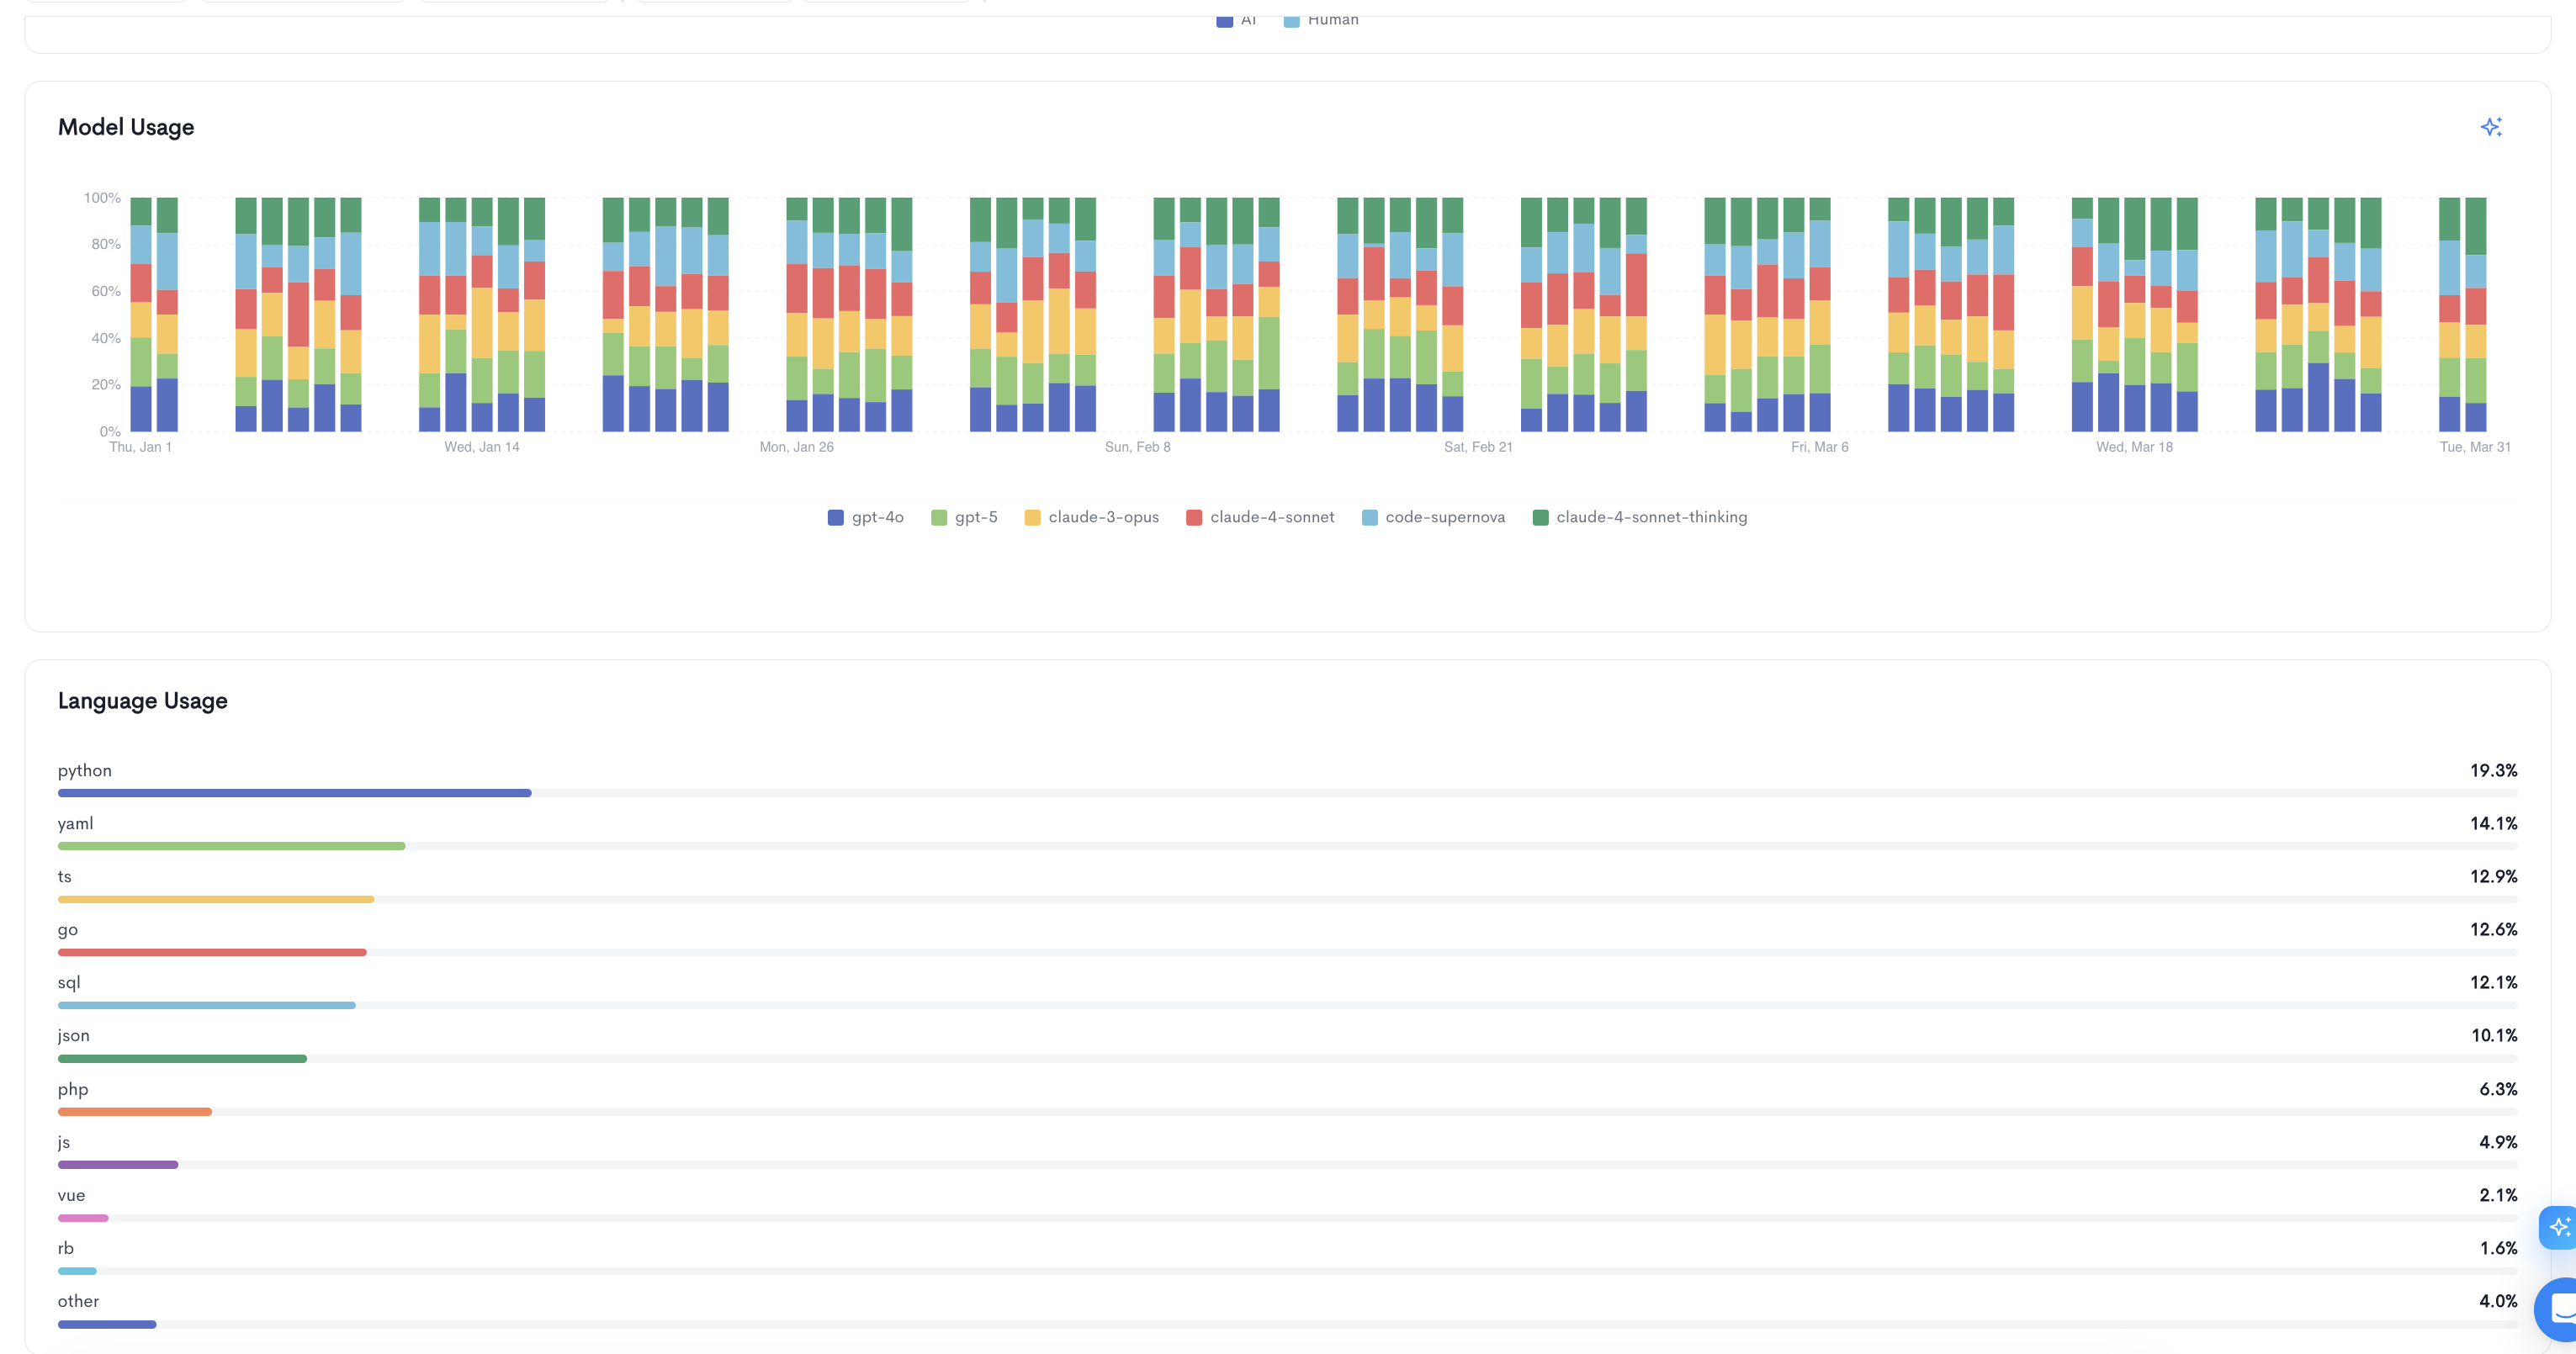
Model Usage - A stacked bar chart showing the distribution of AI model usage over time, broken down by model name.
Language Usage - A horizontal bar chart showing the distribution of usage across programming languages, with percentage values on the right.
Updated 3 months ago