

DORA
Use this page to open each individual DORA metric report.
Review how long it takes for code changes to move from the first commit to production.
Track how often your team successfully deploys code to production.
Measure the percentage of deployments that require remediation after release.
See how long it takes to recover from failures in production.
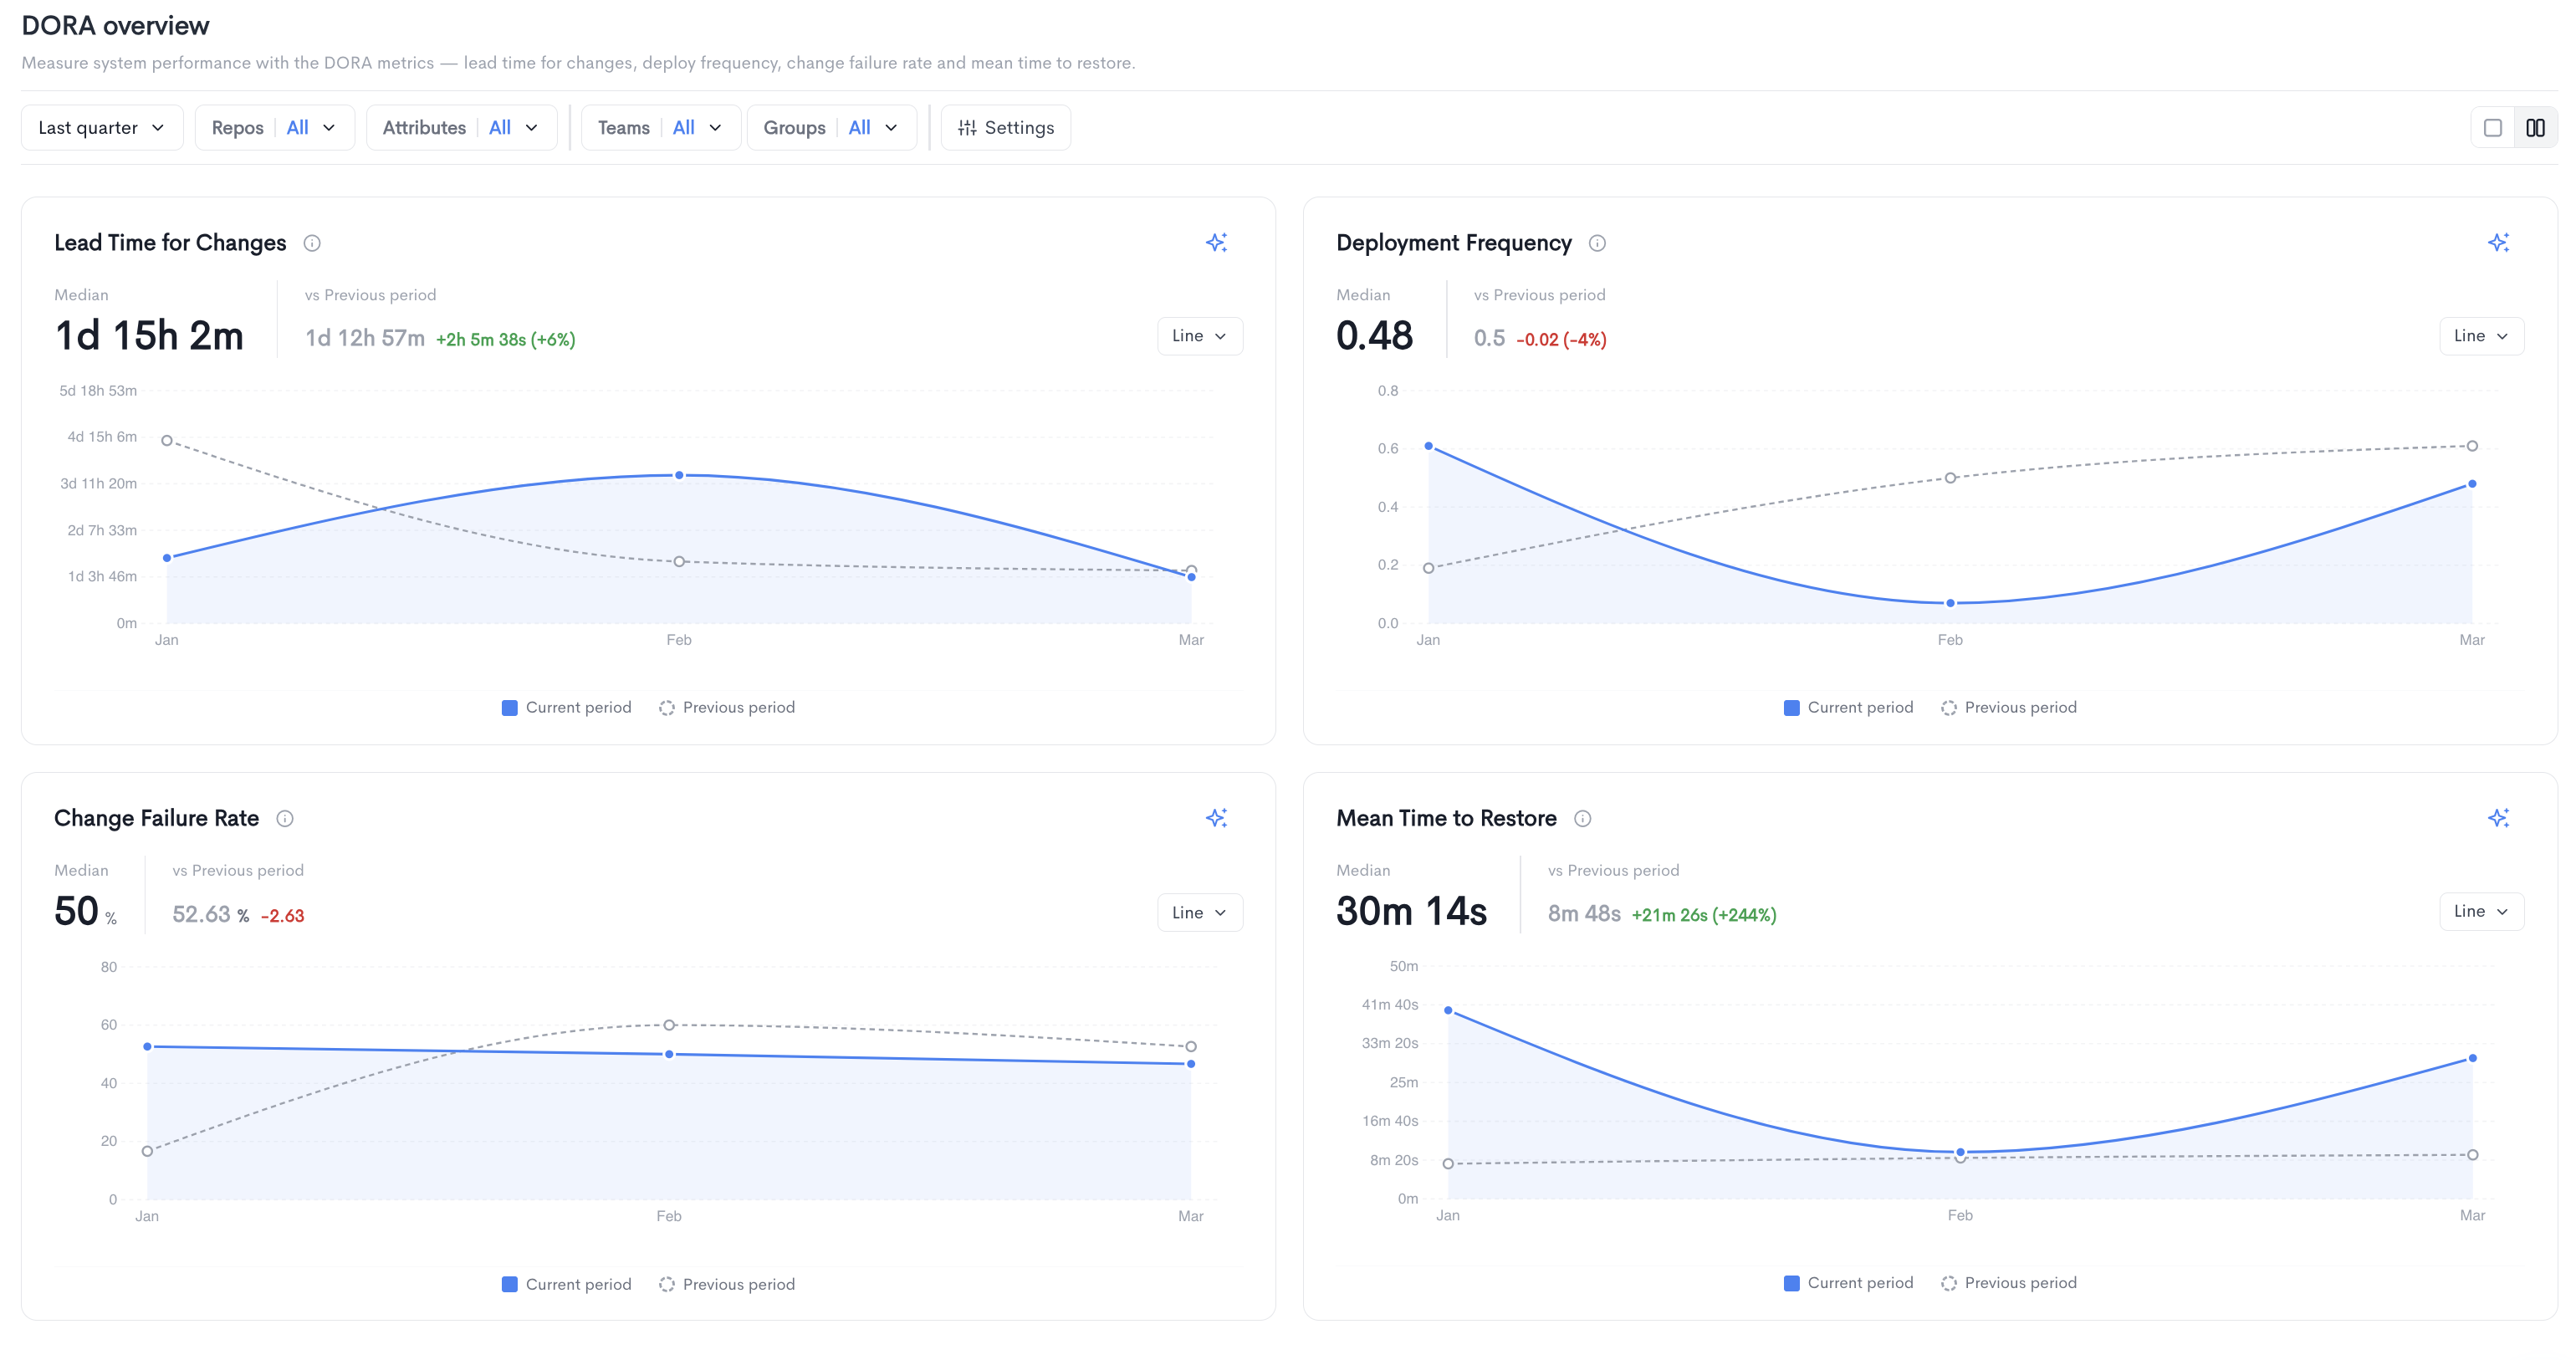
DORA Overview
The DORA Overview report measures system performance using the four DORA metrics: Lead Time for Changes, Deployment Frequency, Change Failure Rate, and Mean Time to Restore. It is accessible under Delivery in the left sidebar.
The overview displays all four metrics as individual charts, each showing the current period trend compared to the previous period. Each chart displays the median value, the previous period value, and the change between the two.
- Lead Time for Changes - The total time it takes for a code change to go from the first commit to being successfully deployed to production.
- Deployment Frequency - How often code is successfully deployed to production.
- Change Failure Rate - The percentage of deployments that result in a failure requiring remediation.
- Mean Time to Restore - The time it takes to recover from a failure in production.
Each chart can be toggled between Line and Bar views. Individual DORA metric reports can be accessed directly from the overview by clicking View report on each chart, or from the left sidebar under DORA.
Filters available at the top of the report include date range, Repos, Attributes, Teams, Groups, and Settings.
Updated 4 months ago