

Sprints Commitment
Use this page to open each Sprint Commitment metric report.
Sprint Commitment
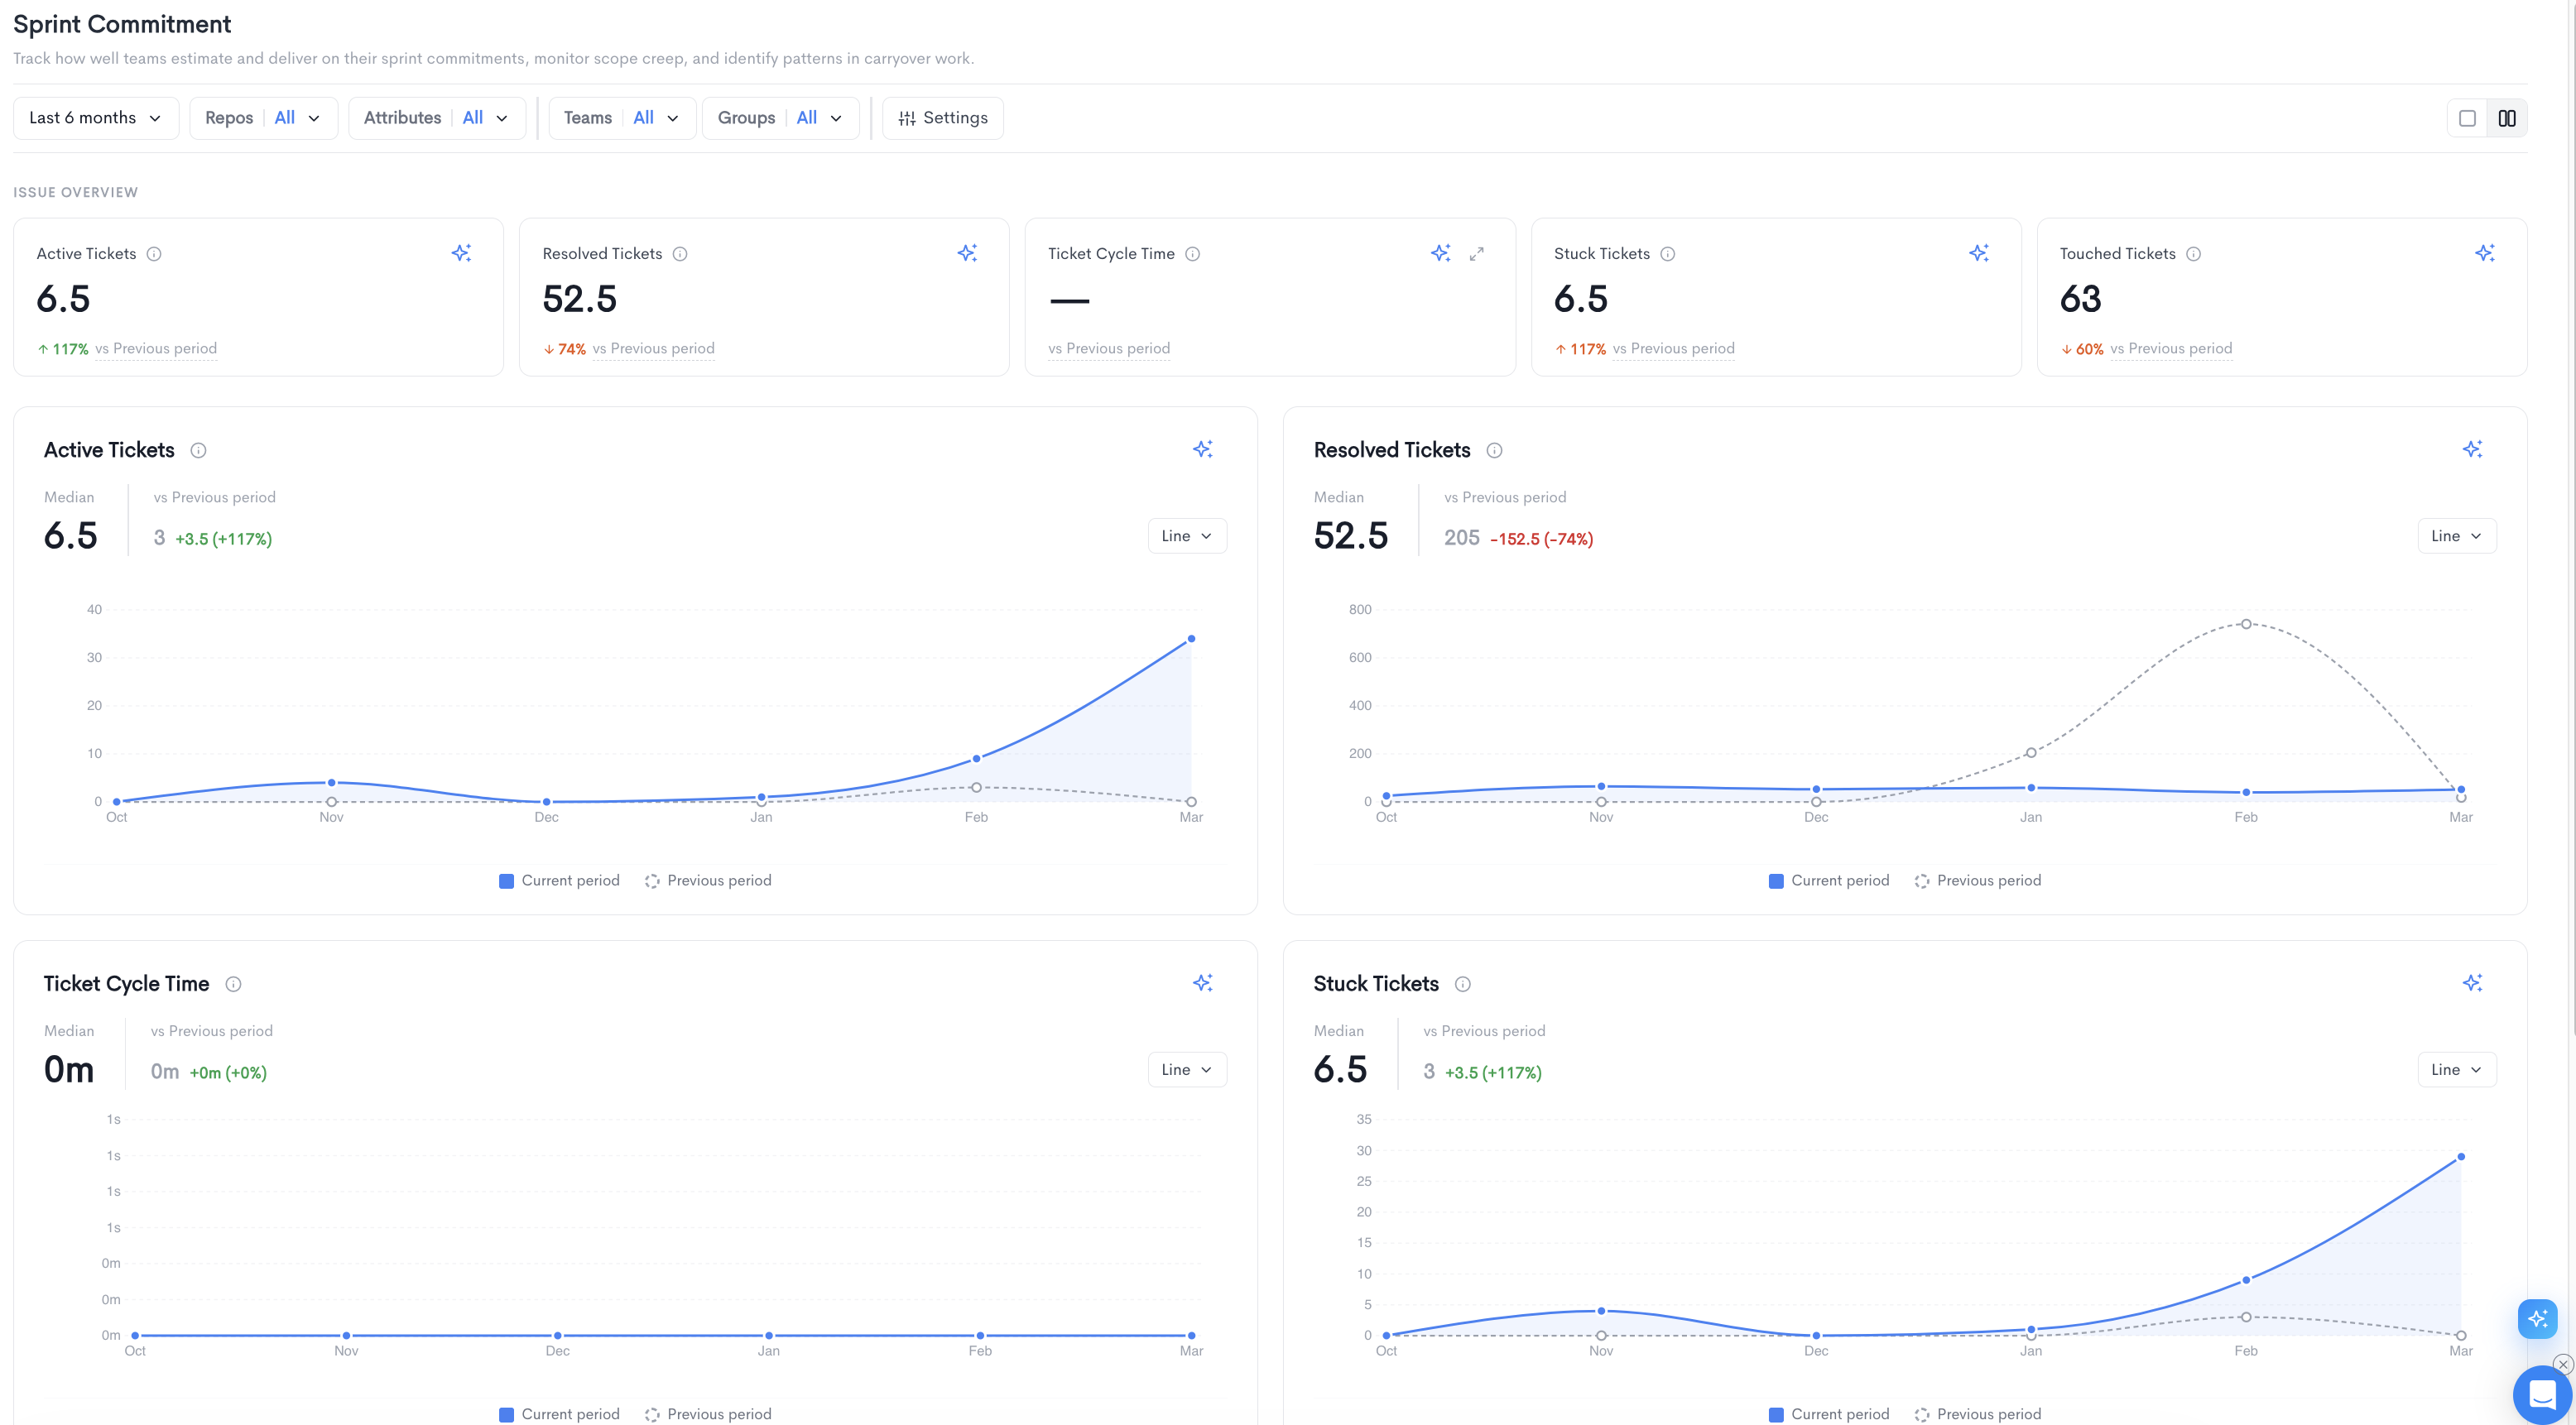
The Sprint Commitment report helps you track how well teams estimate and deliver on their sprint commitments, monitor scope creep, and identify patterns in carryover work. It is accessible under Delivery in the left sidebar.
The top of the page displays an Issue Overview summary bar with five key metrics:
- Active Tickets - The median number of tickets currently active in the selected period.
- Resolved Tickets - The median number of tickets resolved in the selected period.
- Ticket Cycle Time - The median time it takes for a ticket to move from start to completion.
- Stuck Tickets - The median number of tickets that have not progressed within the expected timeframe.
- Touched Tickets - The median number of tickets that had any activity in the selected period.
Each metric also shows a percentage change compared to the previous period.
Below the summary bar, each metric is displayed as an individual time-series chart comparing the current period to the previous period:
- Active Tickets - Tracks the number of tickets in progress over time.
- Resolved Tickets - Tracks the number of tickets completed over time.
- Ticket Cycle Time - Tracks how long tickets take to be resolved over time.
- Stuck Tickets - Tracks the number of tickets with no recent progress over time.
- Touched Tickets - Tracks the number of tickets with any activity over time.
Each chart can be toggled between Line and Bar views.
Filters available at the top of the report include date range, Repos, Attributes, Teams, Groups, and Settings. The Settings panel allows configuring:
- Granularity - The time granularity for the charts (e.g. Months).
- Calculation - The aggregation method (e.g. Median).
- Comparison - The reference period for comparison (e.g. Previous period).
Updated 4 months ago