

Waydev Agent
Ask Waydev
Ask Waydev is an AI agent that answers questions about your engineering data. Type a question in natural language and the agent queries your connected integrations, runs analysis, and returns results as text, charts, or both. Ask Waydev is accessible from the left sidebar.
Starting a conversation
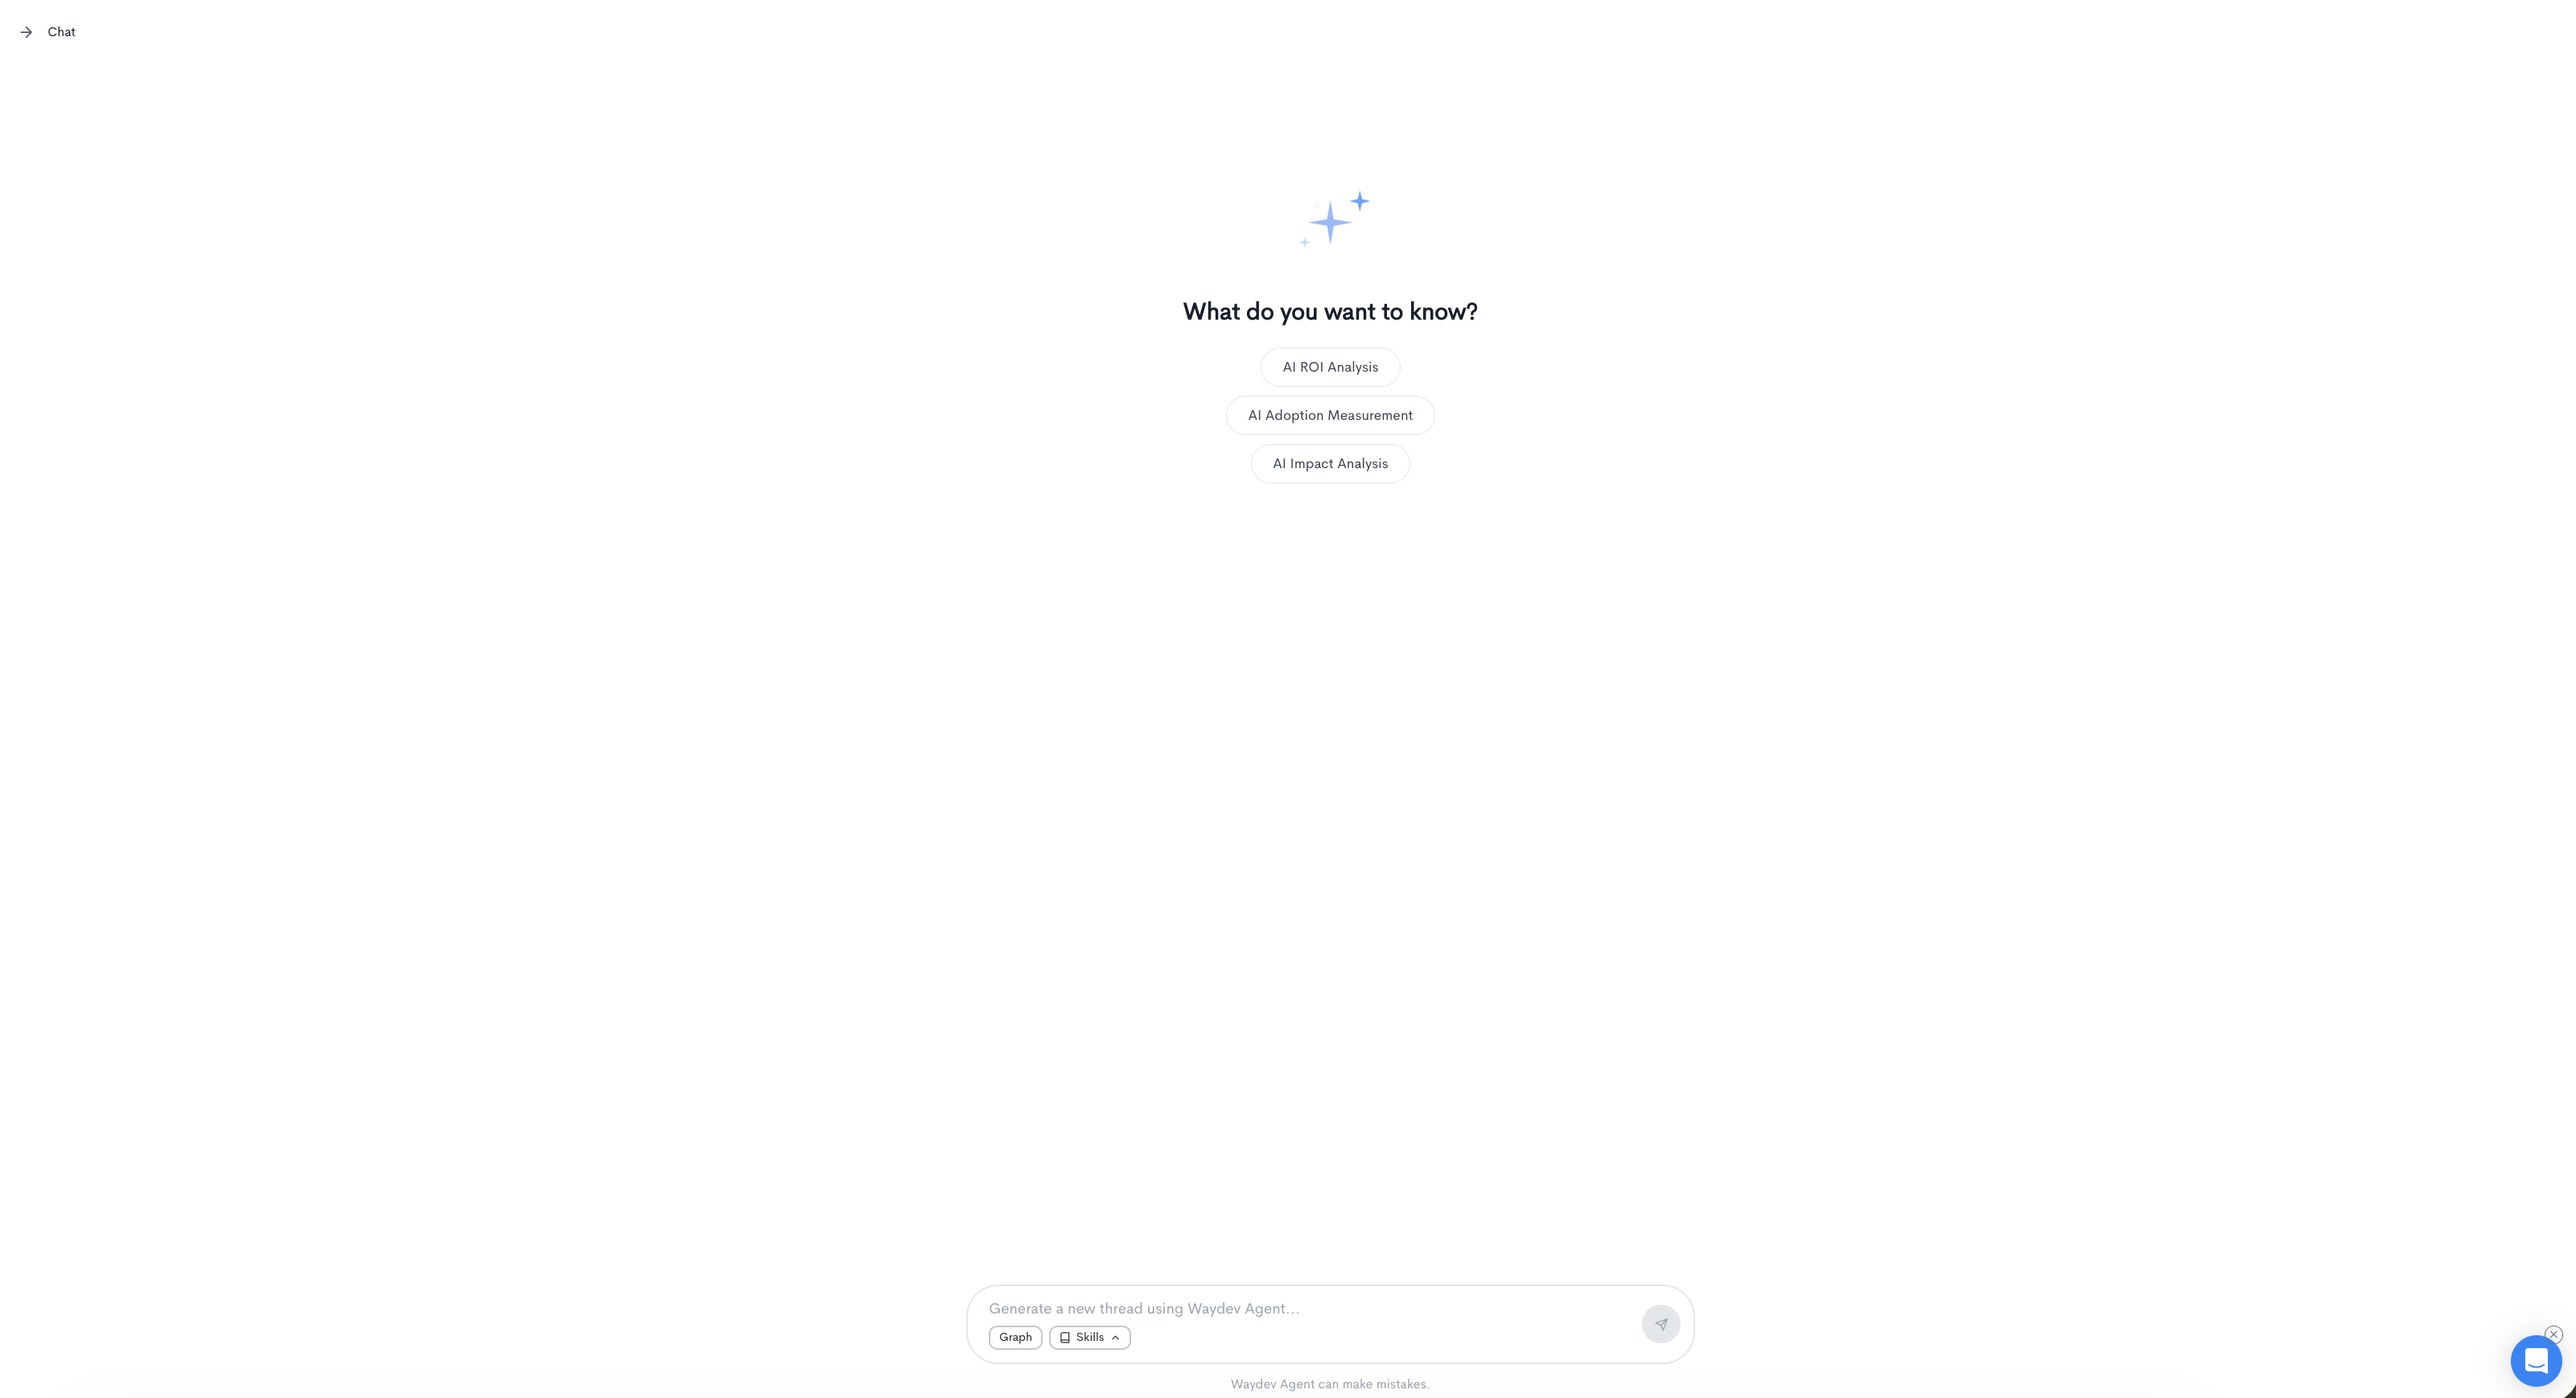
The Ask Waydev page opens with a prompt input at the bottom of the screen. You can type any question about your engineering data or select one of the suggested prompts:
- AI ROI Analysis
- AI Adoption Measurement
- AI Impact Analysis
Type your question in the Generate a new thread using Waydev Agent... field and press Enter to submit.
Thinking process
When a query is submitted, the agent displays a Thinking process panel showing how it is interpreting the request, including which metrics it will fetch, what filters it will apply, and what data it will return. This panel can be collapsed once the response is ready.
Response types
The agent can respond in two formats depending on the nature of the query:
- Text - A written analysis with ranked findings, key insights, and recommendations.
- Graph - An interactive chart generated from the queried data. The chart includes X-axis and Y-axis selectors, a Show trend line toggle, and a chart type selector with the following options: Line, Bar, Area, Scatter, and Stacked Bar. You can switch between the table view and chart view using the icons below the graph.
The Graph setting can be toggled on and off.
SQL Query editor
Each graph response includes an SQL Query label below the thinking process panel. Click it to expand and view the query the agent used to generate the result. Click Edit to open the Edit SQL Query modal.
The modal is split into two panels:
- Left panel — A scrollable list of all available database tables. Click any table to expand it and view its columns and data types.
- Right panel — A SQL editor where you can view and modify the query directly.
The editor includes two actions:
- Format — Automatically formats the SQL query for readability.
- Run — Executes the query and updates the graph with the new results.
Skills
Skills provide the agent with specialized instructions and capabilities. Active skills are shown as badges in the input bar. Click the Skills button to open the skills picker and select which skills to apply to the current thread.
When a skill is active, its name appears as a tag next to the input field. Multiple skills can be active at the same time.
Note: Skills can be managed under Settings → Skills. See the Skills documentation for more details.
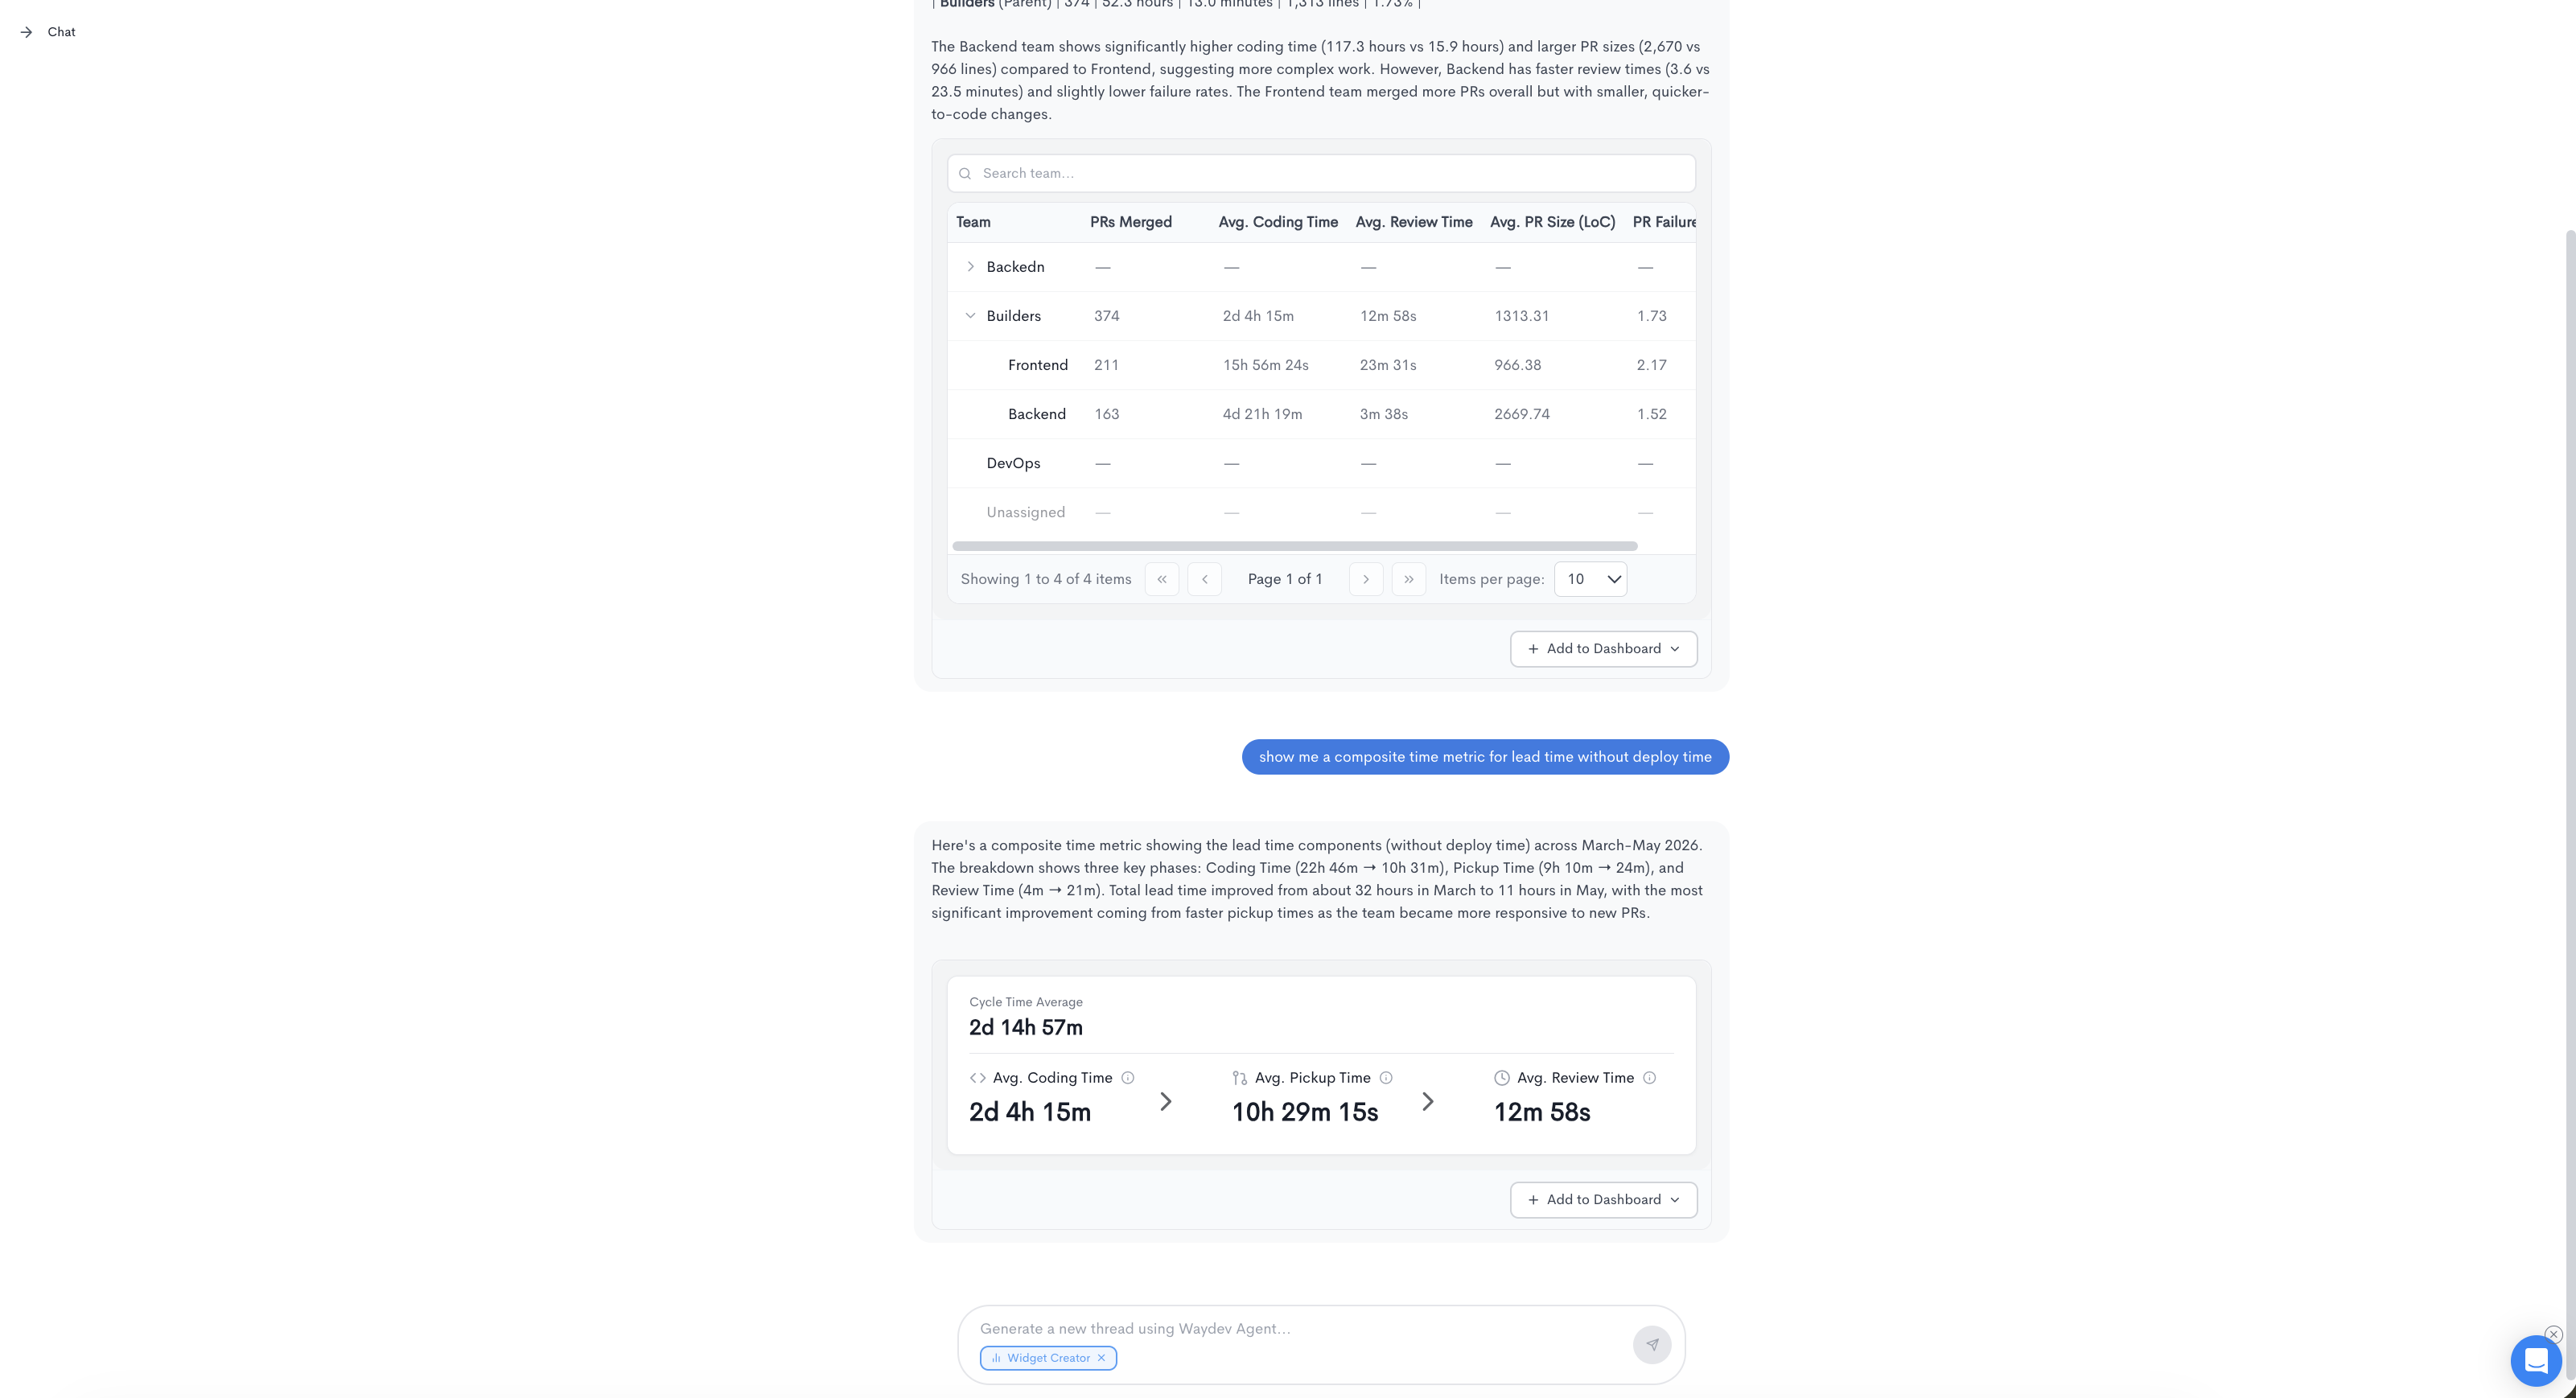
Widget Creator skill
The Widget Creator is a system skill that lets you create dashboard widgets directly from the chat. To use it, select Widget Creator from the skills picker before submitting your query.
When the Widget Creator skill is active, the agent generates a widget based on your request. The widget preview appears inline in the chat and includes one of the following widgets:
- Metric Card - Display a single metric value at a glance.
- Metric Radial Bar - Circular progress visualization for one metric.
- Metrics Table - Compare multiple metrics in a structured table.
- Chart - Visualize metric trends over a time range with the following options: Line, Bar, Area, Scatter, and Stacked Bar
- Metric Focus - Deep dive into up to 5 key metrics.
- Heatmap - Color-coded intensity view across metrics.
- Composite Time Metric - Combine up to 4 time-based metrics.
- An + Add to Dashboard button to save the widget to an existing dashboard
Clicking + Add to Dashboard opens a dropdown listing your available dashboards. Select a dashboard to add the widget to it directly.
Example prompts when using Widget Creator:
- "Create a widget with AI metrics, make it a graph with separate metrics"
- "Show me a widget with the most used AI tools"
Updated about 2 months ago