

Dashboards
Dashboards let you build custom views of your engineering data by combining widgets from any report in Waydev. They are accessible under Studio in the left sidebar.
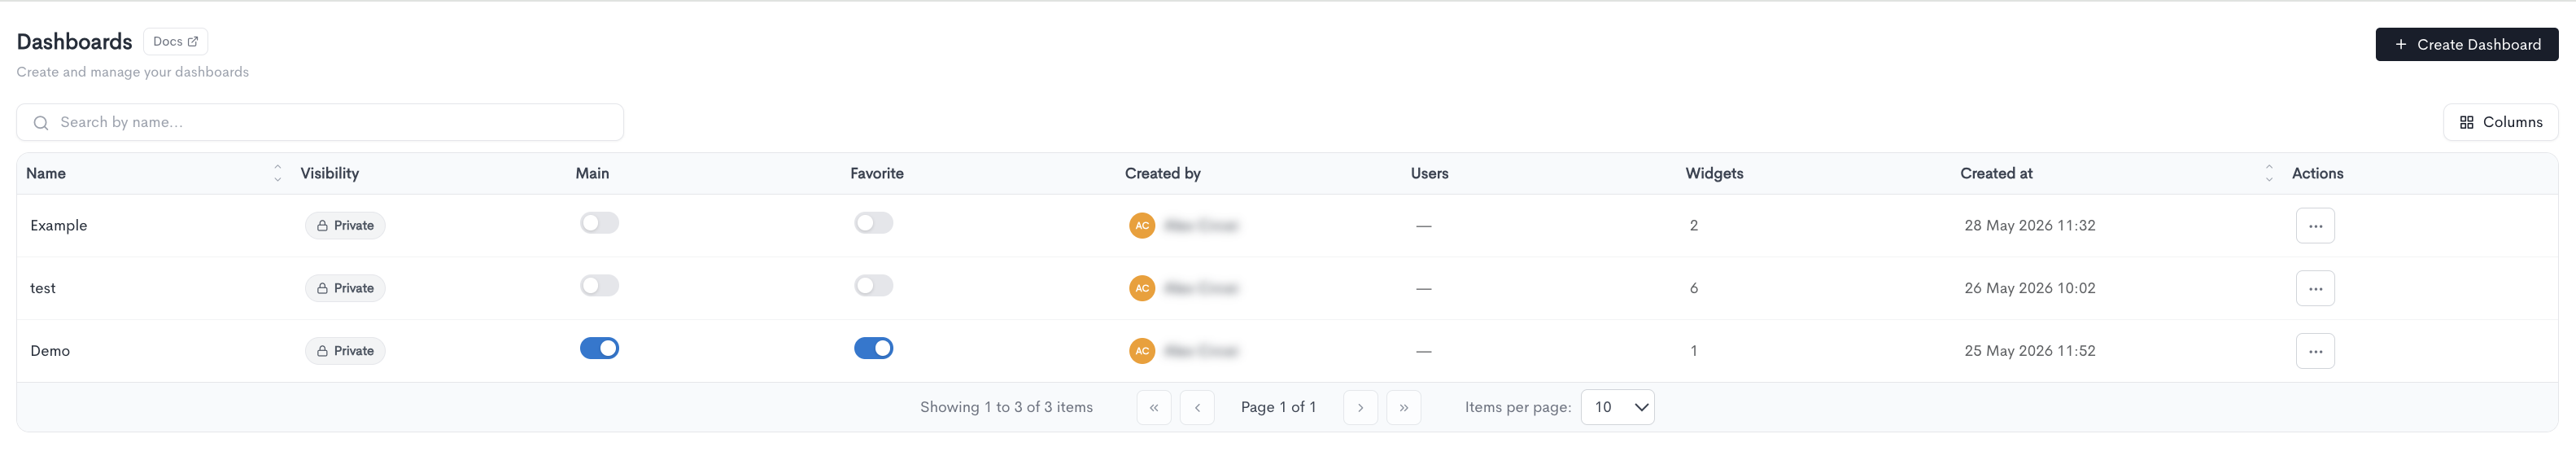
Dashboards list
The main page displays all dashboards you have access to in a table with the following columns:
- Name - The name of the dashboard.
- Visibility - Whether the dashboard is Private or Public.
- Main - A toggle indicating whether this is set as your main dashboard.
- Favorite - A toggle to mark the dashboard as a favorite for quick access.
- Created by - The user who created the dashboard.
- Users - The number of users with explicit access to the dashboard.
- Widgets - The number of widgets on the dashboard.
- Created at - The date and time the dashboard was created.
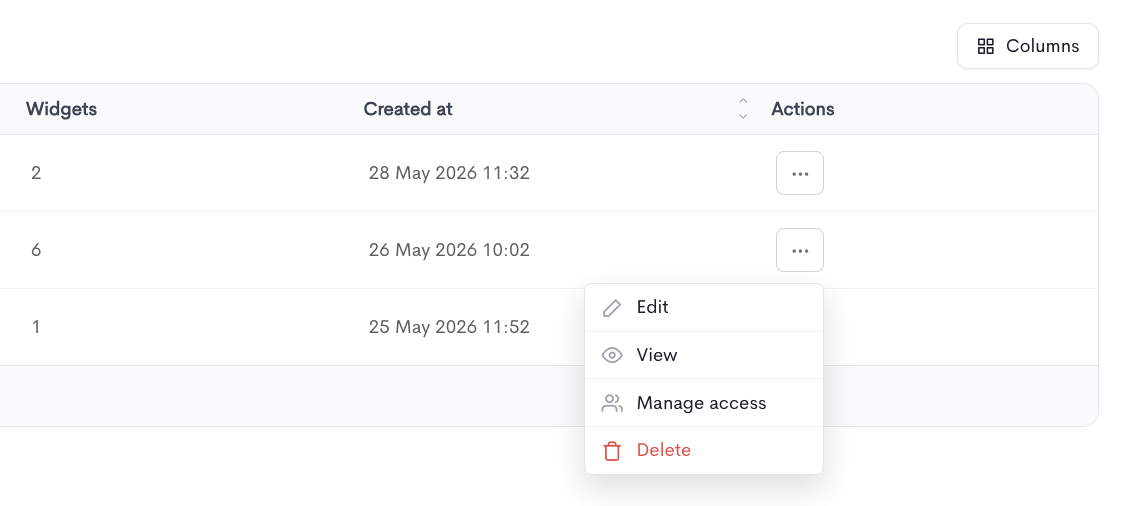
- Actions - Options to manage the dashboard via the ··· menu: Edit, View, Manage access, and Delete.
To create a new dashboard, click + Create Dashboard in the top-right corner.
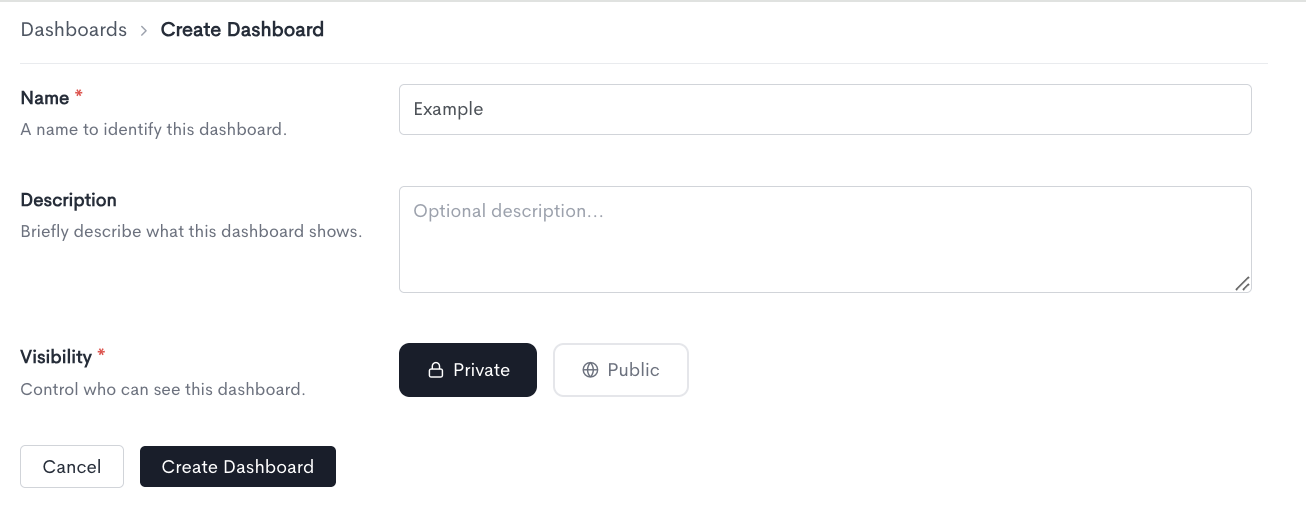
Creating a dashboard
When creating a new dashboard, fill in the following fields:
- Name - A name to identify this dashboard. Required.
- Description - An optional description of what this dashboard shows.
- Visibility - Choose between Private (visible only to you and users you explicitly grant access to) or Public (visible to everyone in the workspace).
Click Create Dashboard to save. Click Cancel to discard and return to the Dashboards list.
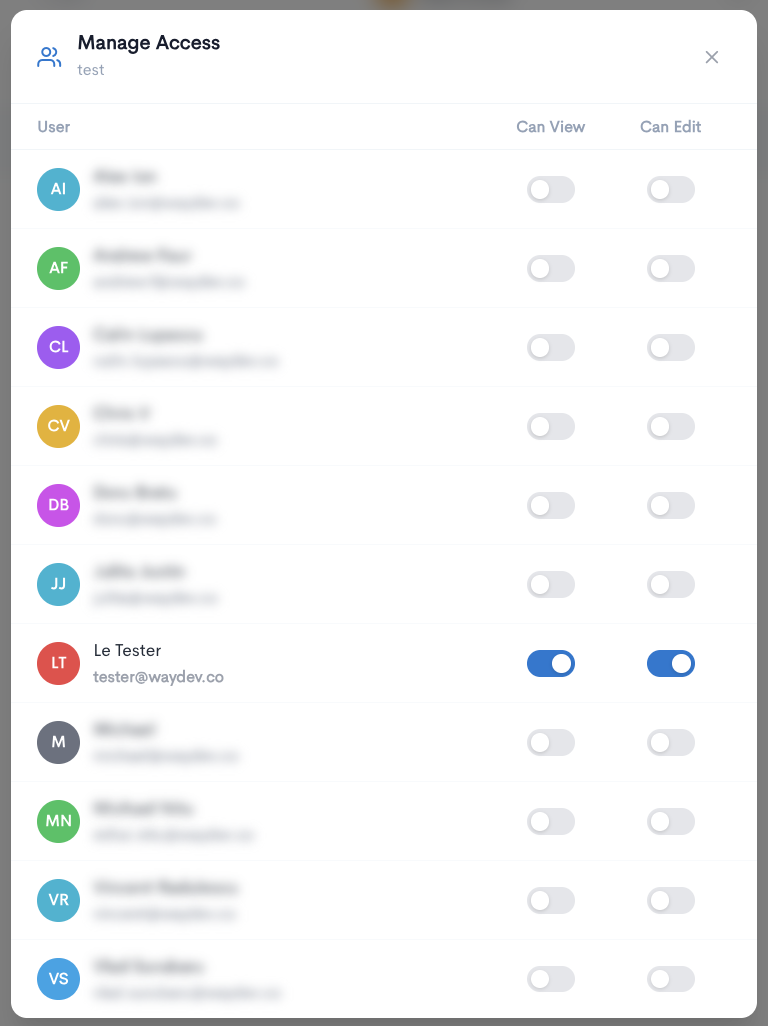
Managing access
To control who can view or edit a dashboard, open the ··· menu on any dashboard row and select Manage access. The dialog lists all users in the workspace with two toggles per user:
- Can View - Grants the user read access to the dashboard.
- Can Edit - Grants the user edit access to the dashboard.
Granting someone edit permission automatically grants view permission as well. Removing edit permission from a user does not remove their view permission — both need to be turned off separately if you want to revoke all access.
If you do not have edit permission on a dashboard, you can clone it to create your own editable copy.
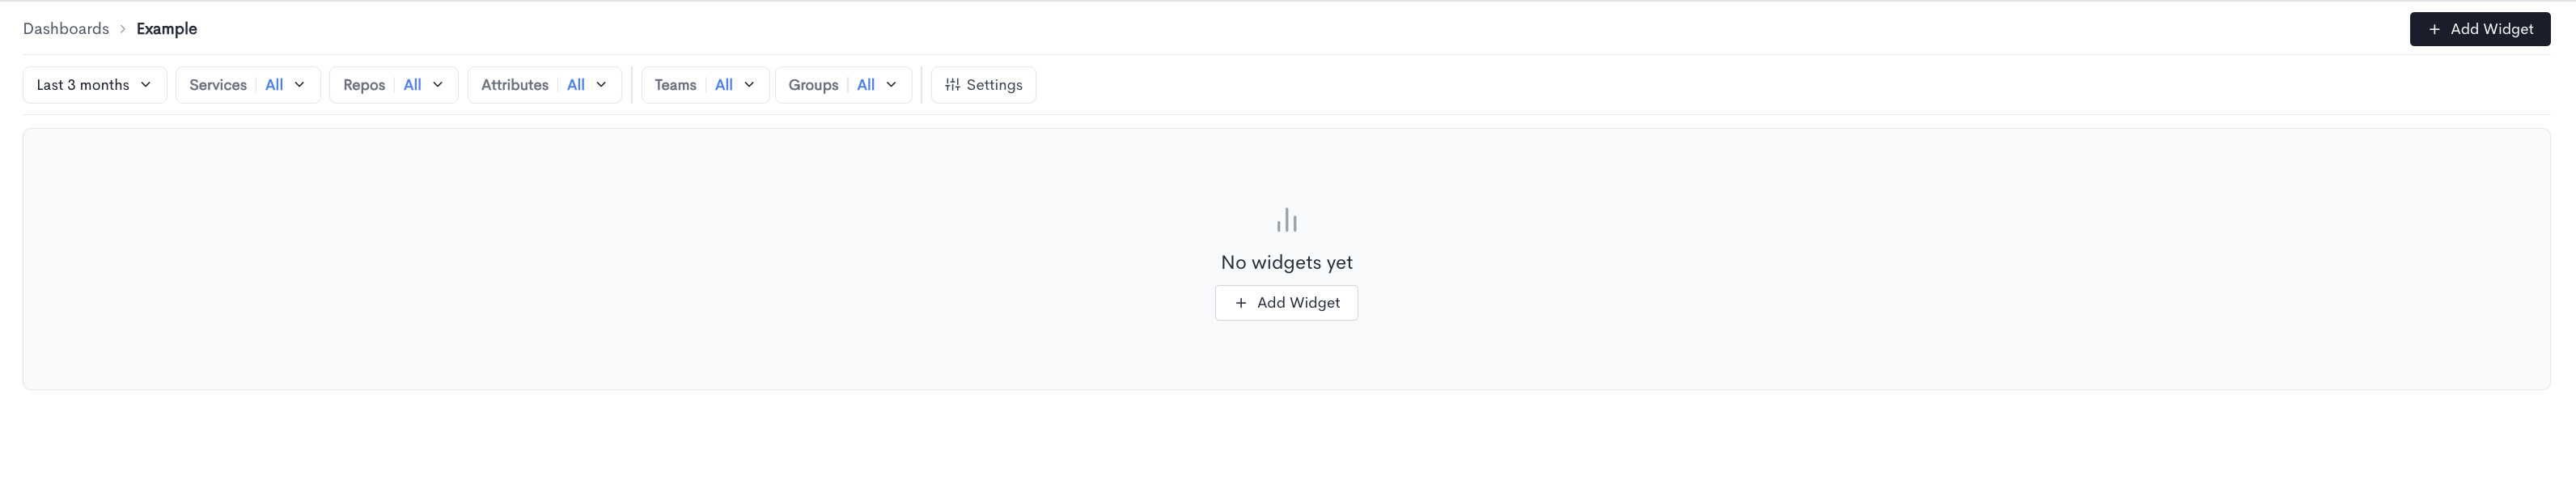
Adding widgets
Once a dashboard is created, open it and click + Add Widget in the top-right corner, or from the empty state. Adding a widget is a three-step process.
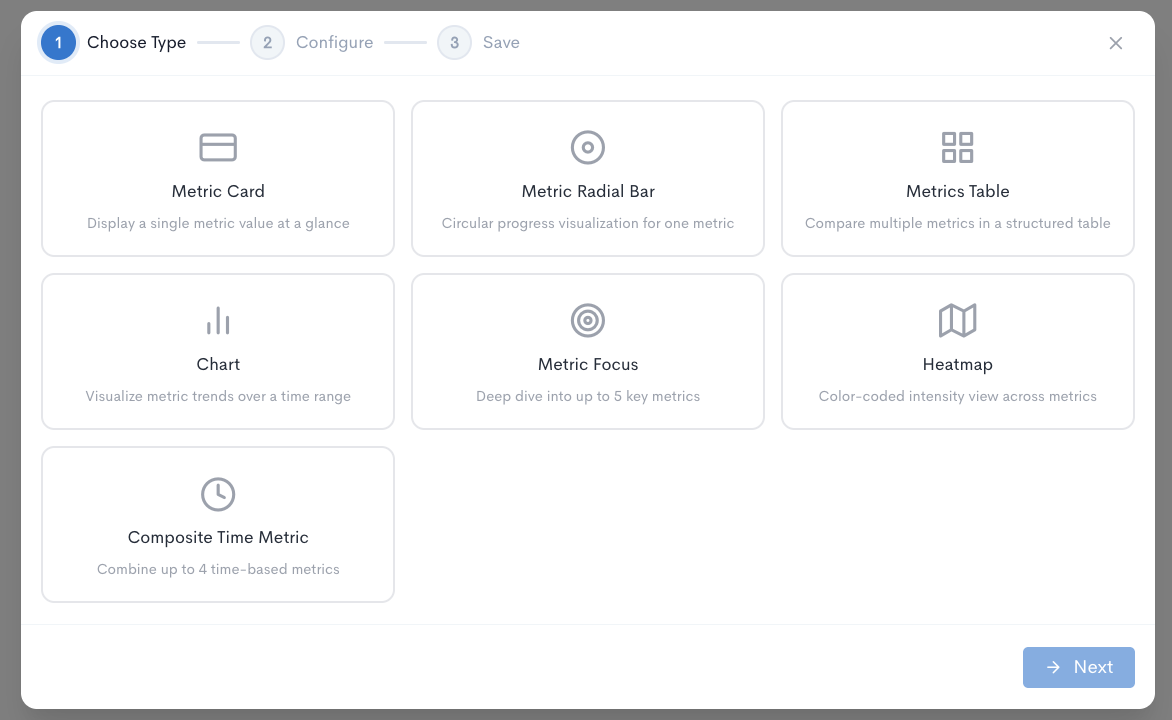
Step 1: Choose type
Select one of the following widget types:
- Metric Card - Displays a single metric value at a glance.
- Metric Radial Bar - Circular progress visualization for one metric.
- Metrics Table - Compares multiple metrics in a structured table.
- Chart - Visualizes metric trends over a time range.
- Metric Focus - Deep dive into up to 5 key metrics.
- Heatmap - Color-coded intensity view across metrics.
- Composite Time Metric - Combines up to 4 time-based metrics.
Click Next to proceed.
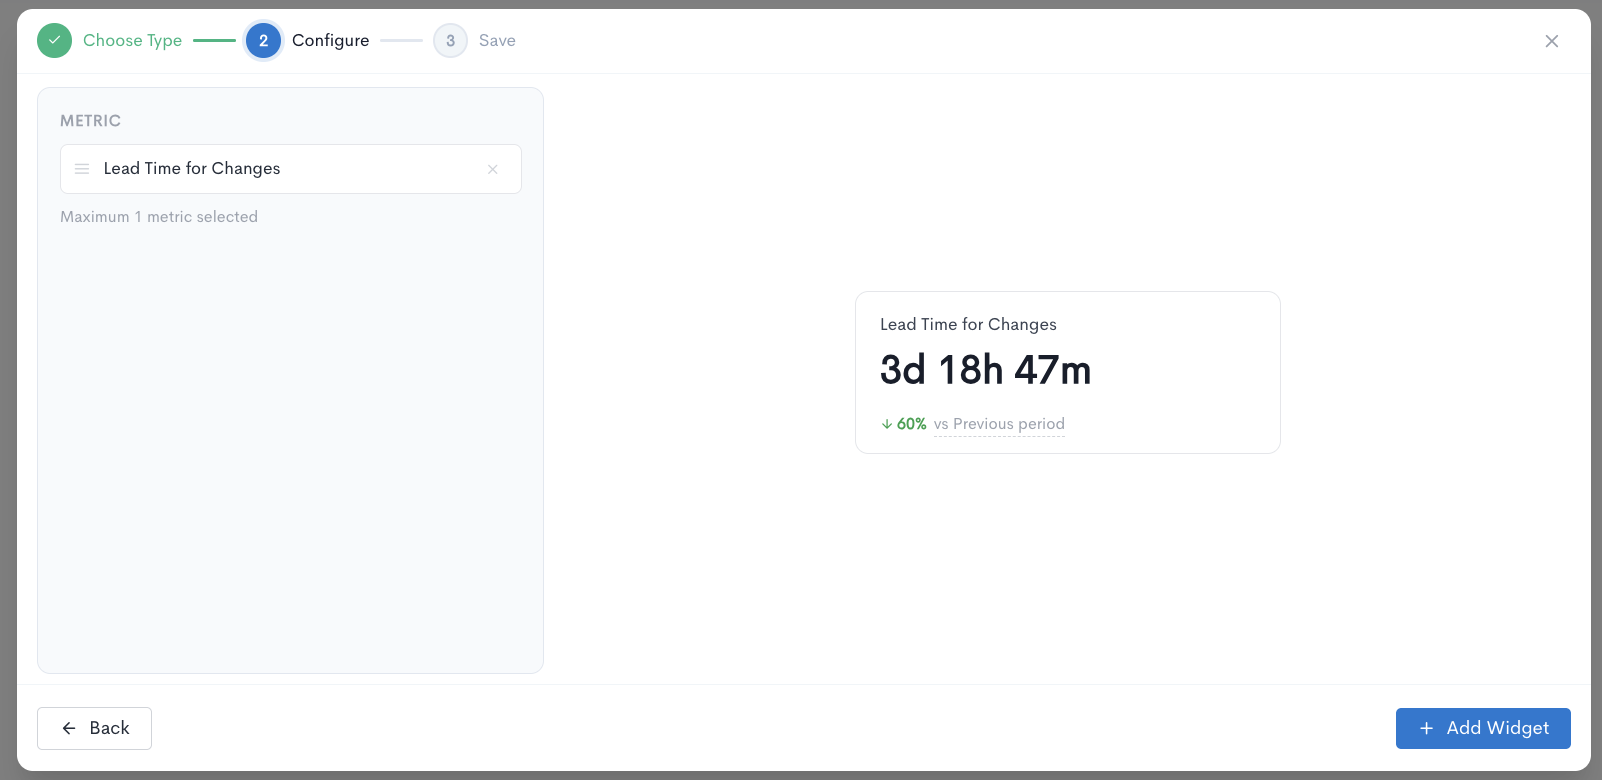
Step 2: Configure
Select the metric or metrics you want the widget to display. A live preview appears on the right as you configure. The metric dropdown is searchable and includes all available metrics from across Waydev's reports, including DORA metrics, AI metrics, PR analytics, and more.
Each widget type has a maximum number of metrics it supports. For example, Metric Card supports a maximum of 1 metric. Once the limit is reached, no additional metrics can be added.
Click + Add Widget to save and place the widget on the dashboard. Click Back to return to the widget type selection.
Widget settings
Each widget on a dashboard has individual controls accessible from the widget header:
- The resize handle in the bottom-right corner lets you adjust the widget's size on the dashboard.
- The edit icon opens the widget configuration to change the metric or type.
- The delete icon removes the widget from the dashboard.
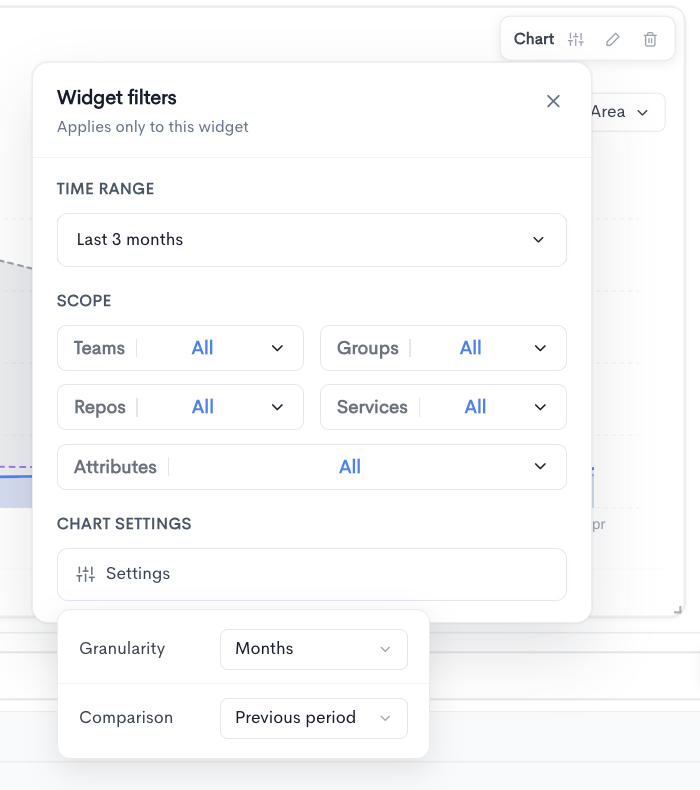
Widget filters
Each widget supports its own set of filters that apply only to that widget, independently of the dashboard-level filters. Click the filter icon on the widget header to open the Widget filters panel. Available filter options include:
- Time Range - The period of data shown in the widget.
- Scope - Filter by Teams, Groups, Repos, Services, and Attributes.
- Chart Settings - Configure Granularity and Comparison period for chart-based widgets.
Widget-level filters override the dashboard-level filters for that specific widget, allowing you to show different time ranges or team scopes side by side on the same dashboard.
Dashboard filters
The top of each dashboard includes global filters that apply to all widgets on the dashboard by default:
- Date range
- Services
- Repos
- Attributes
- Teams
- Groups
- Settings (granularity and comparison period)
Individual widgets can override these filters using their own Widget filters panel.
Updated 2 months ago