

Change Failure Rate
View the Change Failure Rate report.
Change Failure Rate
The Change Failure Rate report measures the proportion of deployments that result in failures or incidents in a given time period.
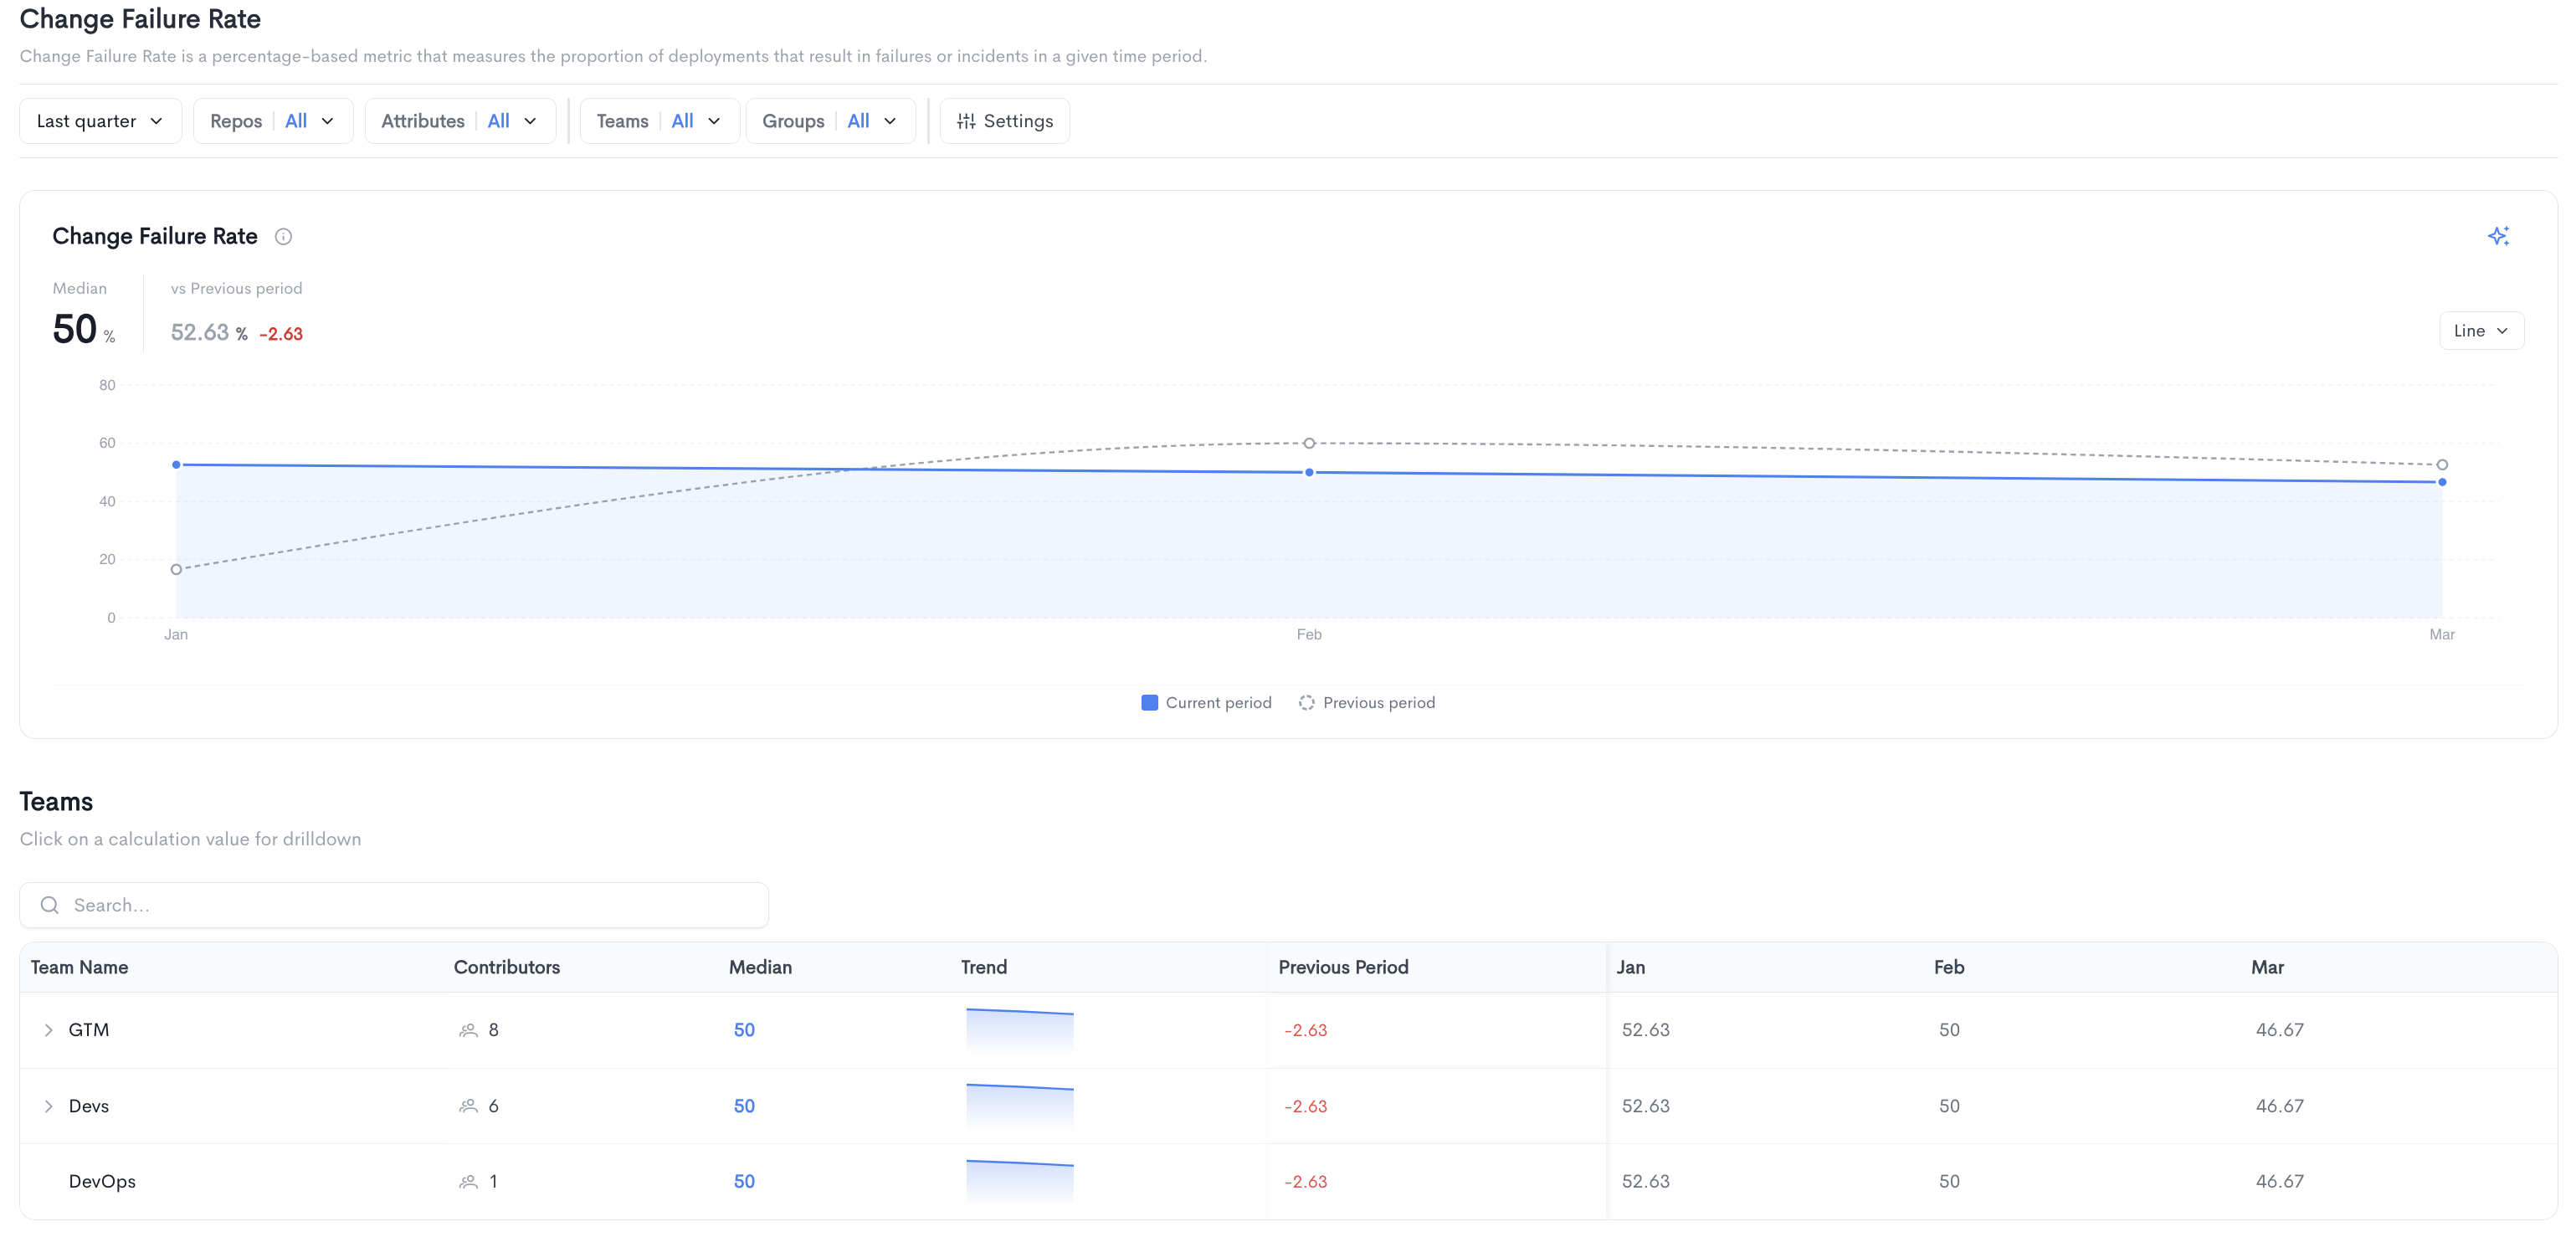
The top of the page shows the median change failure rate for the selected period alongside a comparison to the previous period. The chart displays the change failure rate trend over time, comparing the current period to the previous period. It can be toggled between Line and Bar views.
Teams - A searchable table breaking down change failure rate per team, with the following columns:
- Team Name - The name of the team.
- Contributors - The number of contributors in the team.
- Median - The median change failure rate for the team. Clicking on a value opens a drilldown view.
- Trend - A sparkline showing the change failure rate trend over time.
- Previous Period - The change in failure rate compared to the previous period.
- Monthly columns showing the median change failure rate per period.
Teams can be expanded to reveal sub-teams.
Filters available at the top of the report include date range, Repos, Attributes, Teams, Groups, and Settings.
Change Failure Rate drilldown
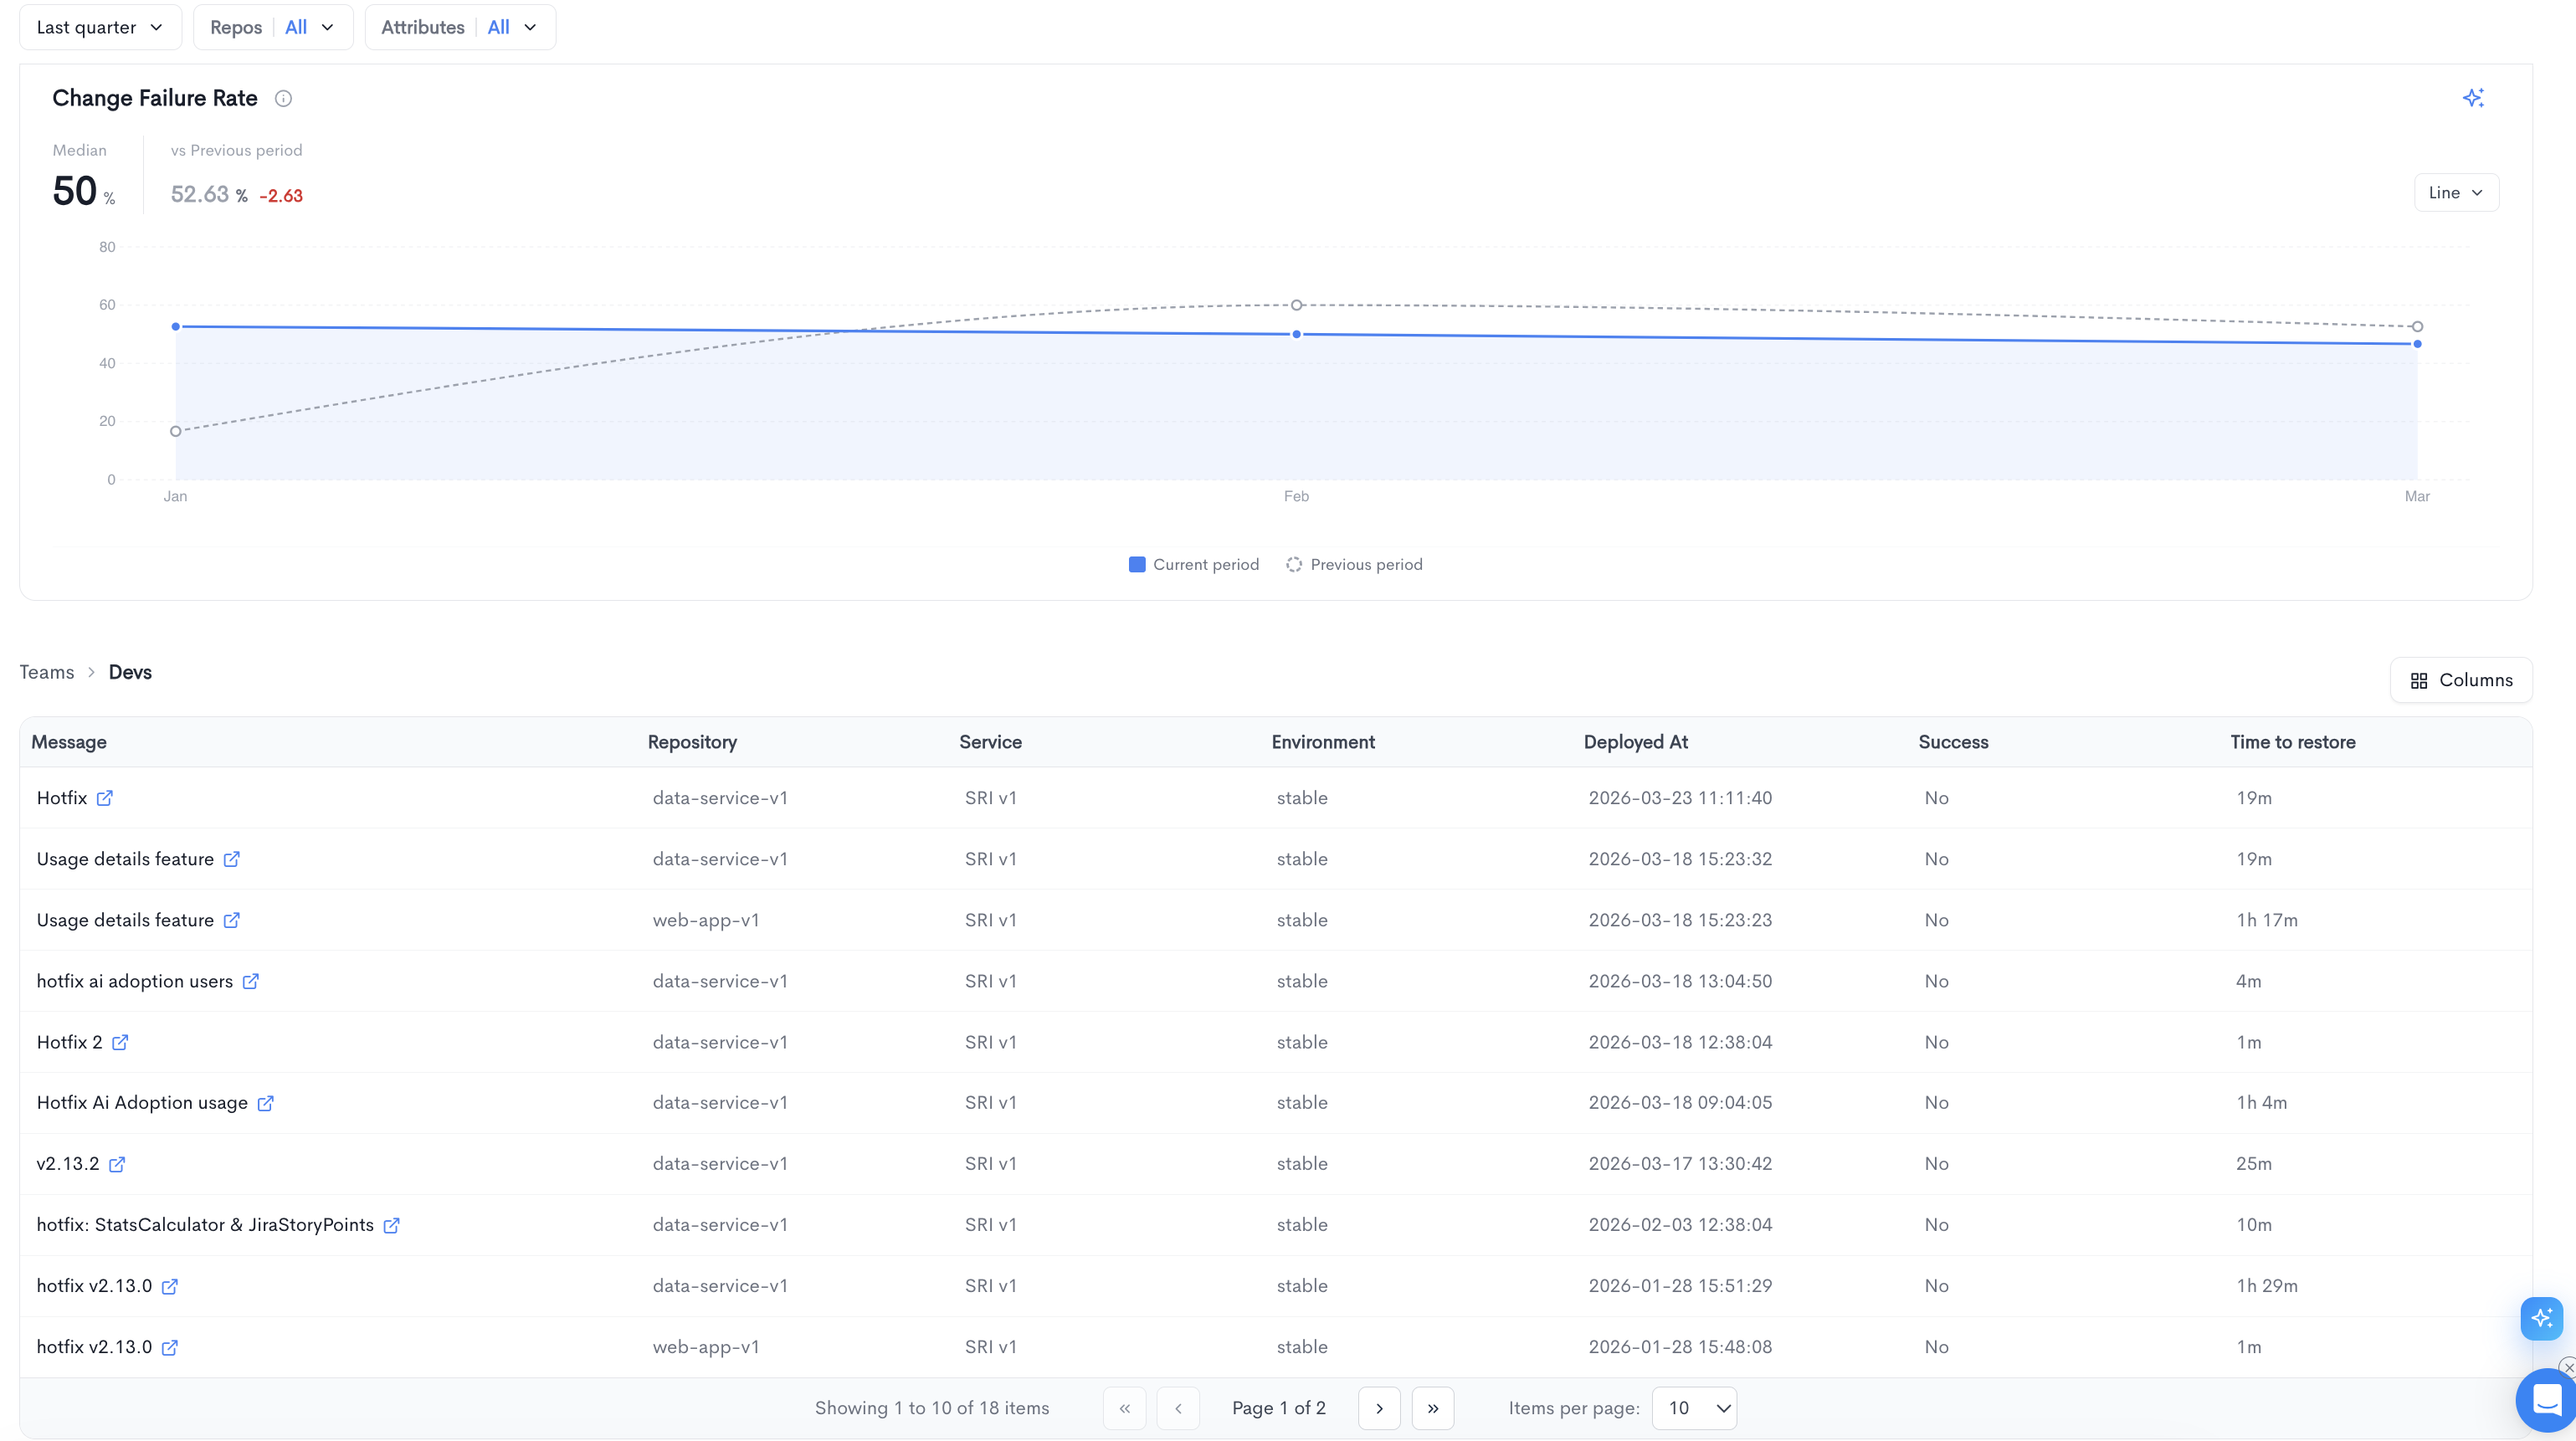
Clicking on a team's median change failure rate value opens a drilldown view for that specific team. The drilldown shows a detailed list of all failed deployments that contributed to the failure rate calculation for the selected period.
The top of the drilldown displays the median change failure rate for the selected team alongside a comparison to the previous period, along with a trend chart.
Below the chart, a paginated table lists all individual failed deployments with the following columns:
- Message - The deployment message, linked to the source provider.
- Repository - The repository where the deployment was made.
- Service - The service associated with the deployment.
- Environment - The target environment (e.g. stable).
- Deployed At - The date and time of the deployment.
- Success - Whether the deployment was successful.
- Time to restore - The time it took to restore service after the failed deployment.
The table is paginated and shows 10 items per page by default. You can adjust the visible columns using the Columns button.
Updated 4 months ago