

Code to Production
Code to Production
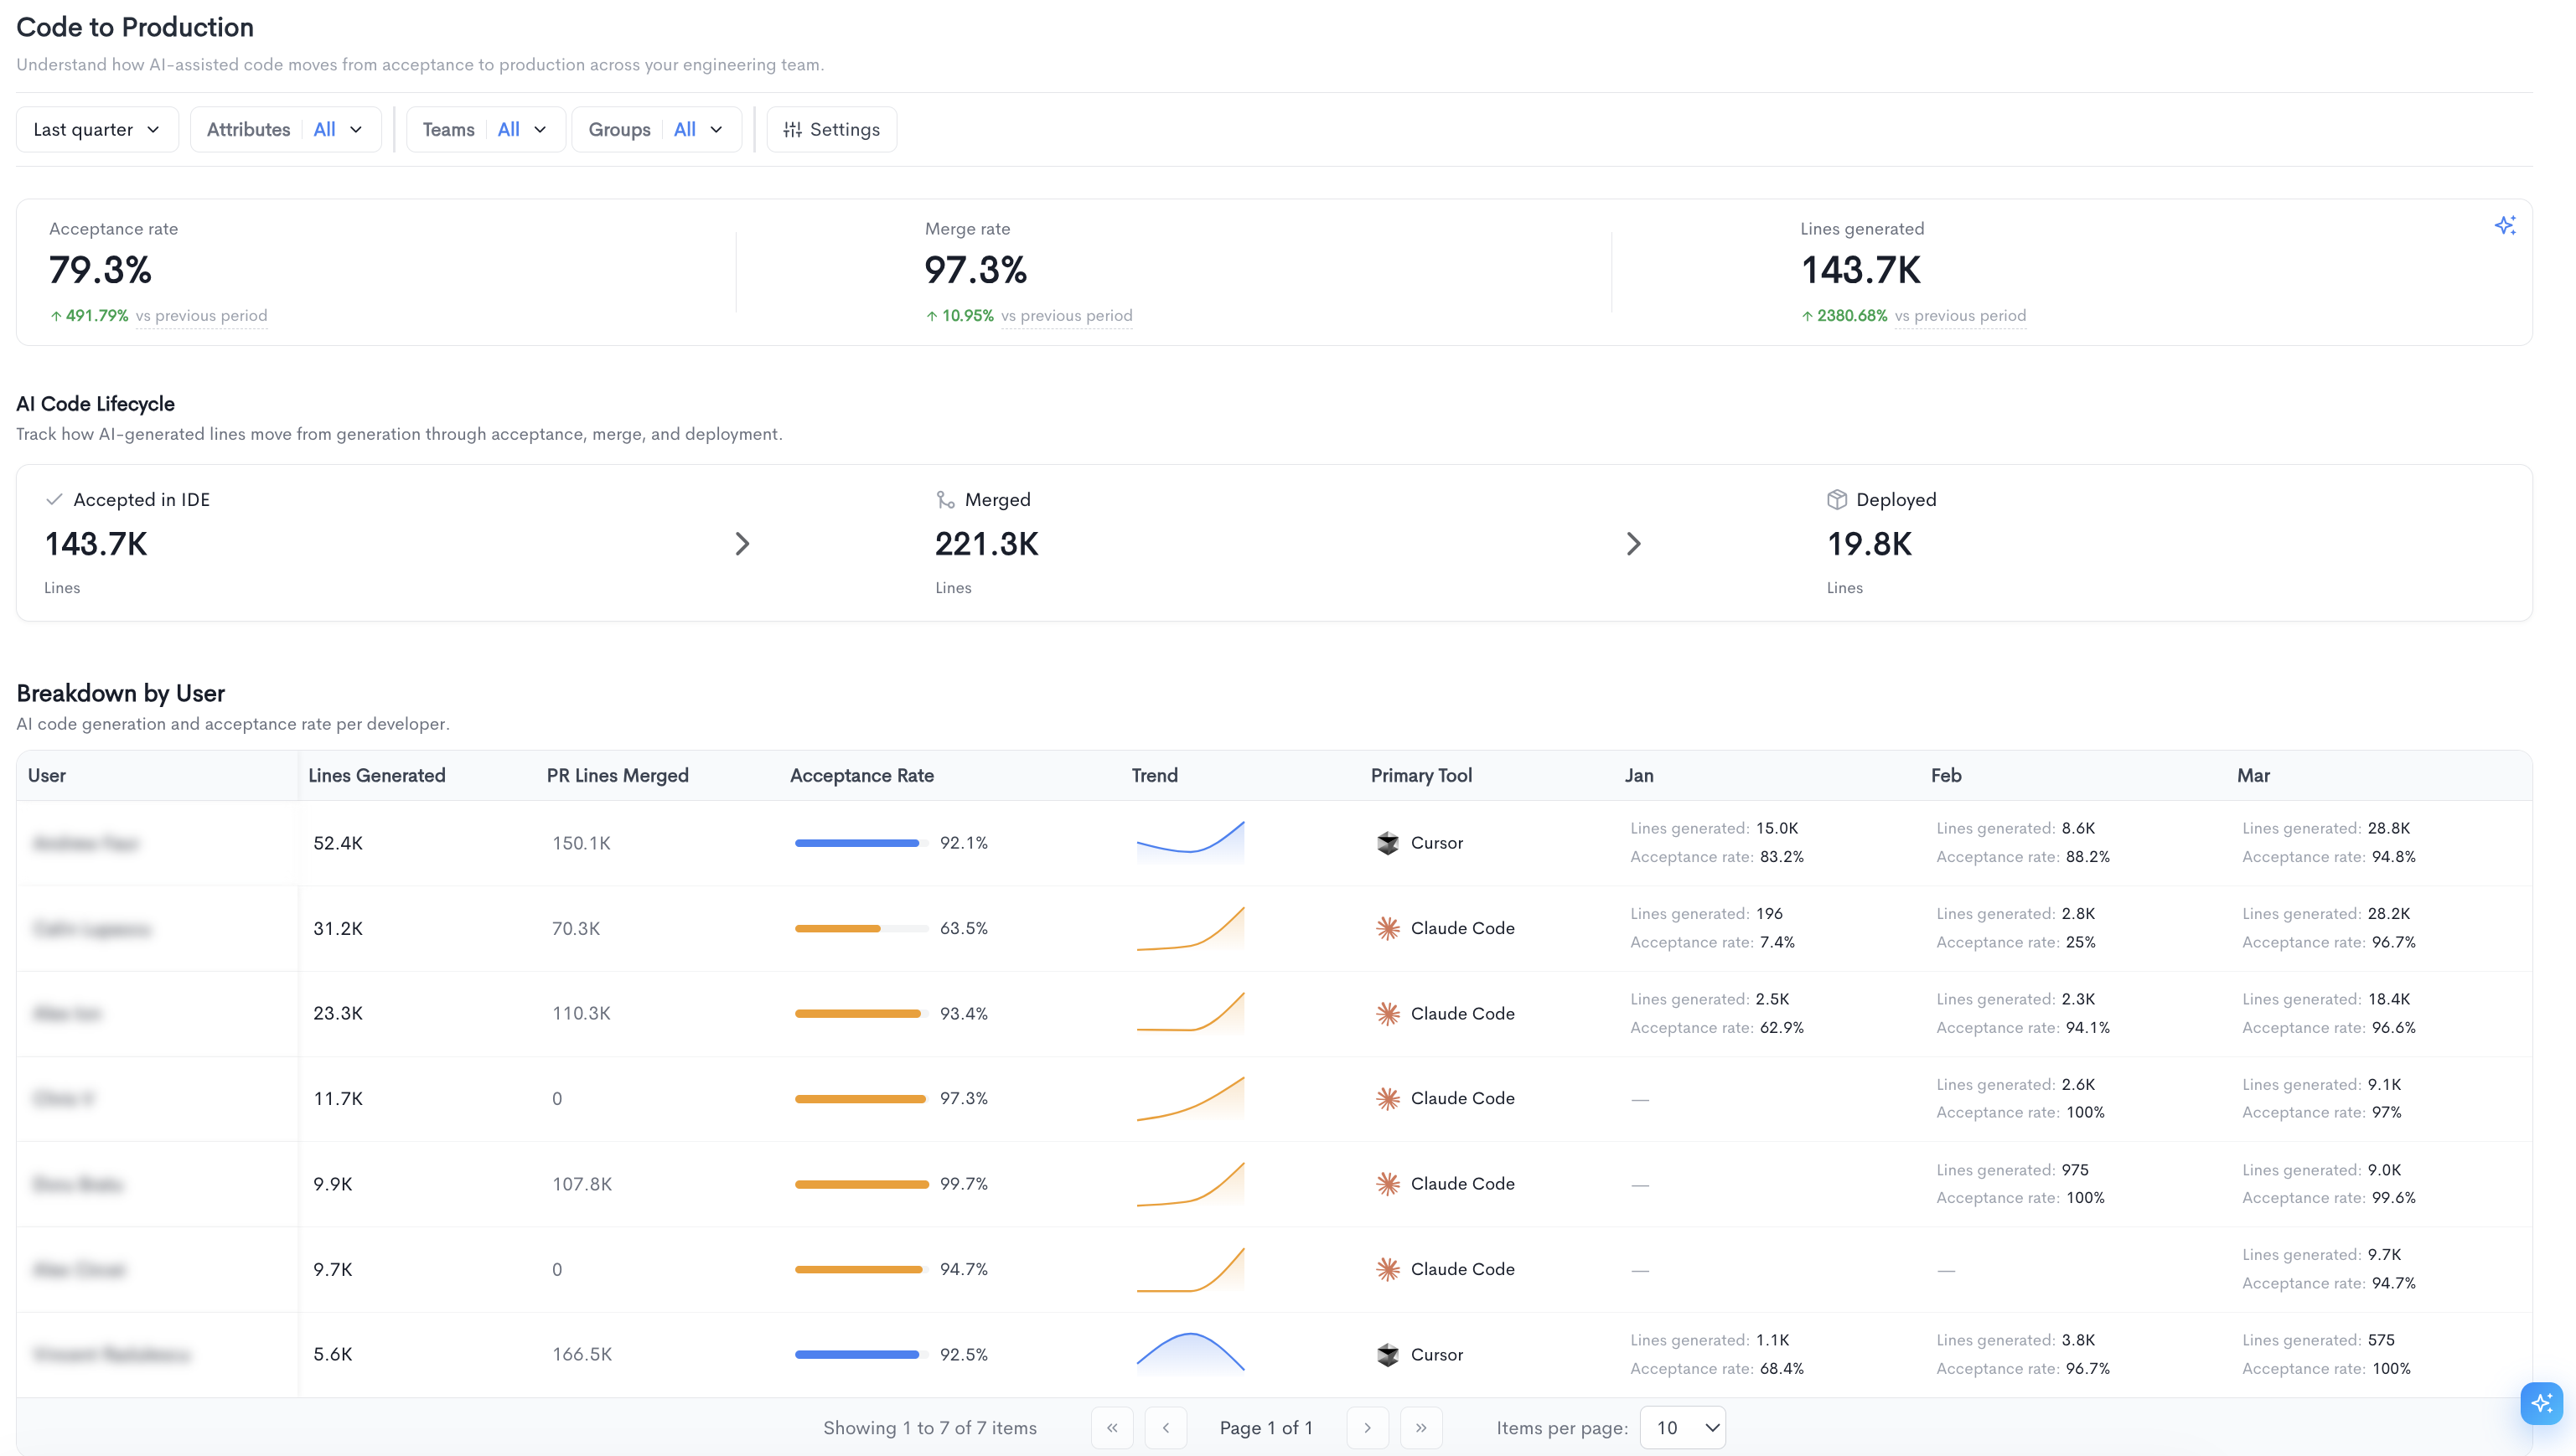
The Code to Production report helps you understand how AI-assisted code moves from acceptance to production across your engineering team. It is accessible under AI Impact in the left sidebar.
The top of the page displays three summary metrics:
- Acceptance rate - The percentage of AI-generated code suggestions accepted by developers.
- Merge rate - The percentage of accepted AI-generated lines that were merged into a branch.
- Lines generated - The total number of AI-generated lines of code in the selected period.
Each metric also shows a percentage change compared to the previous period.
AI Code Lifecycle - Tracks how AI-generated lines move through three stages:
- Accepted in IDE - The number of AI-generated lines accepted by developers in their editor.
- Merged - The number of AI-generated lines merged into a branch via pull requests.
- Deployed - The number of AI-generated lines that reached production.
Breakdown by User - A table showing AI code generation and acceptance rate per developer, with the following columns:
- User - The name of the developer.
- Lines Generated - The total number of AI-generated lines for the user.
- PR Lines Merged - The number of AI-generated lines merged via pull requests.
- Acceptance Rate - The user's acceptance rate shown as a progress bar and percentage.
- Trend - A sparkline showing the user's acceptance rate trend over time.
- Primary Tool - The AI tool most used by the developer.
- Monthly columns showing lines generated and acceptance rate per period.
Filters available at the top of the report include date range, Attributes, Teams, Groups, and Settings. The Settings panel allows configuring the time granularity (e.g. Months).
Updated 4 months ago