

Insights
Insights
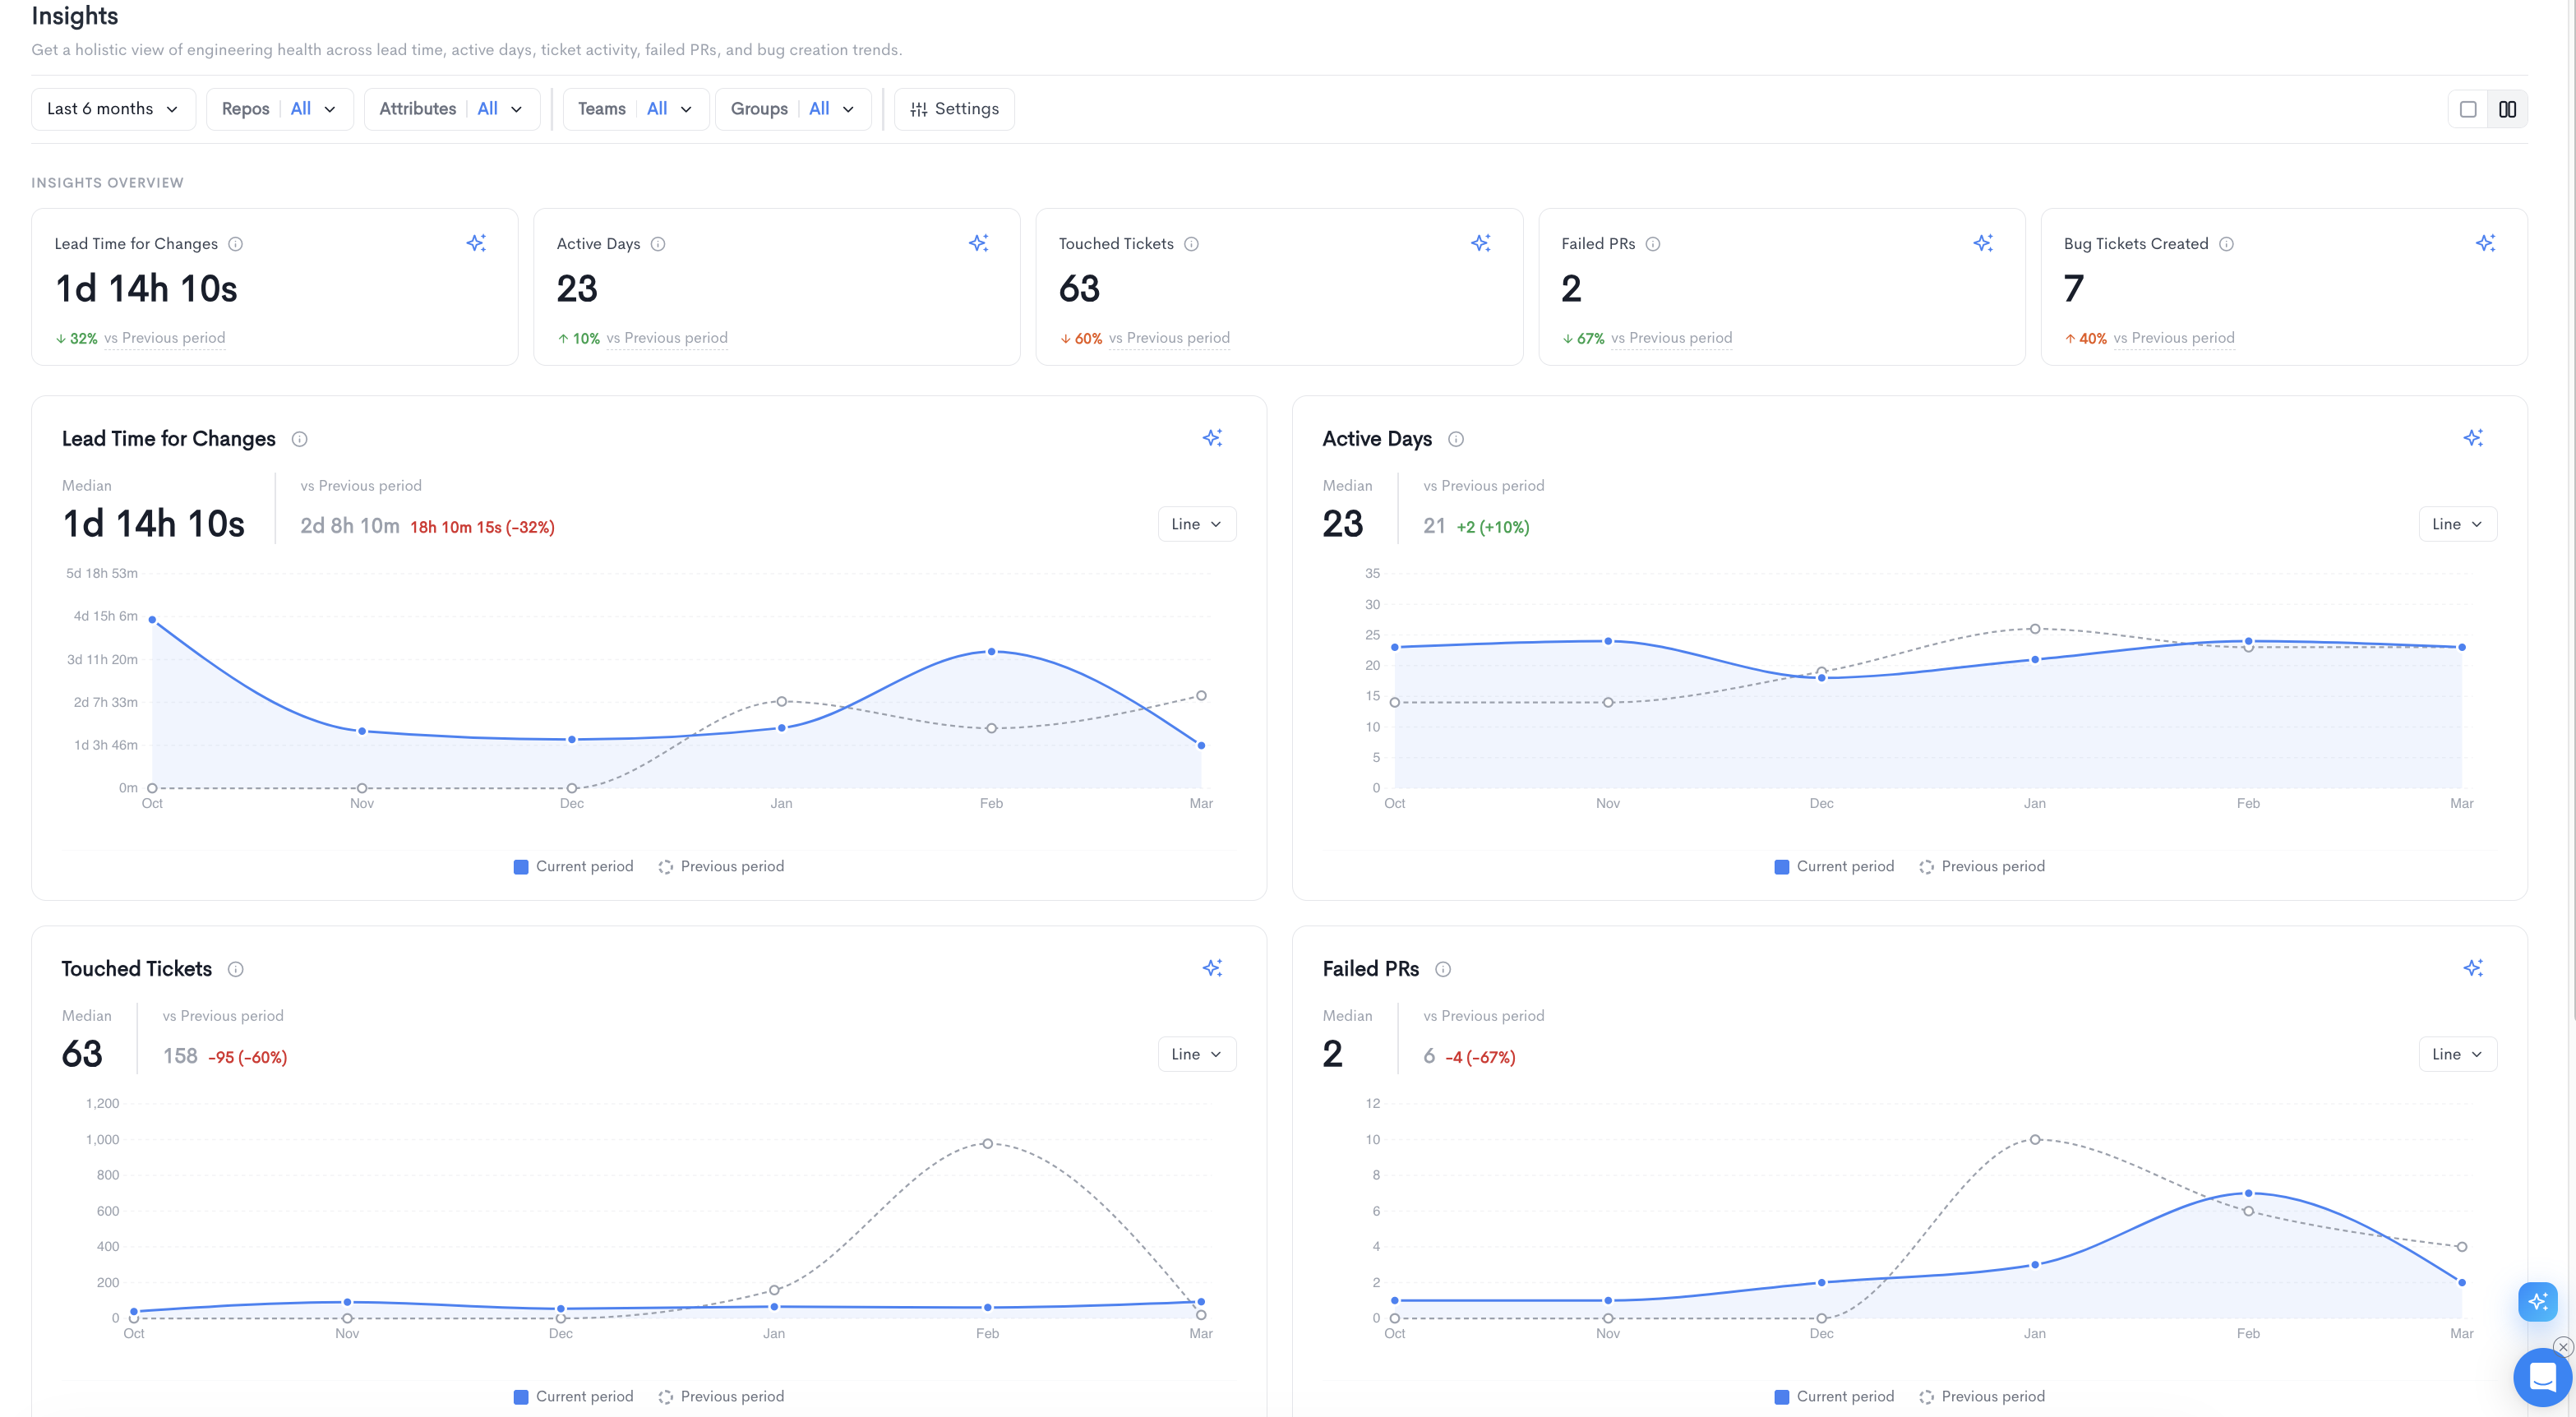
The Insights report provides a holistic view of engineering health across lead time, active days, ticket activity, failed PRs, and bug creation trends. It is accessible under Health in the left sidebar.
The top of the page displays an Insights Overview summary bar with five key metrics:
- Lead Time for Changes - The median time it takes for a code change to go from the first commit to being deployed to production.
- Active Days - The median number of days with recorded engineering activity in the selected period.
- Touched Tickets - The median number of tickets that had any activity in the selected period.
- Failed PRs - The median number of pull requests closed without being merged.
- Bug Tickets Created - The median number of bug tickets created in the selected period.
Each metric also shows a percentage change compared to the previous period.
Below the summary bar, each metric is displayed as an individual time-series chart comparing the current period to the previous period:
- Lead Time for Changes - Tracks how long code changes take to reach production over time.
- Active Days - Tracks the number of days with engineering activity over time.
- Touched Tickets - Tracks the number of tickets with any activity over time.
- Failed PRs - Tracks the number of pull requests that were closed without being merged over time.
- Bug Tickets Created - Tracks the number of new bug tickets created over time.
Each chart can be toggled between Line and Bar views.
Filters available at the top of the report include date range, Repos, Attributes, Teams, Groups, and Settings.
Updated 4 months ago