

Token Usage
Token Usage
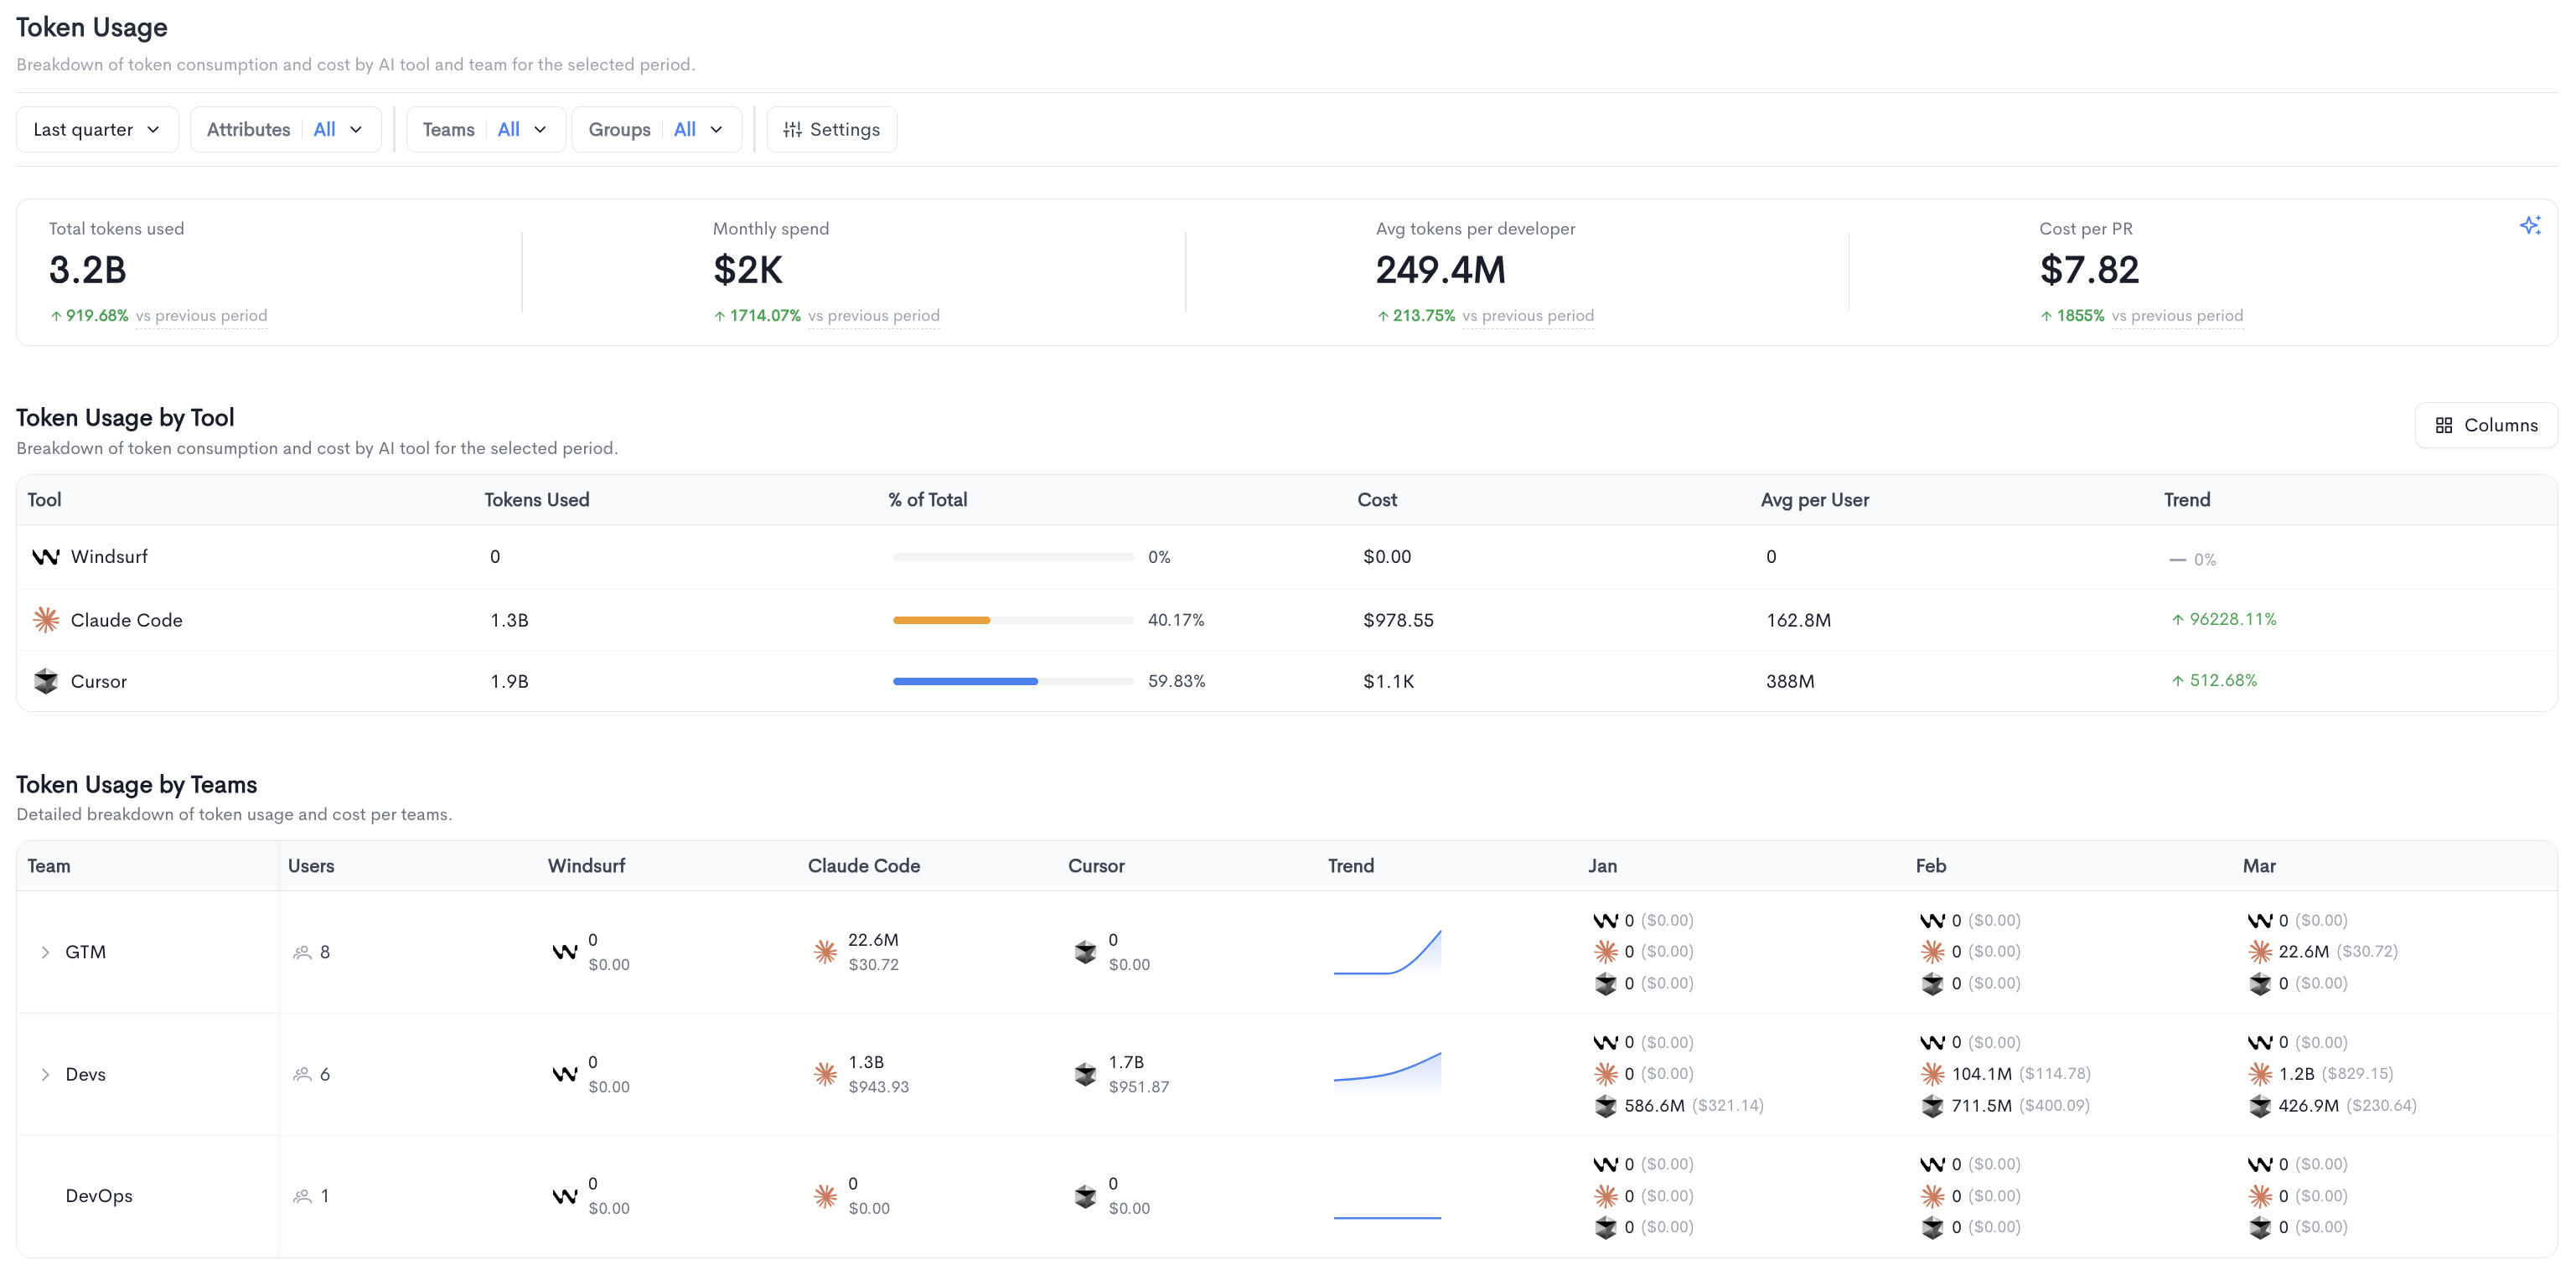
The Token Usage report provides a breakdown of token consumption and cost by AI tool and team for the selected period. It is accessible under AI Impact in the left sidebar.
The top of the page displays four summary metrics:
- Total tokens used - The total number of tokens consumed across all AI tools in the selected period.
- Monthly spend - The estimated total cost of token usage for the period.
- Avg tokens per developer - The average number of tokens consumed per developer.
- Cost per PR - The estimated AI cost per pull request.
Each metric also shows a percentage change compared to the previous period.
Token Usage by Tool - A table breaking down token consumption and cost per connected AI provider, with the following columns:
- Tool - The name of the AI provider.
- Tokens Used - The total number of tokens consumed by the tool.
- % of Total - The tool's share of total token usage, shown as a progress bar and percentage.
- Cost - The estimated cost of token usage for the tool.
- Avg per User - The average number of tokens consumed per user.
- Trend - The percentage change compared to the previous period.
Token Usage by Teams - A detailed table breaking down token usage and cost per team, with monthly columns showing usage per AI tool. Teams can be expanded to reveal sub-teams. Each cell shows the token count and estimated cost for that tool and period.
Filters available at the top of the report include:
- Date range - Select the time period for the report.
- Attributes - Filter by user attributes (e.g. AI assistant usage, QA, Seniority).
- Teams - Filter results by one or more teams.
- Groups - Filter results by one or more groups.
- Settings - Configure additional report options, including granularity (e.g. Months) and breakdown dimension (Teams or any available Attribute).
Updated 3 months ago