

Stuck Tickets
Stuck Tickets drilldown
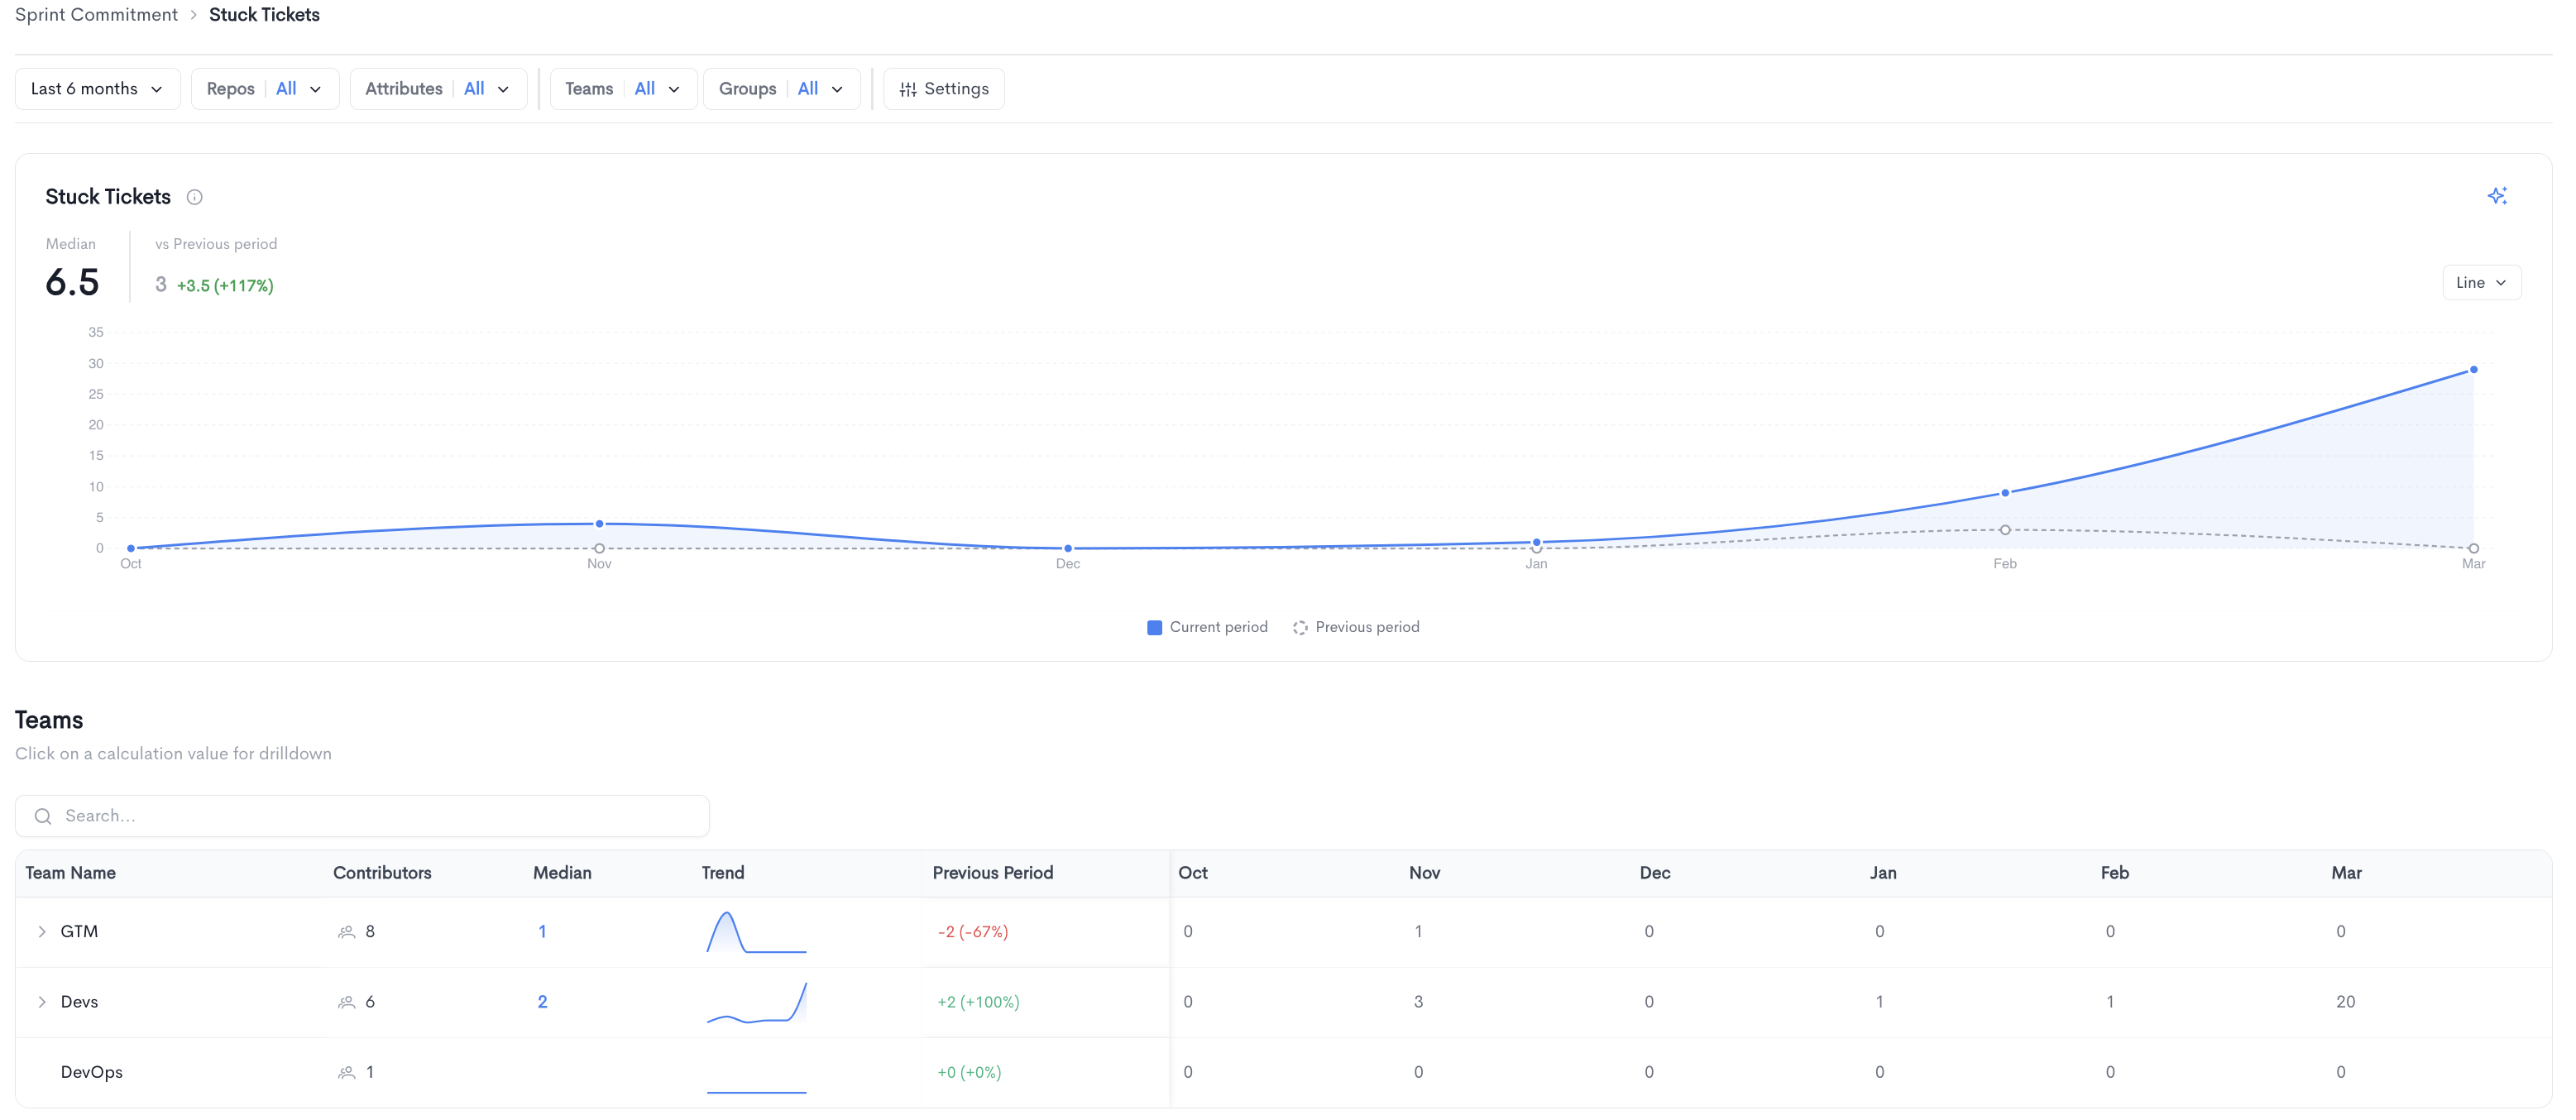
The Stuck Tickets page shows a detailed breakdown of tickets that have not progressed within the expected timeframe in the selected period.
The top of the page displays the median number of stuck tickets alongside a comparison to the previous period, along with a trend chart comparing the current period to the previous period.
Teams - A searchable table breaking down stuck tickets per team, with the following columns:
- Team Name - The name of the team.
- Contributors - The number of contributors in the team.
- Median - The median number of stuck tickets for the team. Clicking on a value opens a drilldown view for that team.
- Trend - A sparkline showing the stuck ticket count trend over time.
- Previous Period - The change in stuck tickets compared to the previous period.
- Monthly columns showing the stuck ticket count per period.
Teams can be expanded to reveal sub-teams.
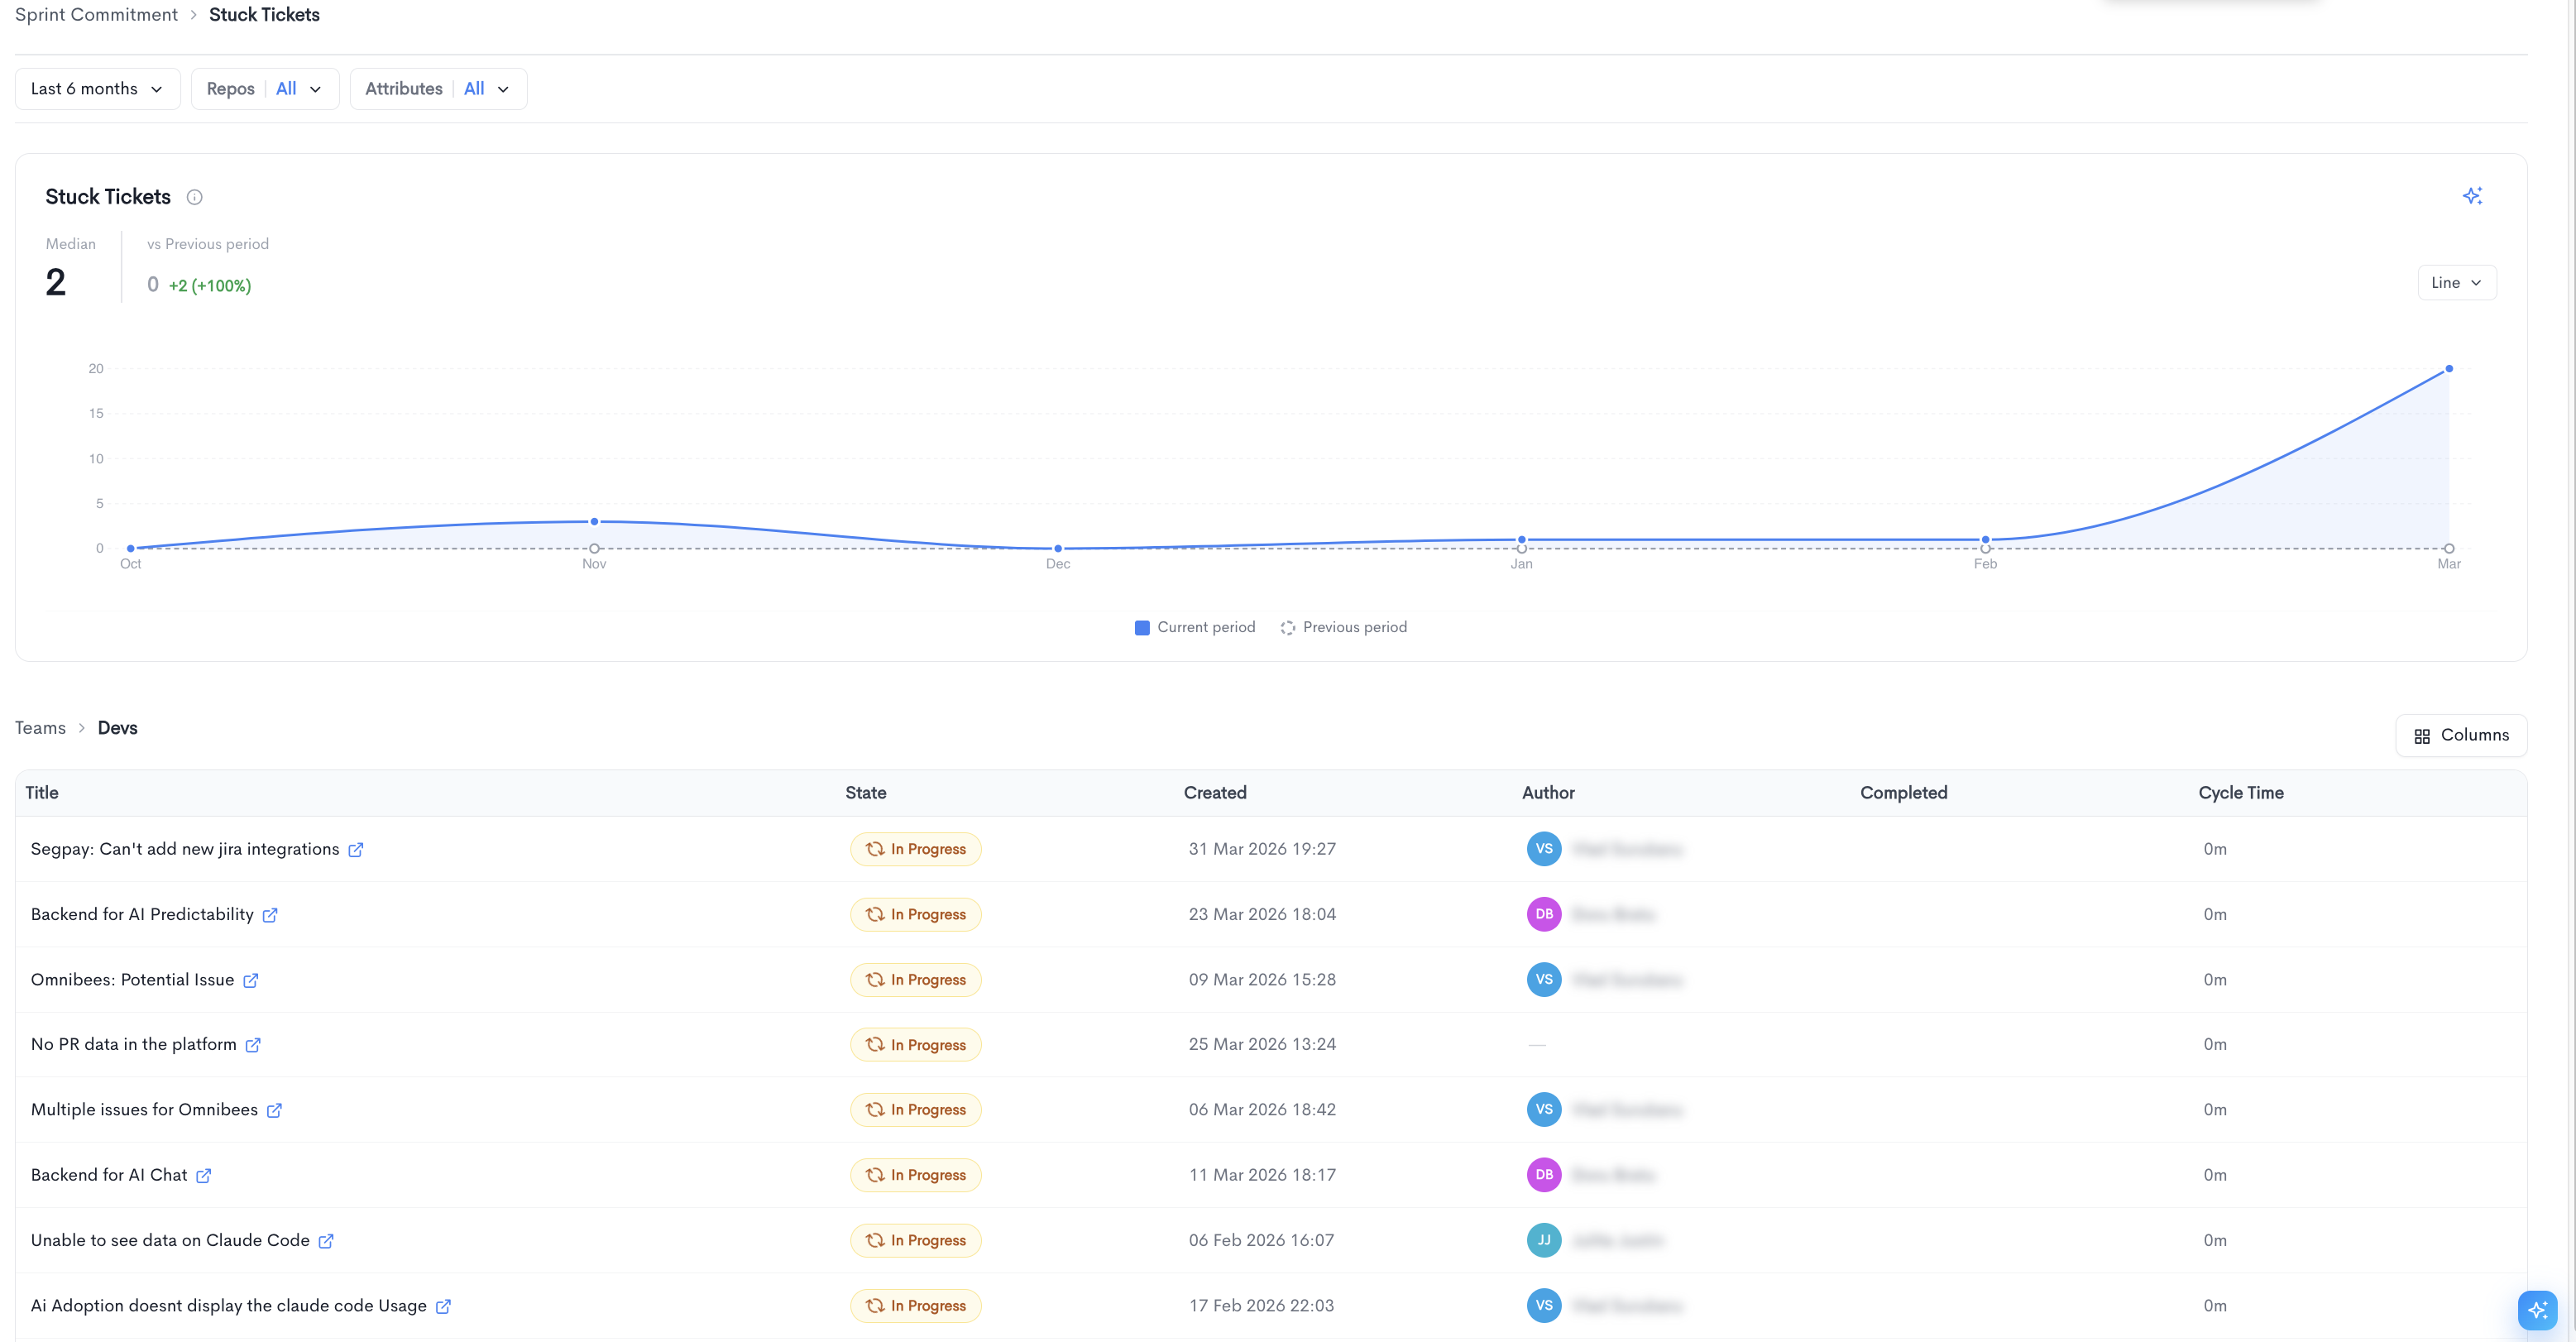
Stuck Tickets team drilldown
Clicking on a team's median value opens a drilldown view for that specific team. The drilldown displays the trend chart for the selected team and a paginated table listing all stuck tickets, with the following columns:
- Title - The ticket title, linked to the source provider.
- State - The current state of the ticket (e.g. In Progress).
- Created - The date and time the ticket was created.
- Author - The developer assigned to the ticket.
- Completed - The date and time the ticket was completed, if applicable.
- Cycle Time - The time elapsed from when work started, if available.
You can adjust the visible columns using the Columns button.
Updated 4 months ago