

Hygiene
Hygiene
The Hygiene report gives you a clear overview of traceable and untraceable pull requests across your active repositories, to evaluate your team's adherence to best practices. It is accessible under Diagnose in the left sidebar.
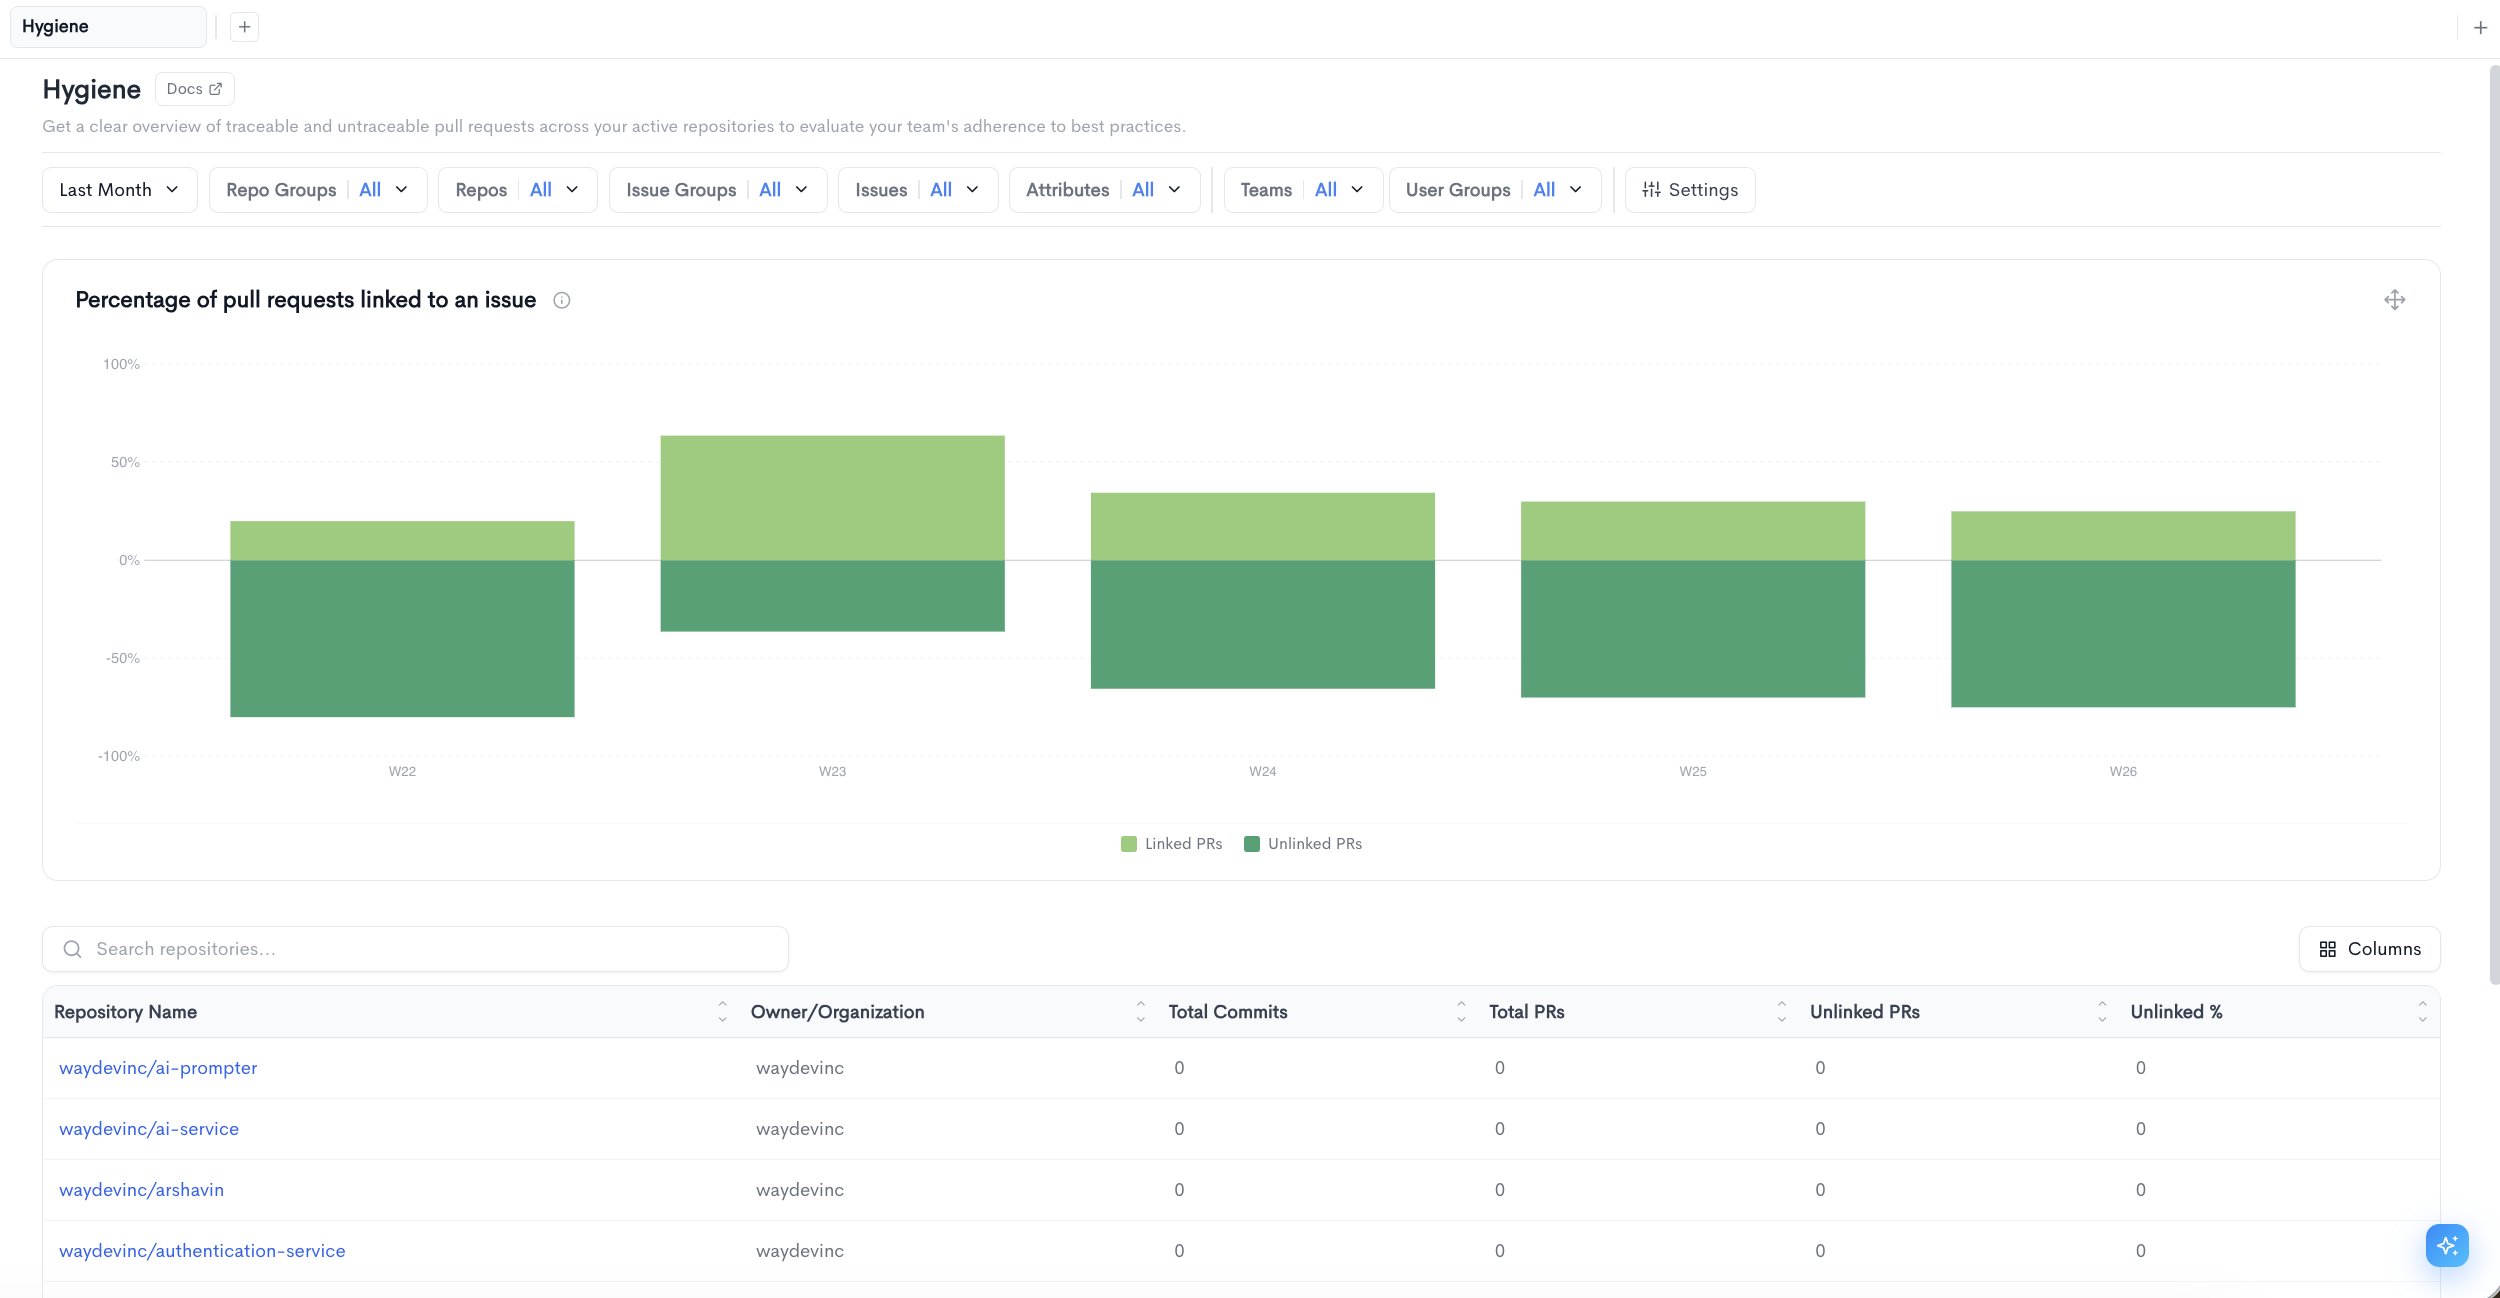
The top of the page displays a Percentage of pull requests linked to an issue chart, showing the weekly split between Linked PRs and Unlinked PRs as a stacked bar chart.
Below the chart, a searchable, paginated table lists all repositories with the following columns:
- Repository Name - The name of the repository, linked to the source provider.
- Owner/Organization - The organization or account that owns the repository.
- Total Commits - The total number of commits in the repository for the selected period.
- Total PRs - The total number of pull requests in the repository for the selected period.
- Unlinked PRs - The number of pull requests not linked to any ticket or issue.
- Unlinked % - The percentage of pull requests not linked to any ticket or issue.
You can search for repositories using the search bar, or adjust the visible columns using the Columns button.
Filters available at the top of the report include date range, Repo Groups, Repos, Issue Groups, Issues, Attributes, Teams, User Groups, and Settings.
Linked PRs drilldown
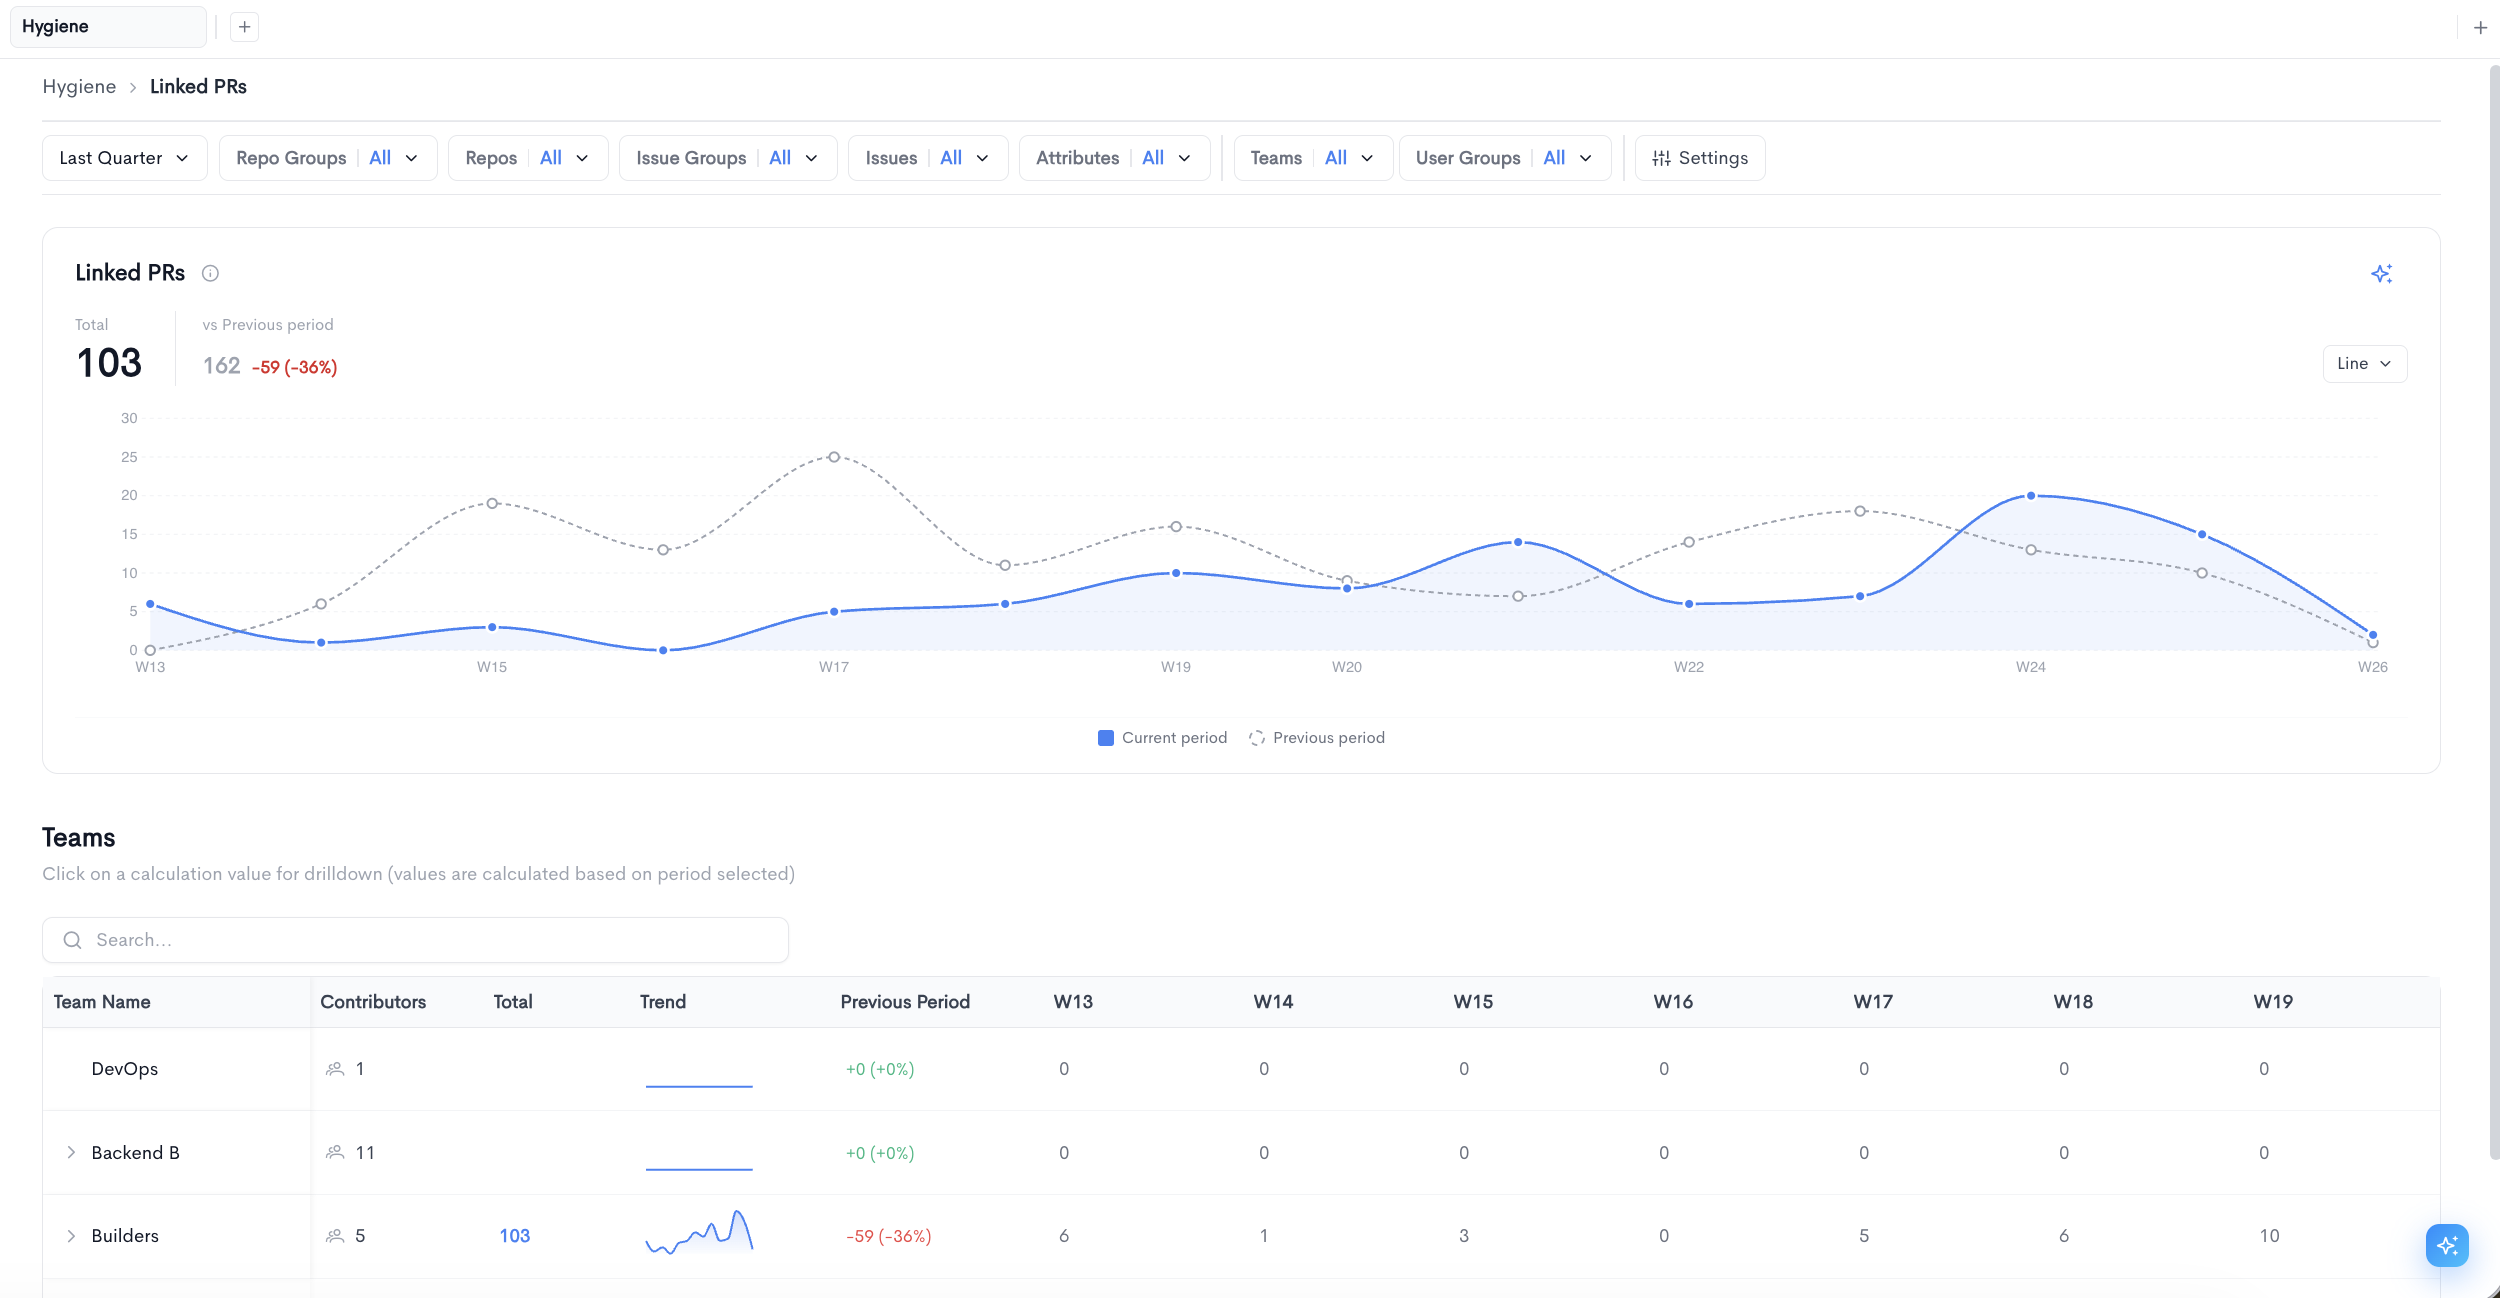
Clicking on the Percentage of pull requests linked to an issue chart, or its Linked PRs component, opens a drilldown view.
The top of the drilldown shows the total number of Linked PRs for the selected period, alongside a comparison to the previous period. The chart displays the Linked PRs trend over time, comparing the current period to the previous period, and can be toggled between Line and Bar views.
Below the chart, a Teams section breaks down Linked PRs per team, with the following columns:
- Team Name - The name of the team. Teams can be expanded to reveal sub-teams.
- Contributors - The number of contributors in the team.
- Total - The total number of Linked PRs for the team in the selected period. Clicking on a value opens a further drilldown.
- Trend - A sparkline showing the Linked PRs trend over time.
- Previous Period - The change in Linked PRs compared to the previous period.
- Daily columns showing the number of Linked PRs per day.
You can search for teams using the search bar.
Unlinked PRs drilldown
Clicking on the Unlinked PRs component of the chart opens a drilldown view, following the same structure as the Linked PRs drilldown: a total for the selected period with a comparison to the previous period, a trend chart toggleable between Line and Bar views, and a Teams table with the same columns (Team Name, Contributors, Total, Trend, Previous Period, and daily breakdown) scoped to Unlinked PRs.
Updated 21 days ago