
Review Collaboration
Understand how your engineering teams work collaboratively. Effectively communicate the healthy tension between speed and thoroughness in code review.
The Review Collaboration provides code collaboration stats between submitters and reviewers. Users can select the team’s review collaboration stats to view, repositories to analyze, and a timeframe for analysis.

Submitter and Reviewer Metrics
This feature offers several metrics to help users measure the effectiveness of the code review process. These metrics include:
-
Responsiveness and Reaction Time: This metric measures how quickly team members respond to and communicate with each other during reviews. A healthy code review workflow should aim to improve the velocity of code review communication.
-
Involvement: This metric represents the percentage of Pull Requests (PRs) a reviewer participated in. It provides a measure of engineering engagement in the code review process.
-
Comments Addressed: This metric measures the percentage of reviewer comments that were responded to with a comment or a code revision.
-
Receptiveness: This metric is the ratio of follow-on commits to comments, indicating openness to constructive feedback.
-
Influence: This metric measures the ratio of follow-on commits made after the reviewer commented, providing insight into the likelihood that reviewers’ comments will lead to a follow-on commit.
-
Unreviewed PRs: This metric measures the number of Pull Requests that are open and merged without ever getting a comment, which should be as close to zero as possible to ensure thoroughness of feedback.
-
Review Coverage: This metric indicates the number of pull requests that have been merged after review and should be as close to 100% as possible.
Sharing Index
Sharing Index Calculation: A Deeper Dive into Collaboration Measurement
The Sharing Index is a metric designed to assess how well your team collaborates on code reviews. It quantifies the distribution of reviews across your team members and considers factors that promote fair and active participation. A higher Sharing Index indicates a more collaborative environment.
How It Works:
I. Gathering Data:
- We start by collecting information on all pull requests (PRs) merged within a specific time period.
- For each PR, we record who submitted it (submitter) and who reviewed it (reviewers).
II. Calculating the Base Sharing Index:
- We count how many reviews each submitter received.
- Using these review counts, we calculate the Gini coefficient, a statistical measure of inequality. In this context, it tells us how evenly the reviews are distributed among submitters.
- We subtract the Gini coefficient from 1 to get the initial sharing index, a value between 0 (unequal distribution) and 1 (perfectly equal distribution).
III. Adjusting for Fairness:
- Reviewer Participation: We want to encourage everyone who can review code to participate actively. We calculate the ratio of active reviewers (those who have done at least one review) to the total available reviewers. This ratio is then adjusted to a value between 0 (no participation) and 1 (full participation). This adjustment encourages a higher sharing index when more team members are actively reviewing.
- Submitter Distribution: We aim for a balance where each submitter's code is reviewed by various team members. We analyze two aspects:
- Variety of Reviewers: We calculate the Gini coefficient based on the number of different reviewers each submitter had. A lower Gini coefficient means a more diverse set of reviewers for each submitter.
- Number of Reviews: We calculate the Gini coefficient based on the total number of reviews each submitter received. This ensures no submitter is overwhelmed with a disproportionate amount of reviews.
- We average these two Gini coefficients and normalize them to a value between 0 (uneven distribution) and 1 (even distribution) (the resulting value is then subtracted from 1 and normalized by the total number of pull requests, the result is then capped between 0 and 1). This adjustment promotes a higher sharing index when reviewers are spread out more evenly across submitters.
Why Normalize by Total Pull Requests?
This normalization step helps put the inequality in perspective. If a team has many PRs, a slight imbalance in reviewer distribution is less concerning than if they had only a few PRs. By dividing by the total number of PRs, we account for the scale of the review process.
IV. Final Sharing Index:
We multiply the initial sharing index by both adjustment factors. This gives us the final Sharing Index, a value between 0 and 1.
What the Sharing Index Means:
- Closer to 1: Your team has a highly collaborative code review process. Reviews are well-distributed, with active participation from all available reviewers, and a good balance of different reviewers for each submitter.
- Closer to 0: Your team's code review process might need some improvement. Perhaps a few people are doing most of the reviews, or some submitters consistently get feedback from the same small group of reviewers.
The Goal:
The Sharing Index is a tool to help you understand and improve your team's code review practices. By striving for a higher Sharing Index, you can foster a culture of collaboration, knowledge sharing, and high-quality code.
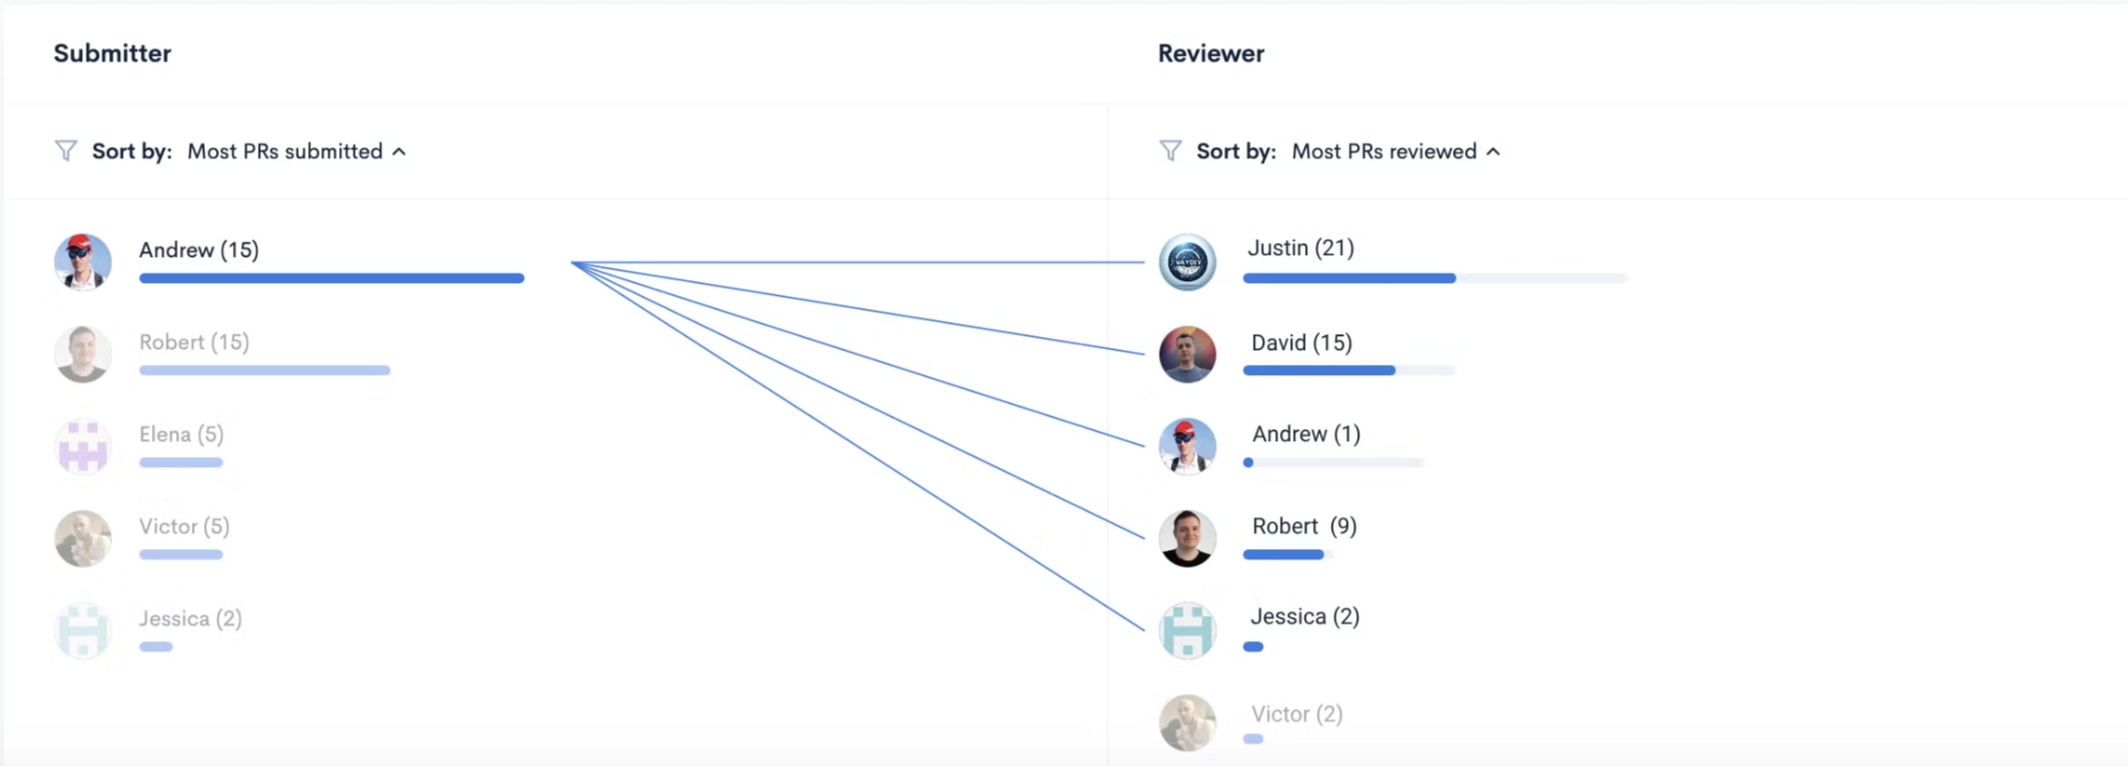
Collaboration Map
The Collaboration Map shows a map of code collaboration, indicating which engineers reviewed whose pull requests.
If you hover over an engineer's name in the left column, you will see who reviewed their PRs.
If you hover over an engineer’s name in the right column, you will see whose pull requests he/ she reviewed.
Updated 10 months ago