

Pull Request Insights
Identify the bottlenecks in your Pull Request cycles over the course of the sprint. Find outliers, and visualize high-level team dynamics and the underlying activities that can contribute to those dynamics.
Overview
Offers a holistic view of all the PRs in the specified time-frame. It enables contributors leaders to identify long-running Pull Requests, unreviewed Pull Requests that have been merged, and closed Pull Requests that have not been merged.
The Lead Time for Changes indicates an organization's development velocity. The Lead Time for Changes is the sum of four metrics: CODING, PICKUP, REVIEW and DEPLOY.
Metric Breakdown
CODING - Time to Issue PR from First Commit. This metric corresponds to the coding time and is the time elapsed from the first commit to creating a PR.
PICKUP - Time to First Review. This metric indicates how fast reviewers pick up their peers' PRs for review and is the time between when a PR is opened and the first time an engineer reviews that PR.
REVIEW - Time to Merge from First Review. This metric signifies how fast do submitters incorporate feedback from their peers in code review and is the time from a PR's first review to that PR being merged.
DEPLOY - Time to Deploy from Merge. This metric is an indicator of how fast code gets deployed into production and is the time between when a PR is merged to when it gets released into production.
What does each color indicate?
We've aggregated benchmark values from our platform for each stage of the lead time for changes. Green bars indicate leading values, yellow bars indicate average values, and red bars indicate below-average values.
- For CODING:
Green: Less than 48 hours
Yellow: Between 48 and 72 hours
Red: More than 72 hours
- For PICKUP:
Green: Less than 24 hours
Yellow: Between 24 and 72 hours
Red: More than 72 hours
- For REVIEW:
Green: Less than 24 hours
Yellow: Between 24 and 72 hours
Red: More than 72 hours
- For DEPLOY:
Green: Less than 10 hours
Yellow: Between 10 and 24 hours
Red: More than 24 hours
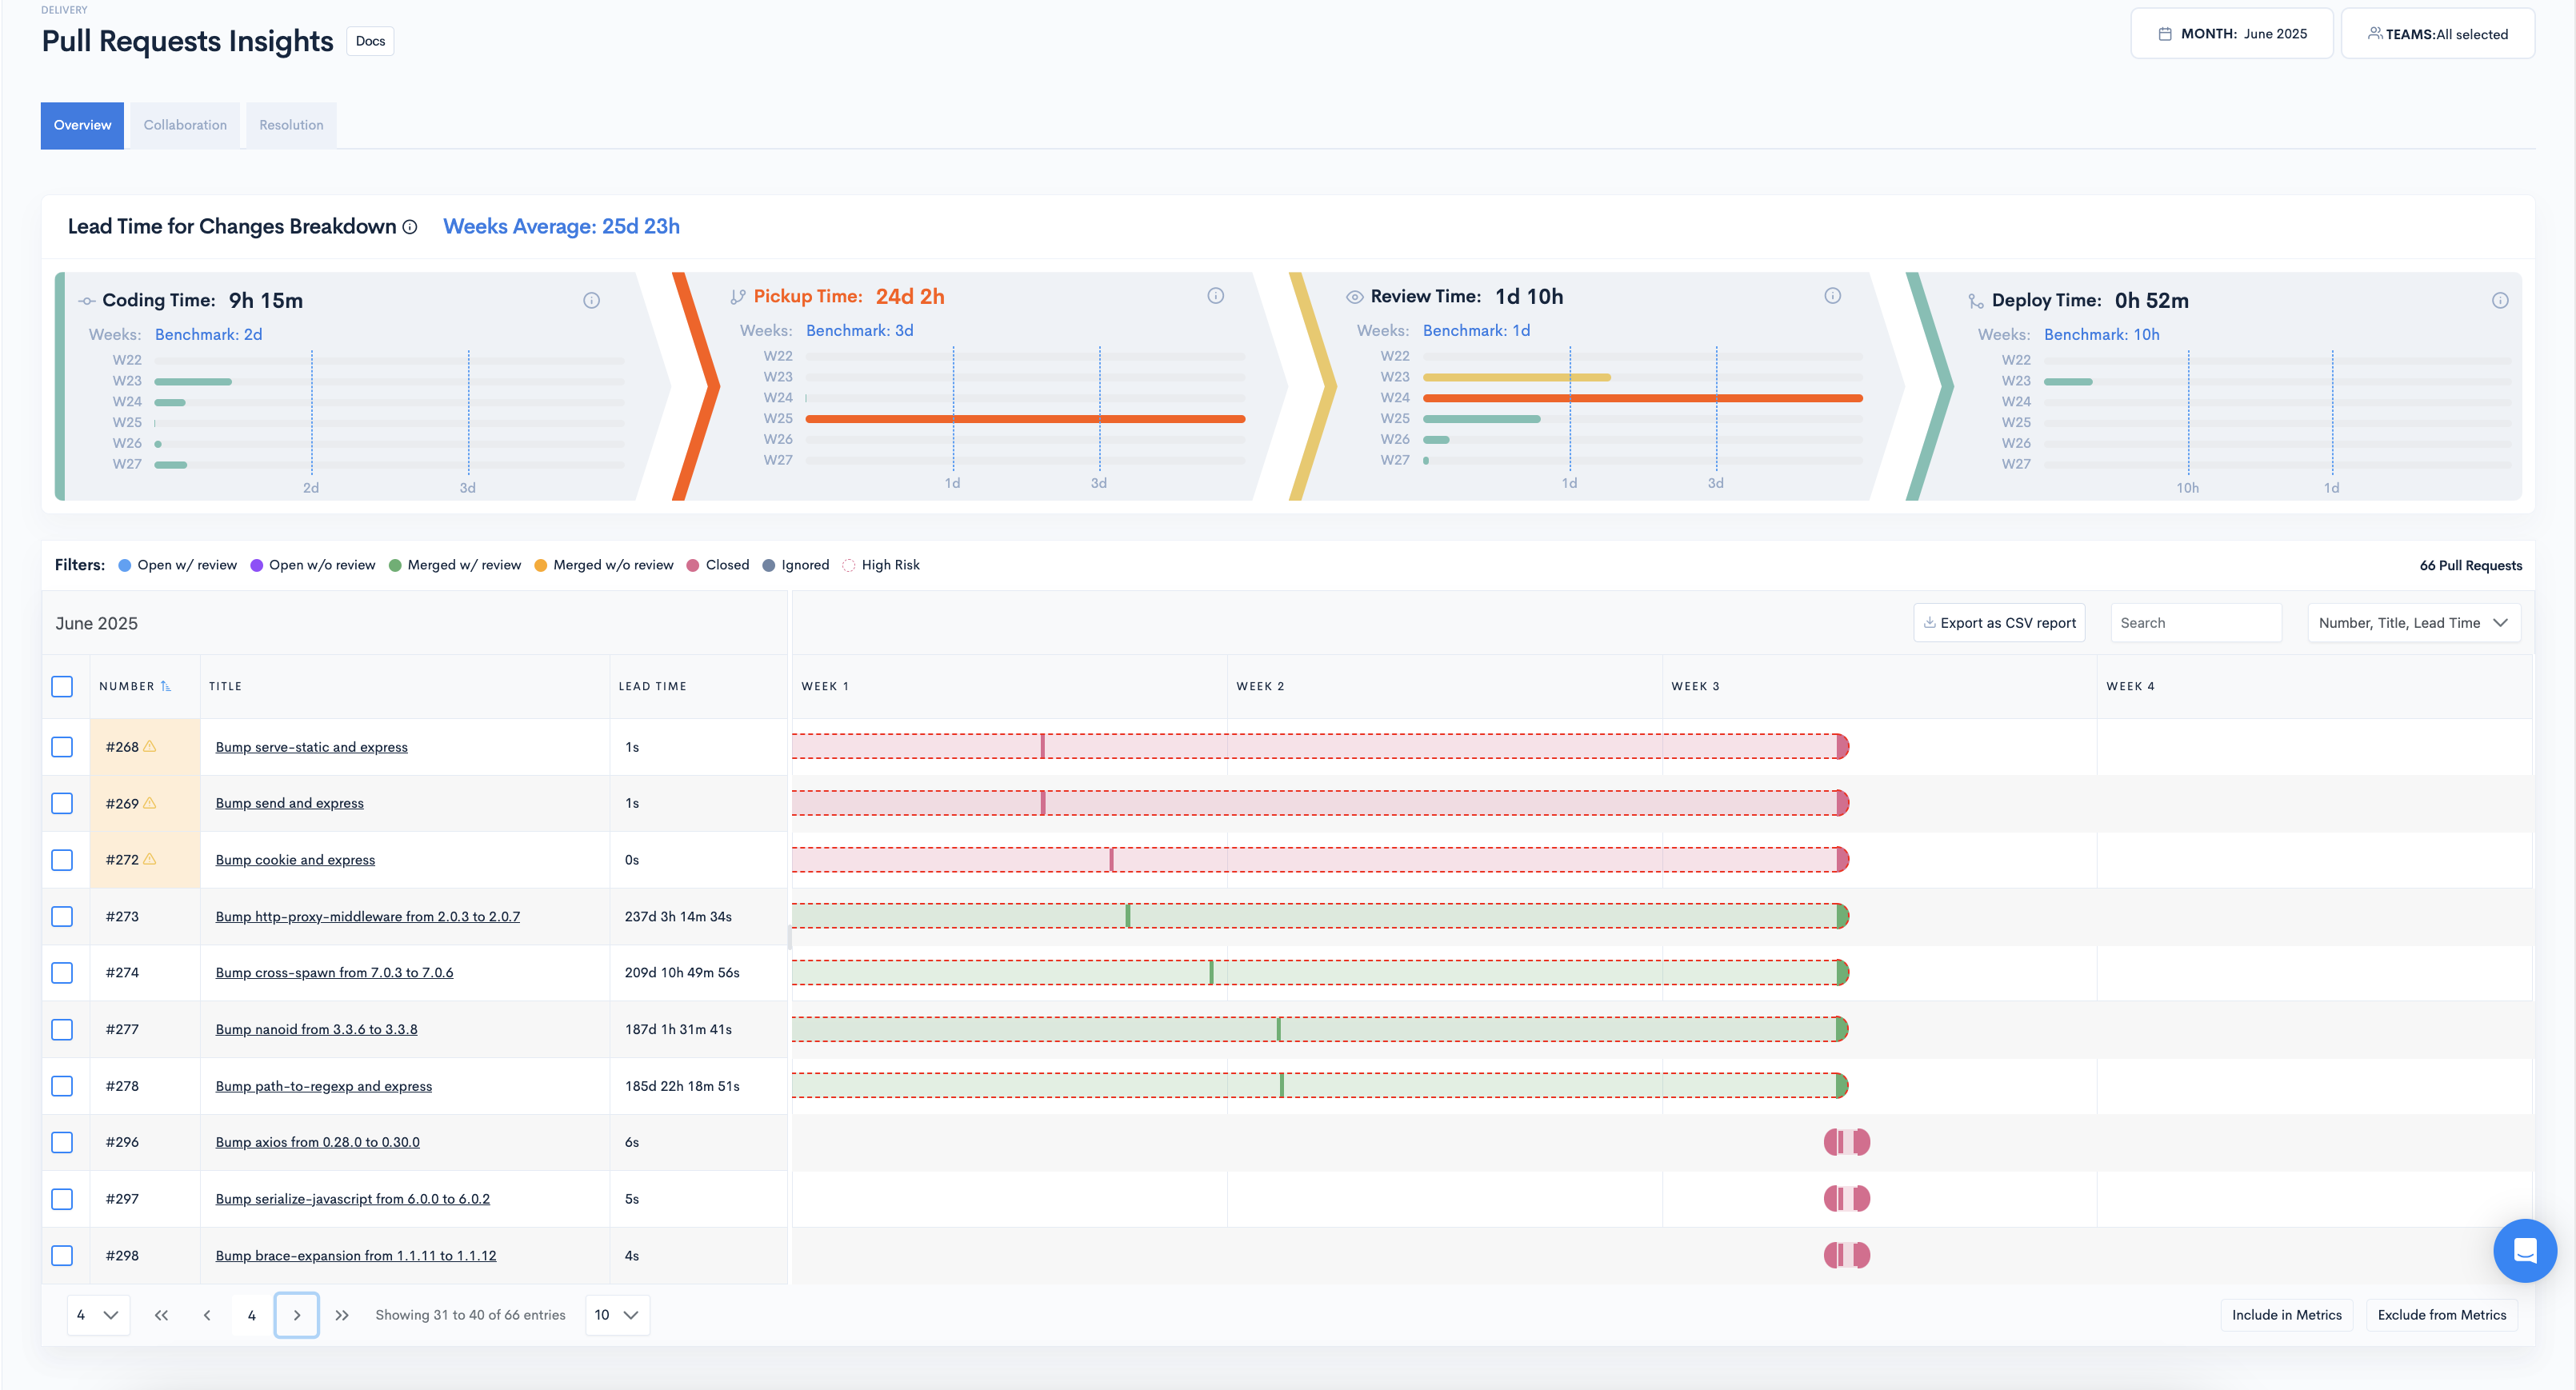
The warning symbol near the PR number will appear for PRs that have not been reviewed yet, PRs closed without a review, PRs merged without a review or PRs that have been ignored by the user/ignored for a specific time-frame.
The bars on the Review Workflow graph represent the time it took for a PR to close. They are color coded as follows:
- Open w/ review
- Open w/o review
- Merged w/ review
- Merged w/o review
- Closed
- Ignored
- Red dotted circle for High Risk
The bubbles inside the bars indicate follow-on commits, while the half bars indicate comments.
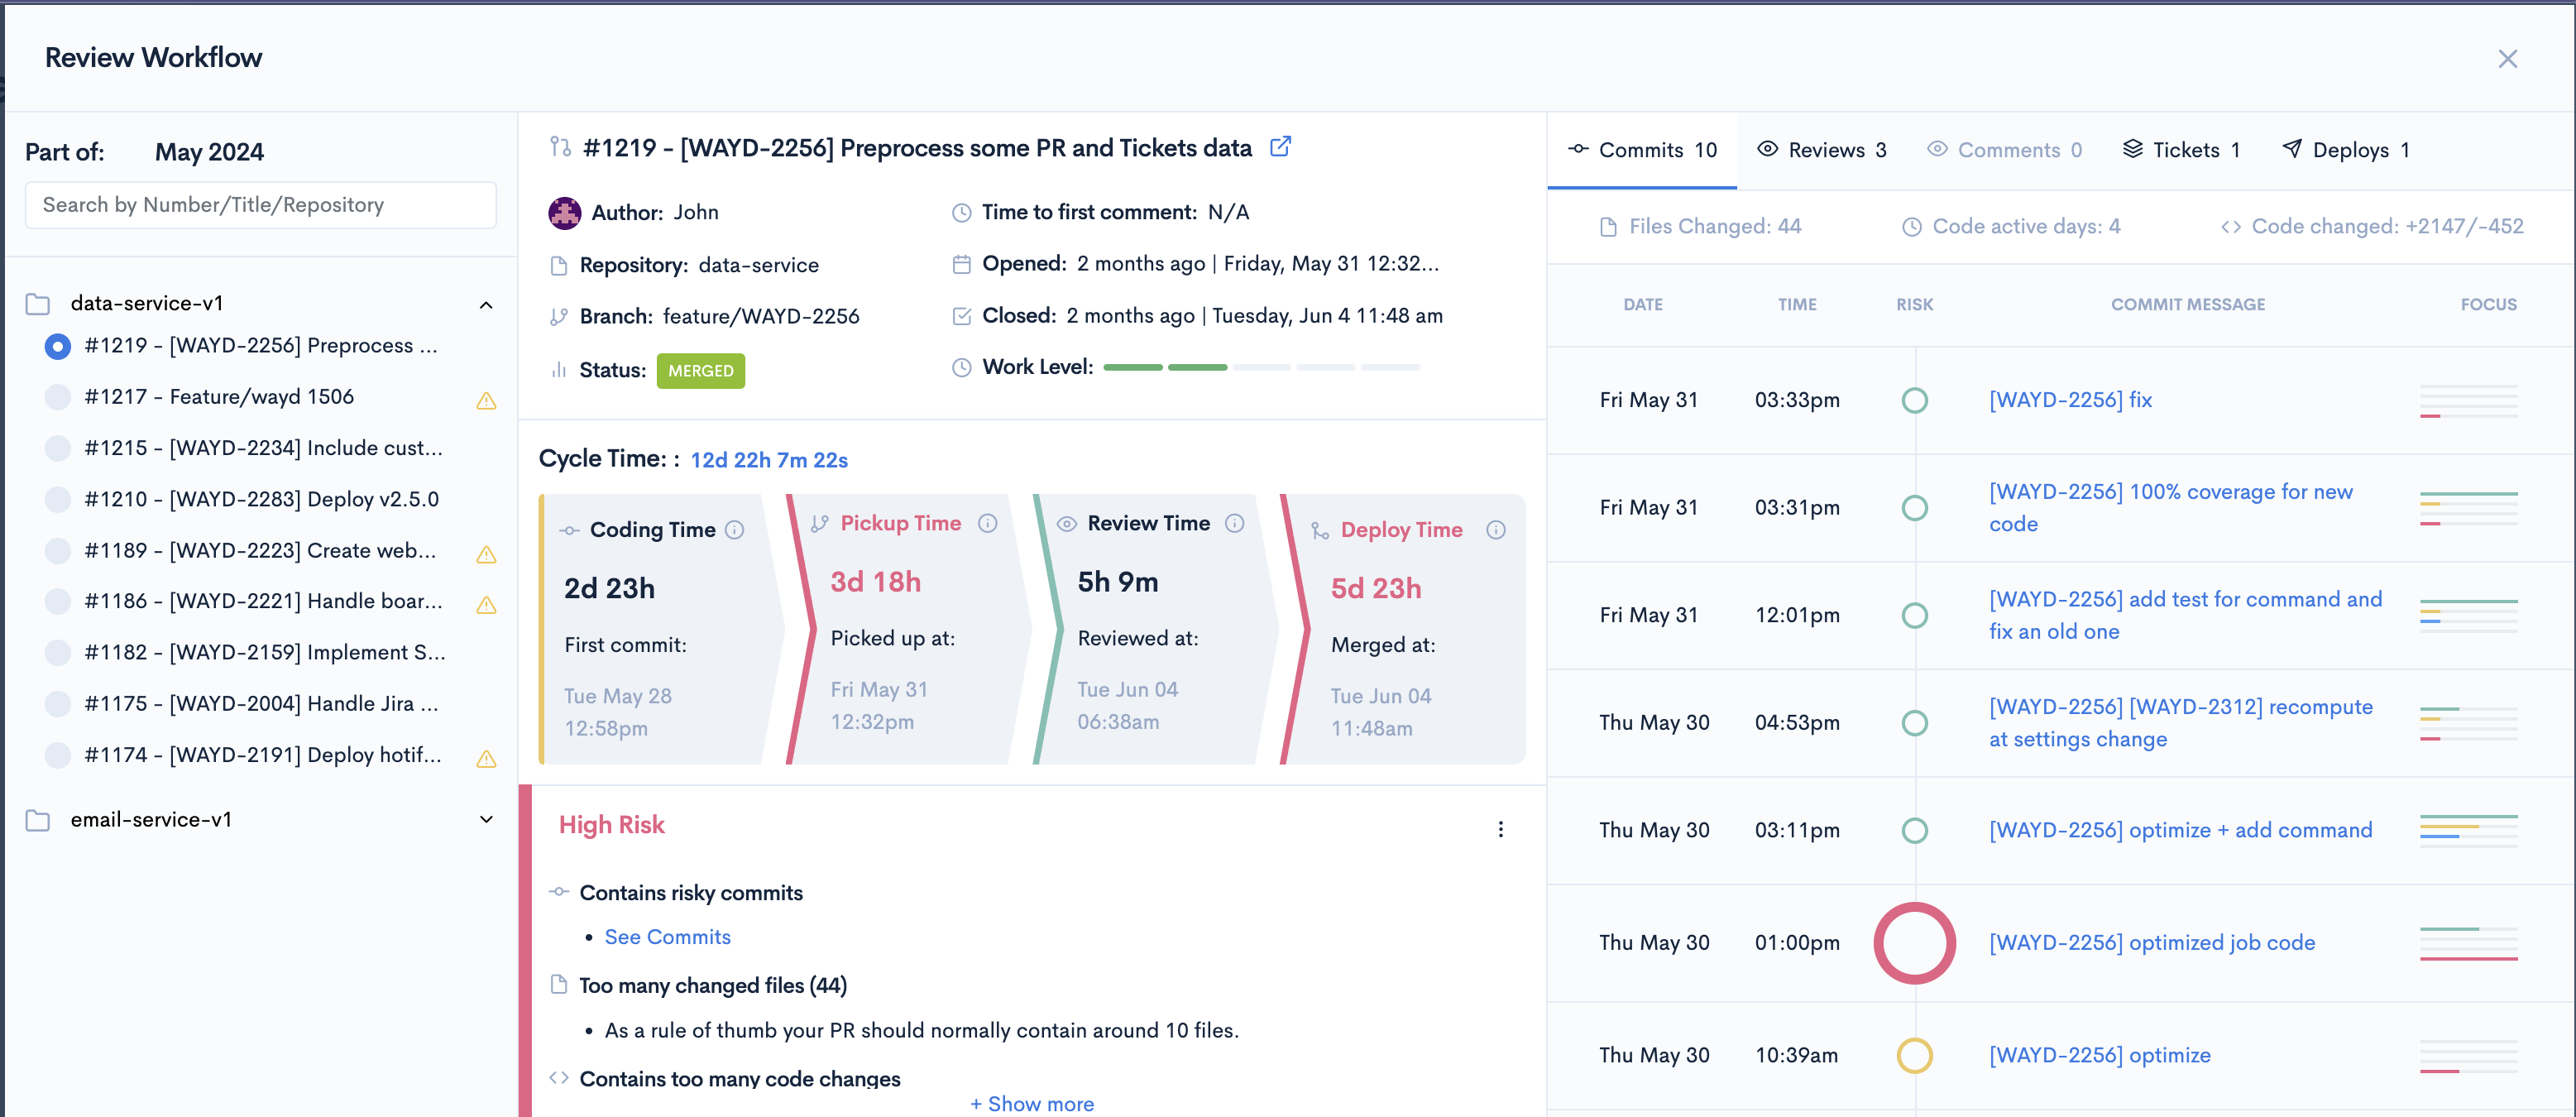
The PR Modal
Clicking on a bar provides details about that particular PR in a comprehensive modal.
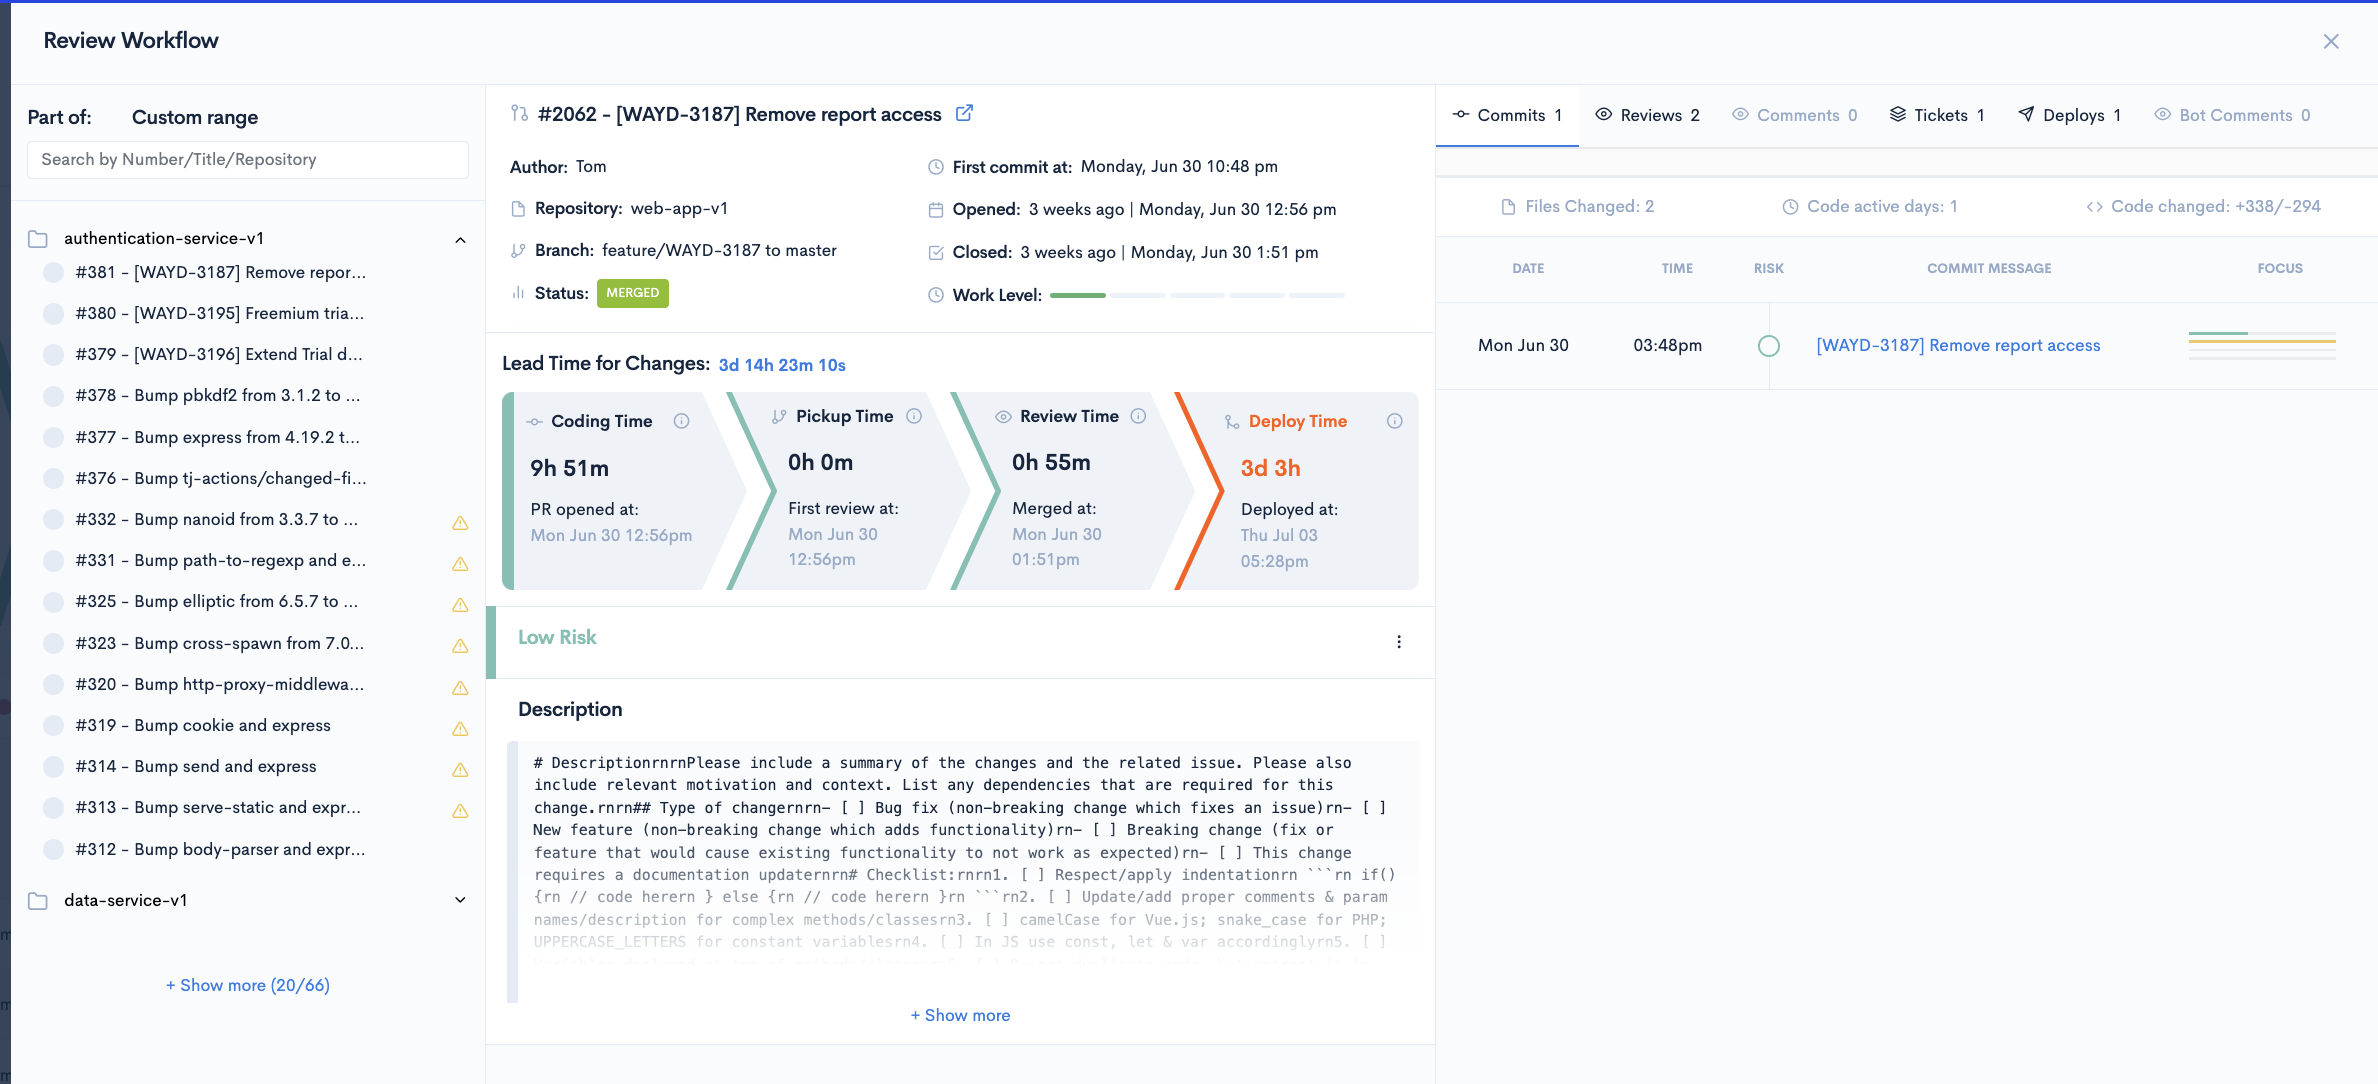
The modal contains:
- On the left, all PRs from that category, grouped by repository.
- Branch for the PR.
- Status of the PR.
- Time to first comment.
- Open/Closed dates.
- Work level - bars get filled based on difficulty.
- The Cycle Time of the PR.
- Risk: High/Medium/Low
- Description of the PR - follow the best practices
- Commits: the commits linked to the PR with an overview and a link to the commit.
- Reviews: Reviewers are listed here
- Comments: All the comments for the PR
- Tickets: The tickets linked to the PR.
- Deploys
- Bot comments
Collaboration
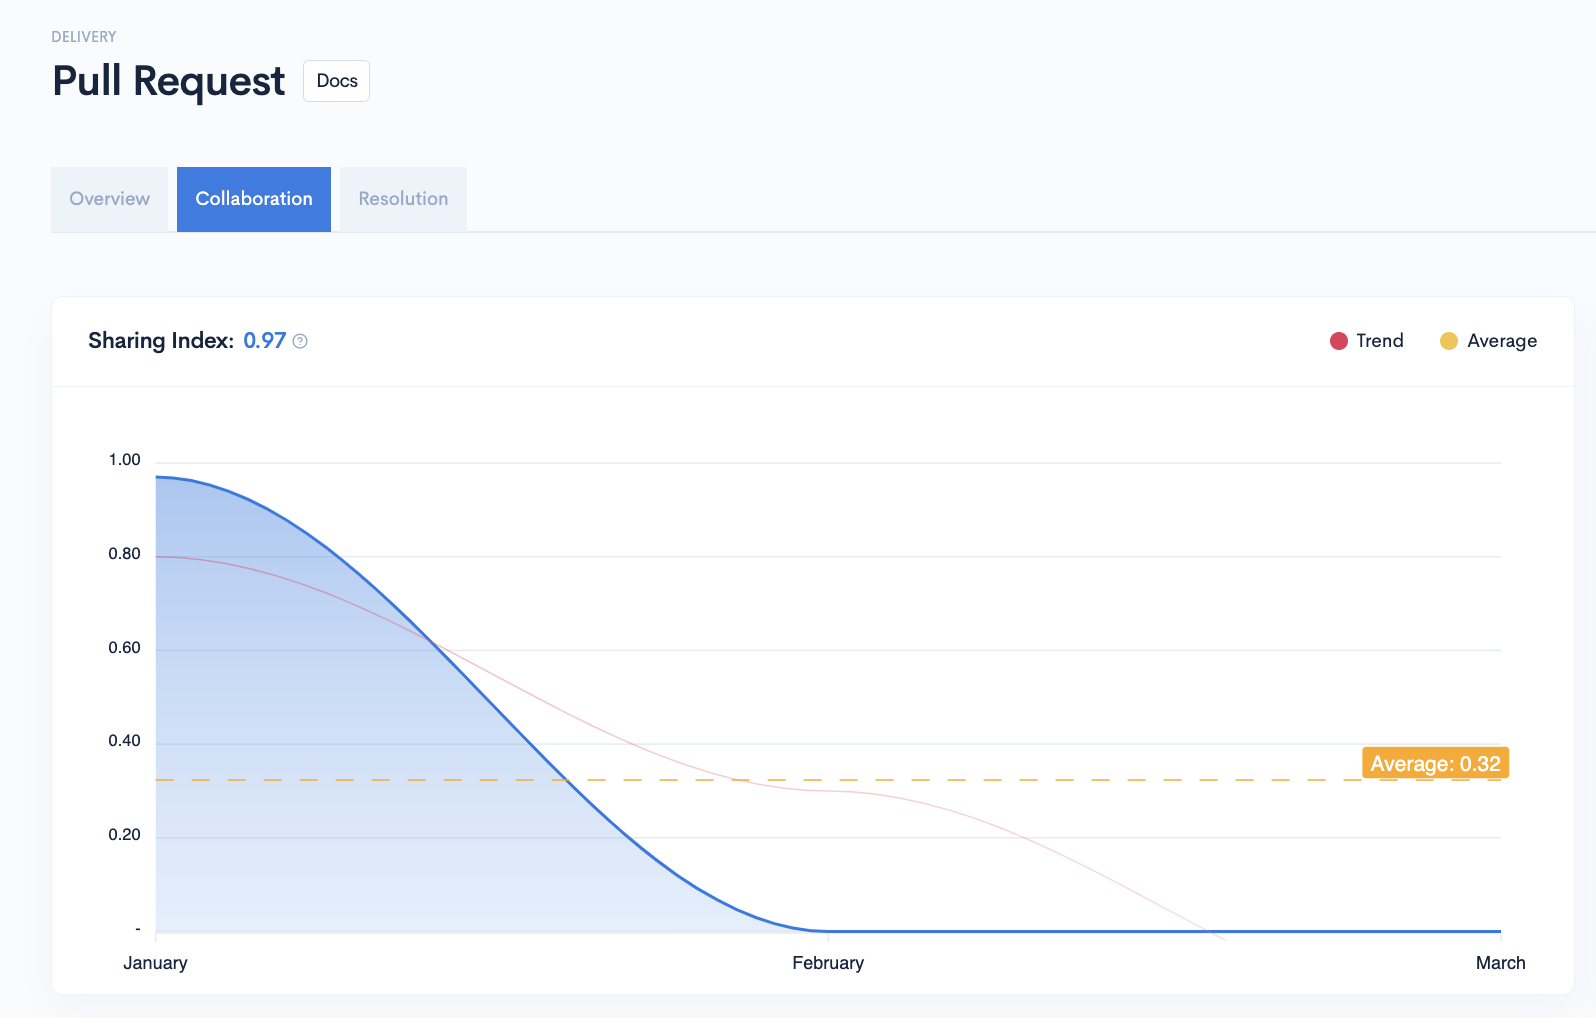
Sharing Index
Sharing Index Calculation: A Deeper Dive into Collaboration Measurement
The Sharing Index is a metric designed to assess how well your team collaborates on code reviews. It quantifies the distribution of reviews across your team members and considers factors that promote fair and active participation. A higher Sharing Index indicates a more collaborative environment.
How It Works:
I. Gathering Data:
- We start by collecting information on all pull requests (PRs) merged within a specific time period.
- For each PR, we record who submitted it (submitter) and who reviewed it (reviewers).
II. Calculating the Base Sharing Index:
- We count how many reviews each submitter received.
- Using these review counts, we calculate the Gini coefficient, a statistical measure of inequality. In this context, it tells us how evenly the reviews are distributed among submitters.
- We subtract the Gini coefficient from 1 to get the initial sharing index, a value between 0 (unequal distribution) and 1 (perfectly equal distribution).
III. Adjusting for Fairness:
- Reviewer Participation: We want to encourage everyone who can review code to participate actively. We calculate the ratio of active reviewers (those who have done at least one review) to the total available reviewers. This ratio is then adjusted to a value between 0 (no participation) and 1 (full participation). This adjustment encourages a higher sharing index when more team members are actively reviewing.
- Submitter Distribution: We aim for a balance where each submitter's code is reviewed by various team members. We analyze two aspects:
- Variety of Reviewers: We calculate the Gini coefficient based on the number of different reviewers each submitter had. A lower Gini coefficient means a more diverse set of reviewers for each submitter.
- Number of Reviews: We calculate the Gini coefficient based on the total number of reviews each submitter received. This ensures no submitter is overwhelmed with a disproportionate amount of reviews.
- We average these two Gini coefficients and normalize them to a value between 0 (even distribution) and 1 (uneven distribution) (the resulting value is then subtracted from 1 and normalized by the total number of pull requests, the result is then capped between 0 and 1). This adjustment promotes a higher sharing index when reviewers are spread out more evenly across submitters.
Why Normalize by Total Pull Requests?This normalization step helps put the inequality in perspective. If a team has many PRs, a slight imbalance in reviewer distribution is less concerning than if they had only a few PRs. By dividing by the total number of PRs, we account for the scale of the review process.
IV. Final Sharing Index:
We multiply the initial sharing index by both adjustment factors. This gives us the final Sharing Index, a value between 0 and 1.
What the Sharing Index Means:
- Closer to 1: Your team has a highly collaborative code review process. Reviews are well-distributed, with active participation from all available reviewers, and a good balance of different reviewers for each submitter.
- Closer to 0: Your team's code review process might need some improvement. Perhaps a few people are doing most of the reviews, or some submitters consistently get feedback from the same small group of reviewers.
The Goal:
The Sharing Index is a tool to help you understand and improve your team's code review practices. By striving for a higher Sharing Index, you can foster a culture of collaboration, knowledge sharing, and high-quality code.
Reviews
Here you can see the overall trend of reviews for the PRs for the selected time period.

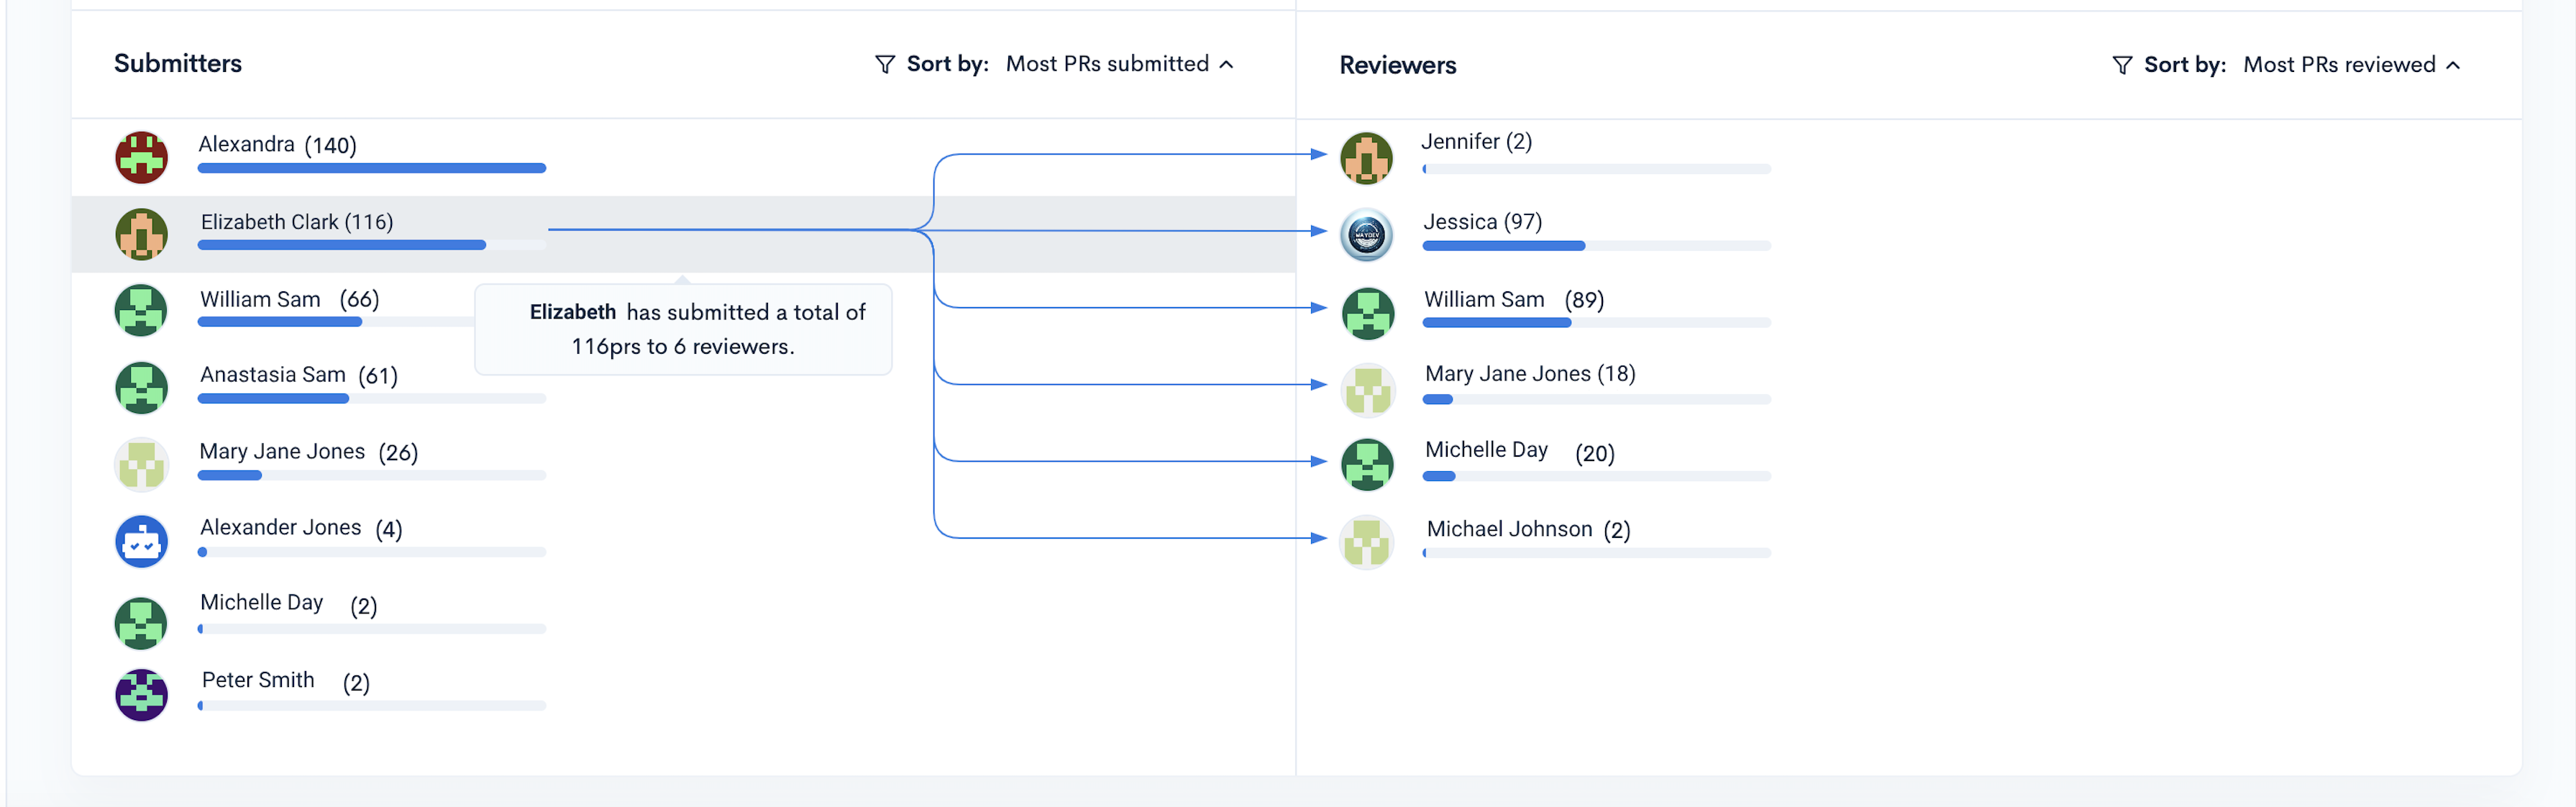
Collaboration Map
The Collaboration Map shows a map of code collaboration, indicating which contributors reviewed whose pull requests.
- If you hover over an contributor's name in the left column, you will see who reviewed their PRs.
- If you hover over an contributor's name in the right column, you will see whose pull requests they reviewed.
Resolution
The Pull Request Resolution feature can help engineering leaders identify bottlenecks in the Pull Request cycle and optimize the review process.
Closed PRs
Every circle in the Closed PRs graph represents a Pull Request, and its position indicates how much time it took to be resolved.
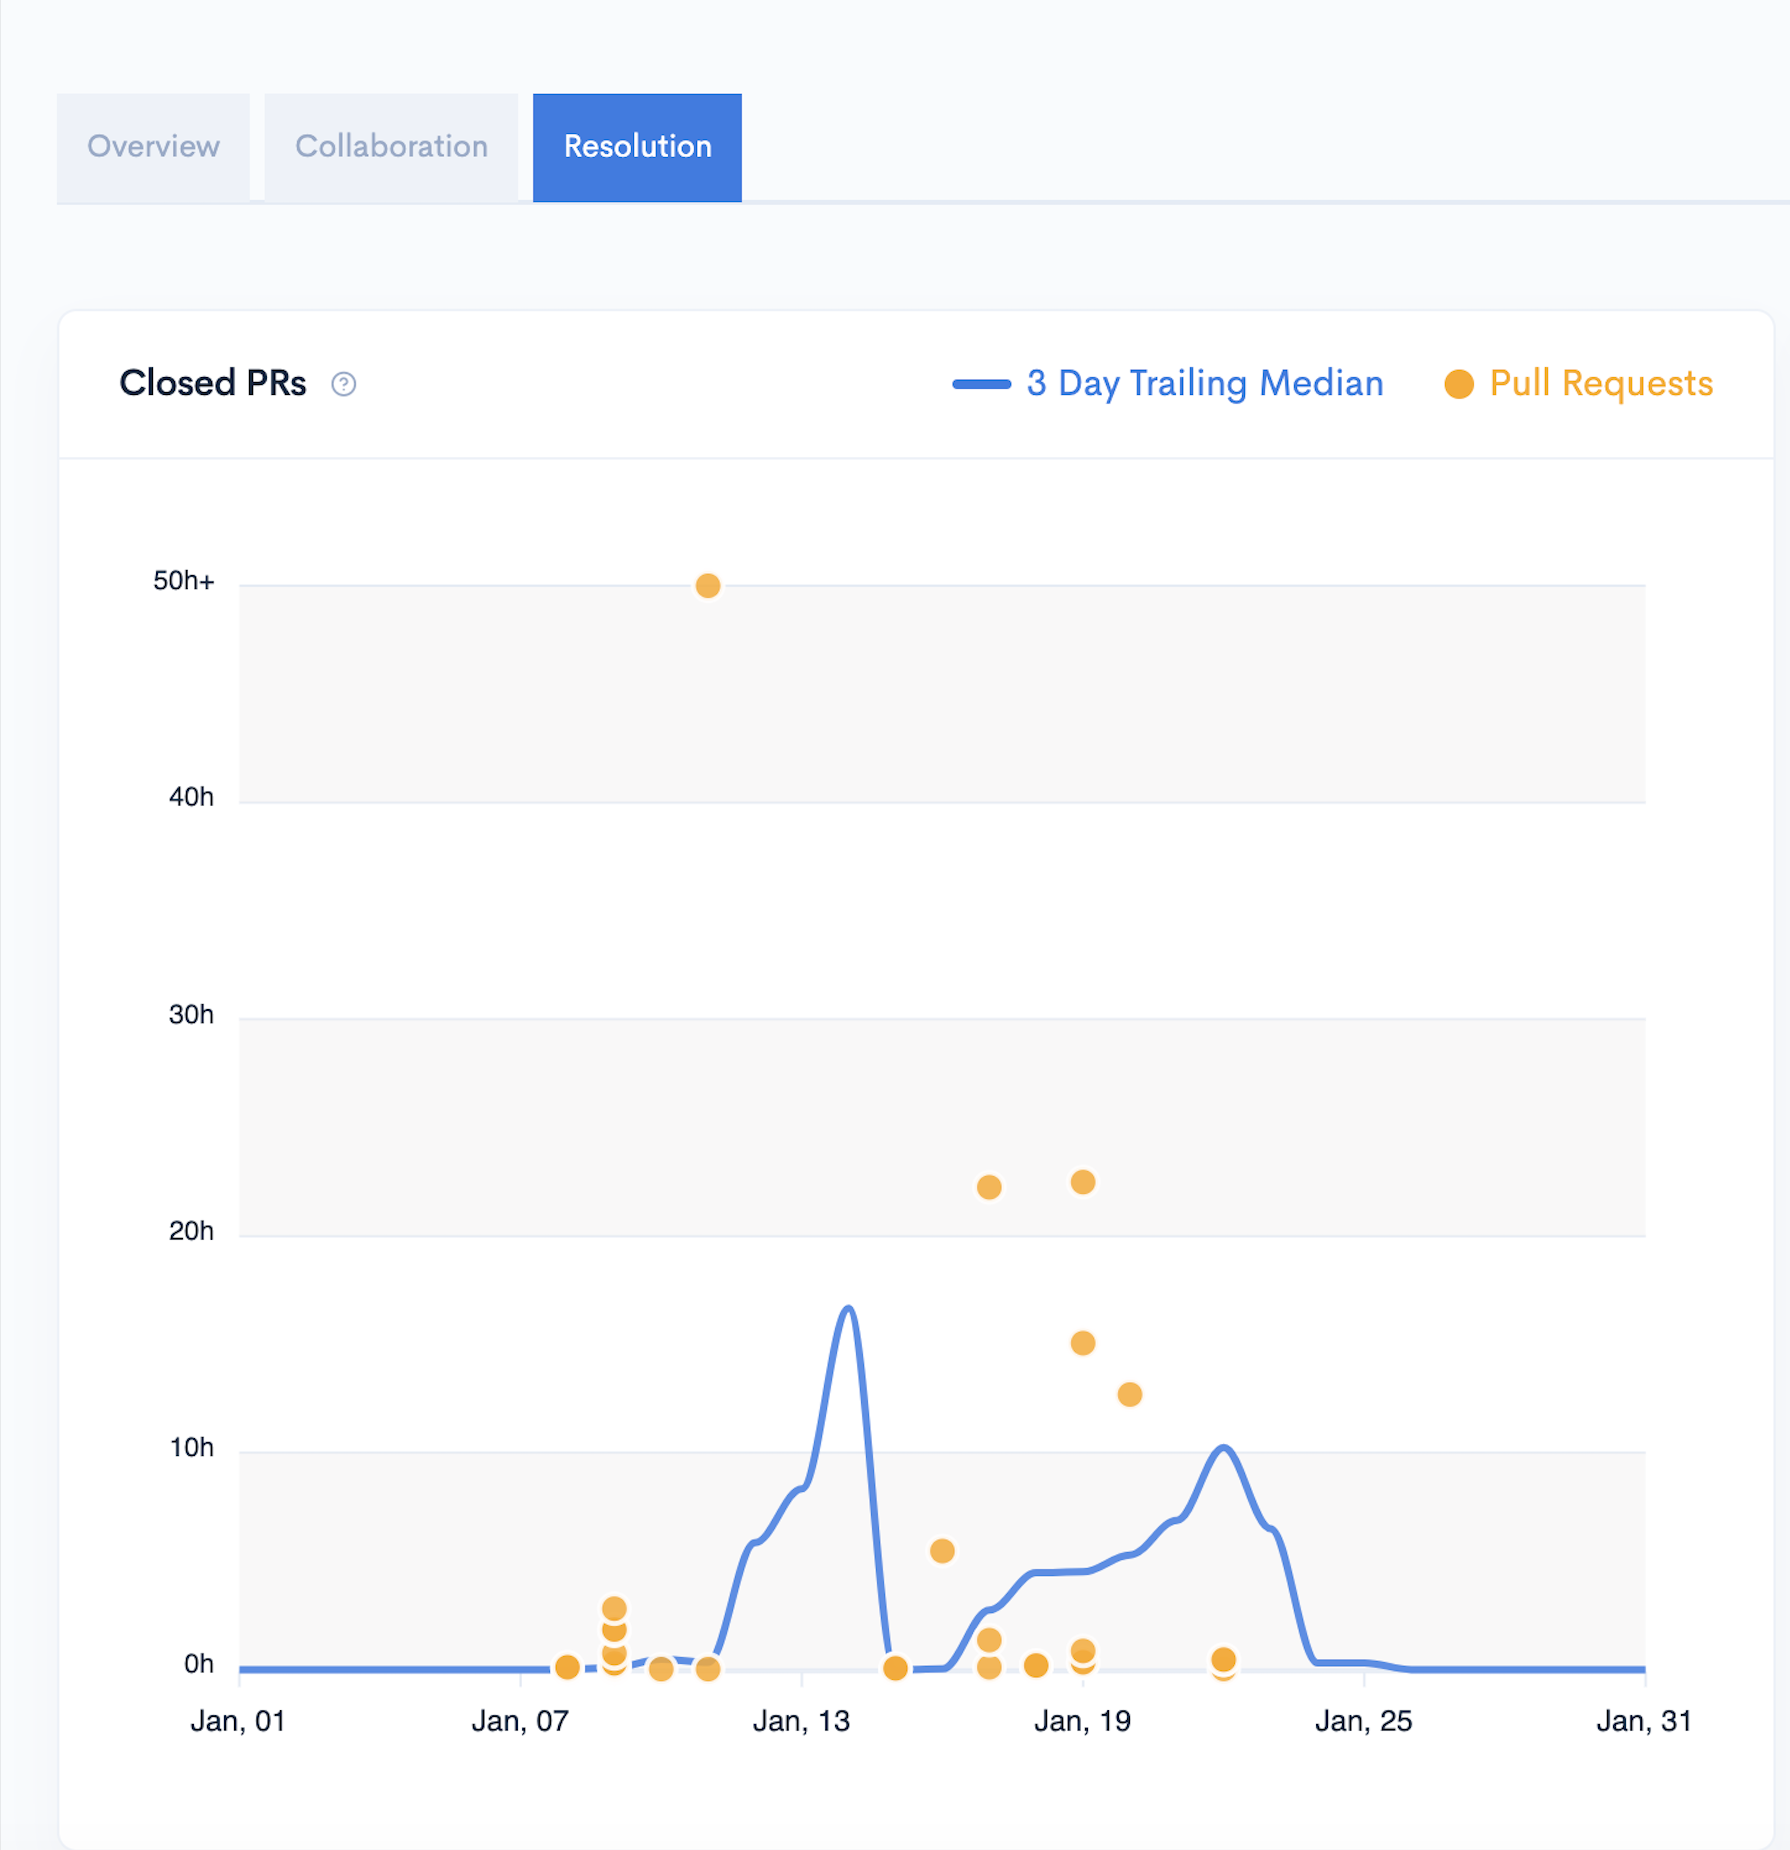
Once you click on a circle, a modal will appear, containing more details about the specific Pull Request.
Close Metrics
The Close Metrics heat-map shows on the x-axis the number of PRs considered for the metrics on the y-axis .
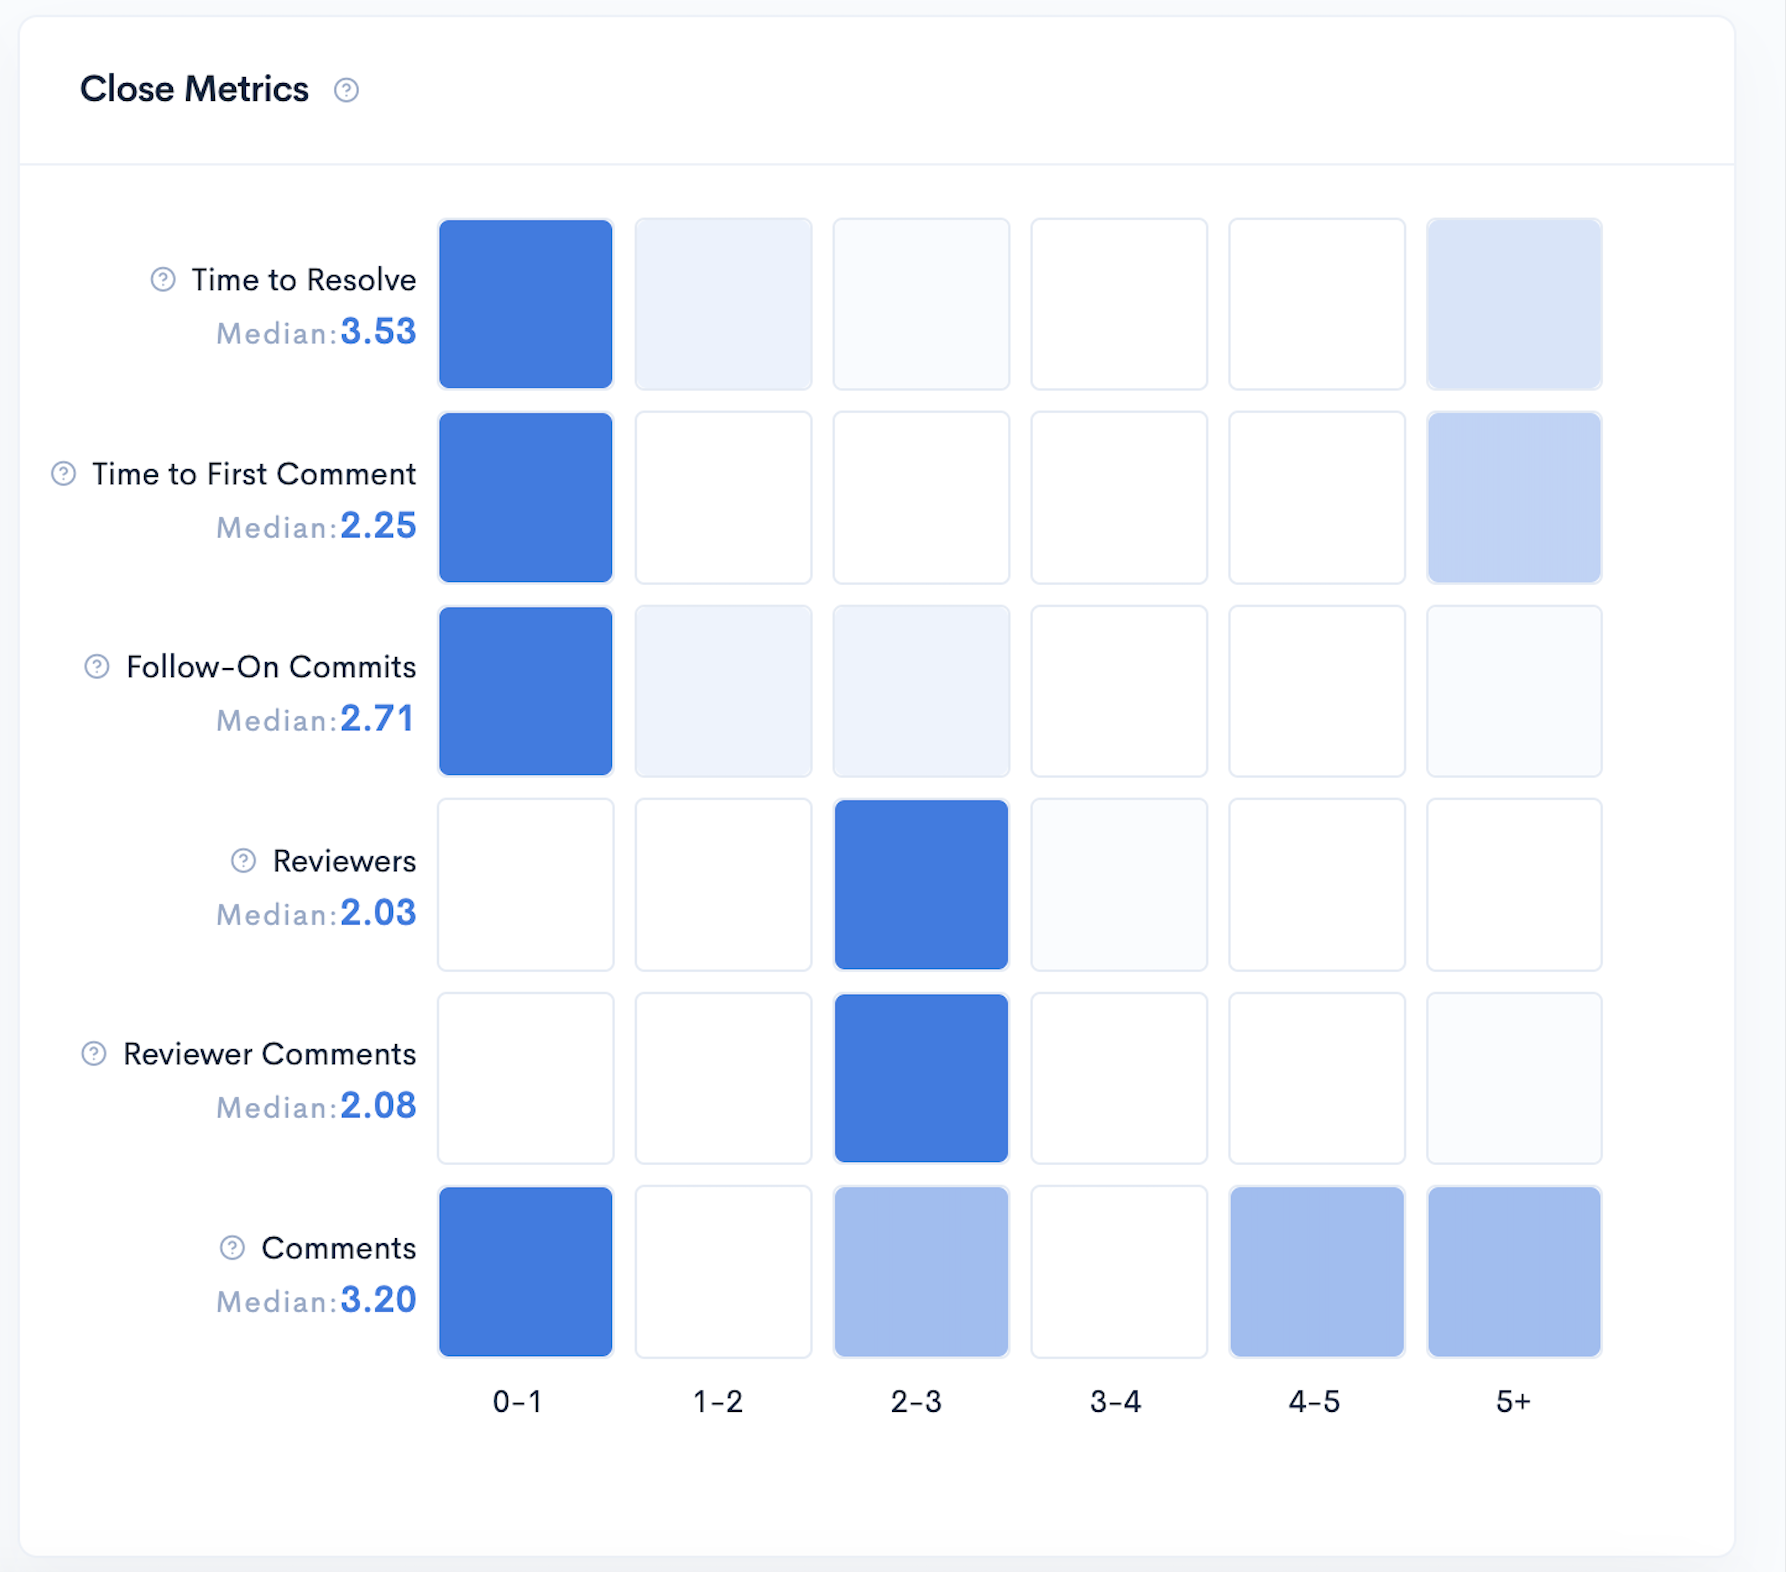
Each metric's description can be found by hovering over the "?" symbol on each of them.
The Close Metrics feature focuses on six core Pull Request cycle metrics to identify bottlenecks over the course of the sprint:
- Time to Resolve: A distribution of how many hours it takes to resolve a Pull Request.
- Time to First Comment: A distribution of the number of hours between when a Pull Request is opened and when the first Reviewer comments.
- Follow-on Commits: A distribution of the follow-on commits made on Pull Requests once they are ready for review.
- Reviewers: A distribution of the number of unique reviewers per Pull Request.
- Reviewer Comments: A distribution of the number of reviewer comments per Pull Request.
- Comments: A distribution of the number of comments per unique reviewer.
Clicking on a metric square from the heat-map will open a modal with all the PRs included in that specific metric. Here you can view all the details related to the PRs.
Updated 5 months ago