

DORA Metrics
A Google research group has identified four key metrics that indicate the health and performance of software engineering teams - DORA Metrics. The DORA Metrics have become an industry standard for how effectively organizations deliver software.
Waydev’s DORA Metrics report is designed for engineering leaders to track and measure software delivery performance metrics.
To calculate the four DORA metrics, Waydev requires users to set up release and incident detection on the Settings page. Here is the DORA Metrics setup page.
When viewing the DORA Metrics dashboard in Waydev, you can filter data by teams and applications.
Measuring the DORA Metrics
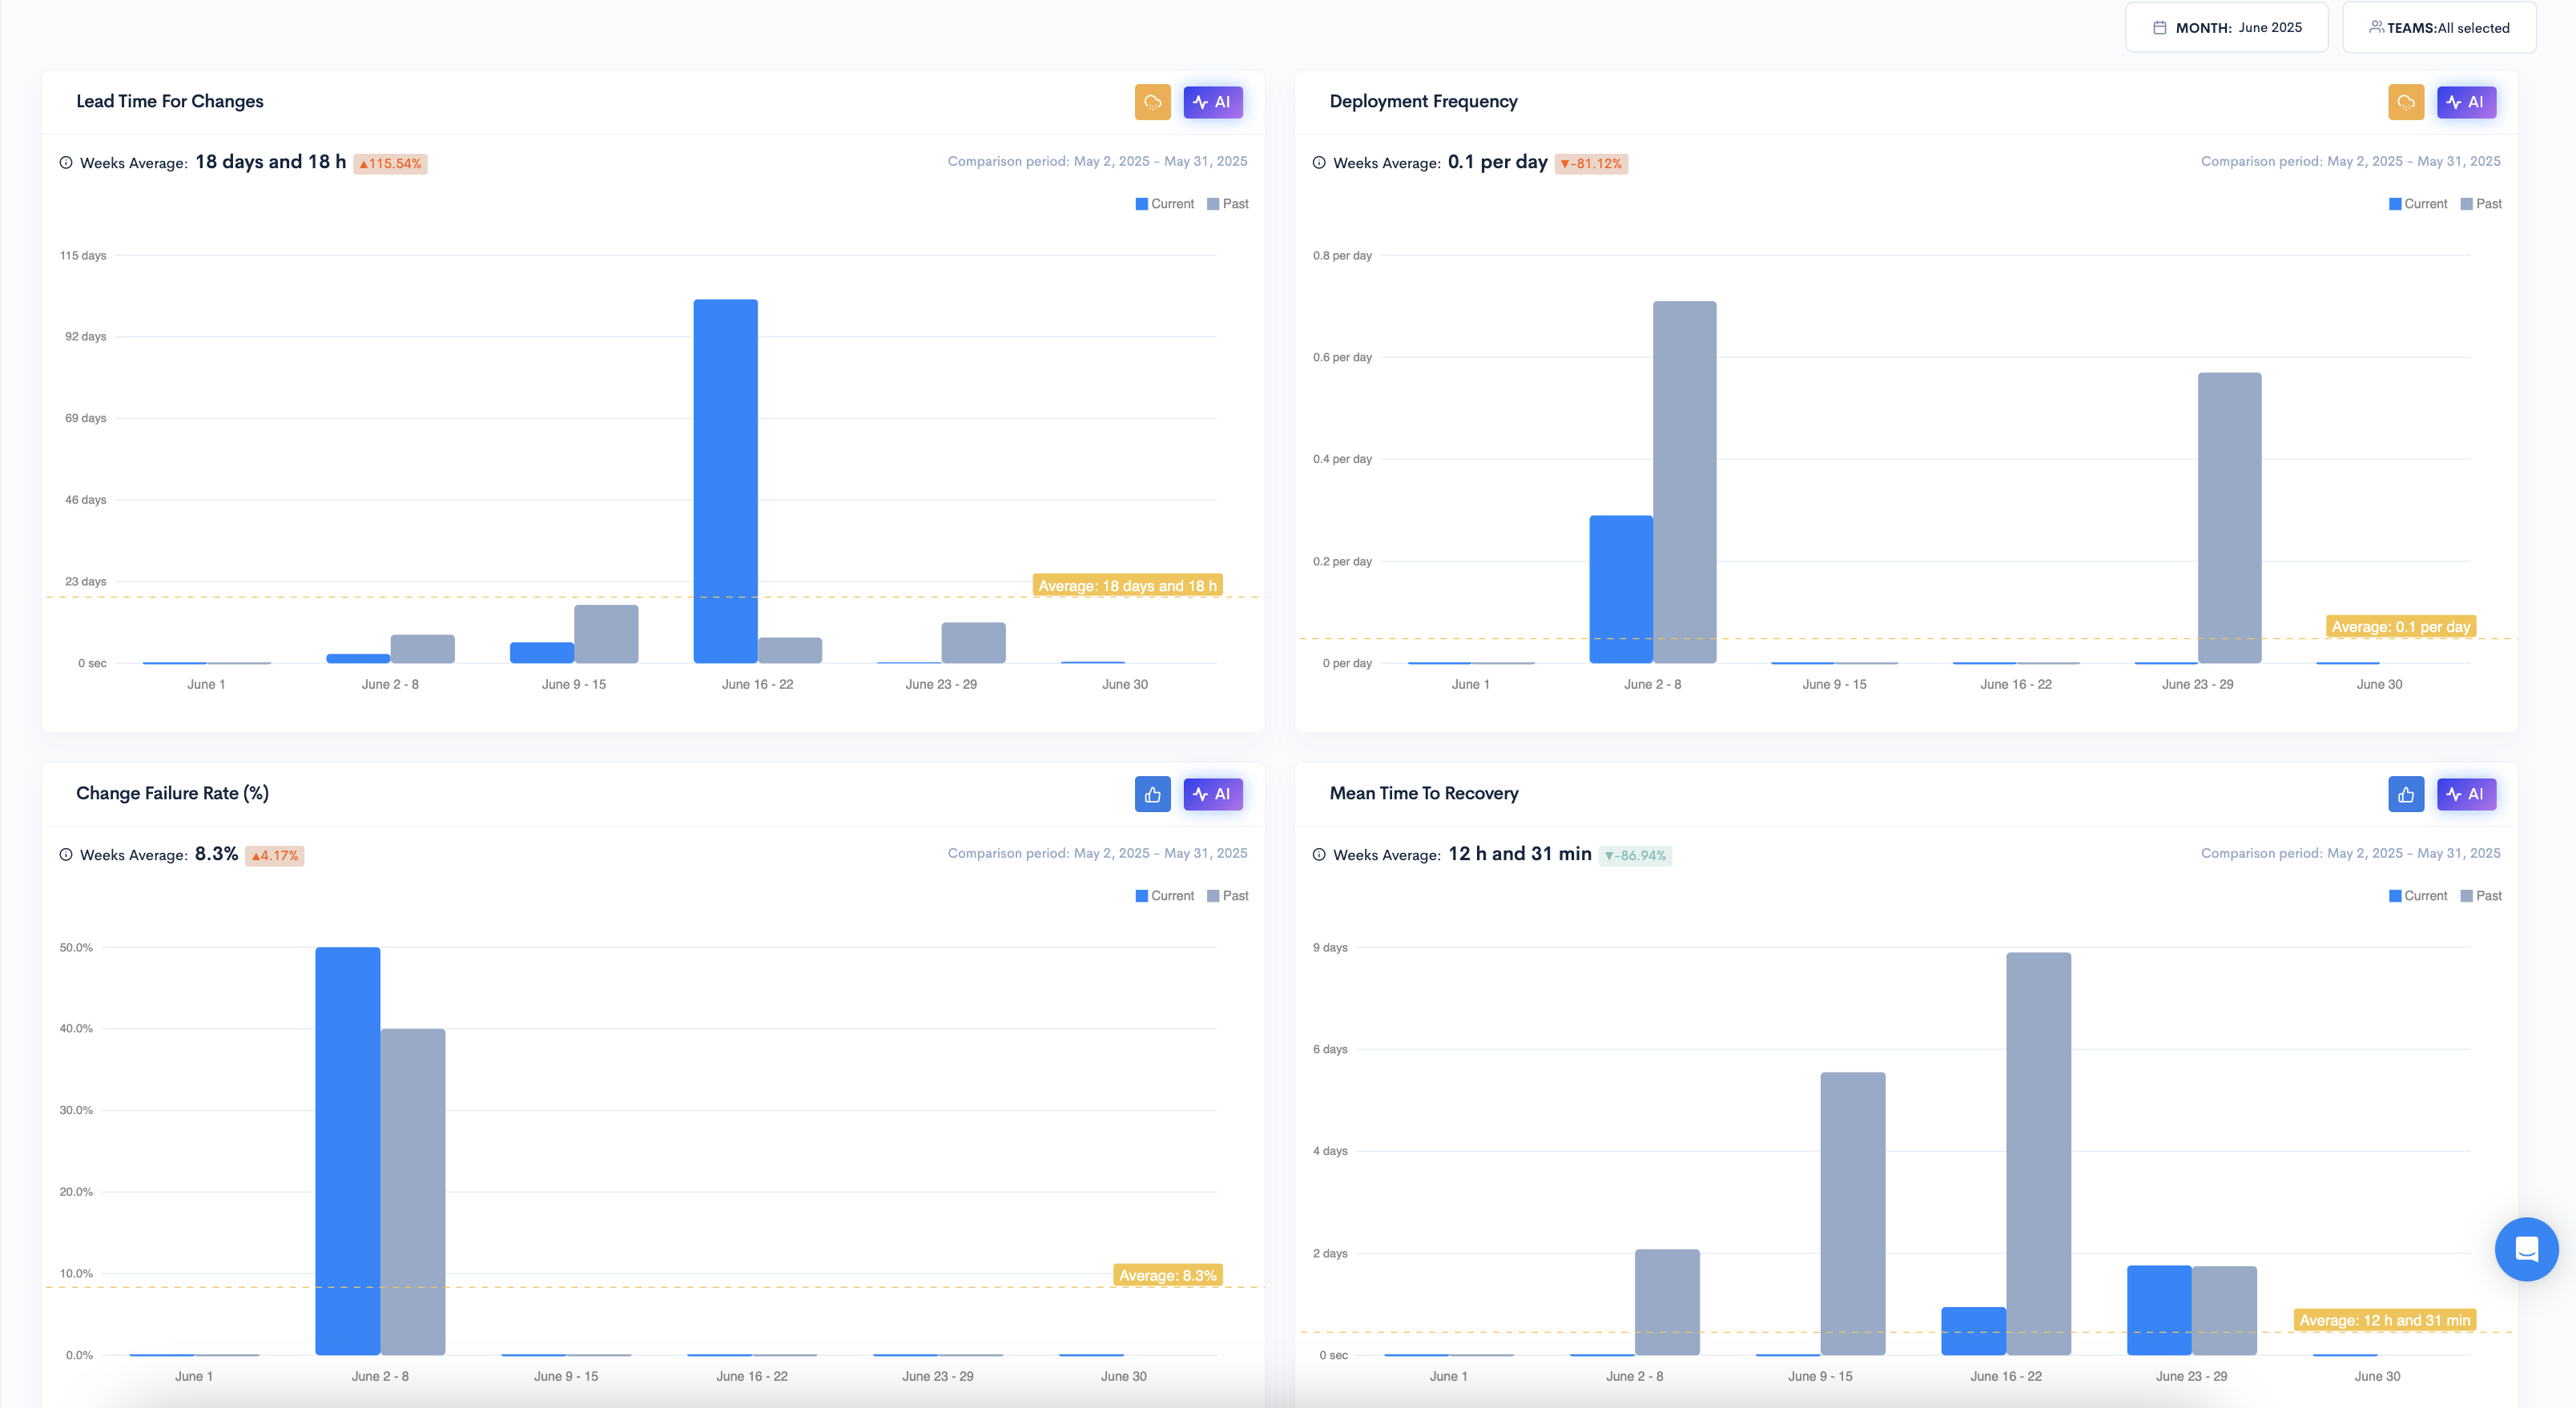
Waydev’s DORA Metrics report includes four key metrics that engineering leaders can use to track software delivery performance:
-
Deployment Frequency: Measures how often code, including bug fixes, capability improvements, and new features, is deployed into production.
-
Lead Time for Changes: Measures the amount of time it takes for code to get into production from the first commit.
-
Change Failure Rate: Measures the percentage of deployments that cause a failure in production.
-
Mean Time to Recovery: Measures the amount of time it takes to recover from a failure in production.

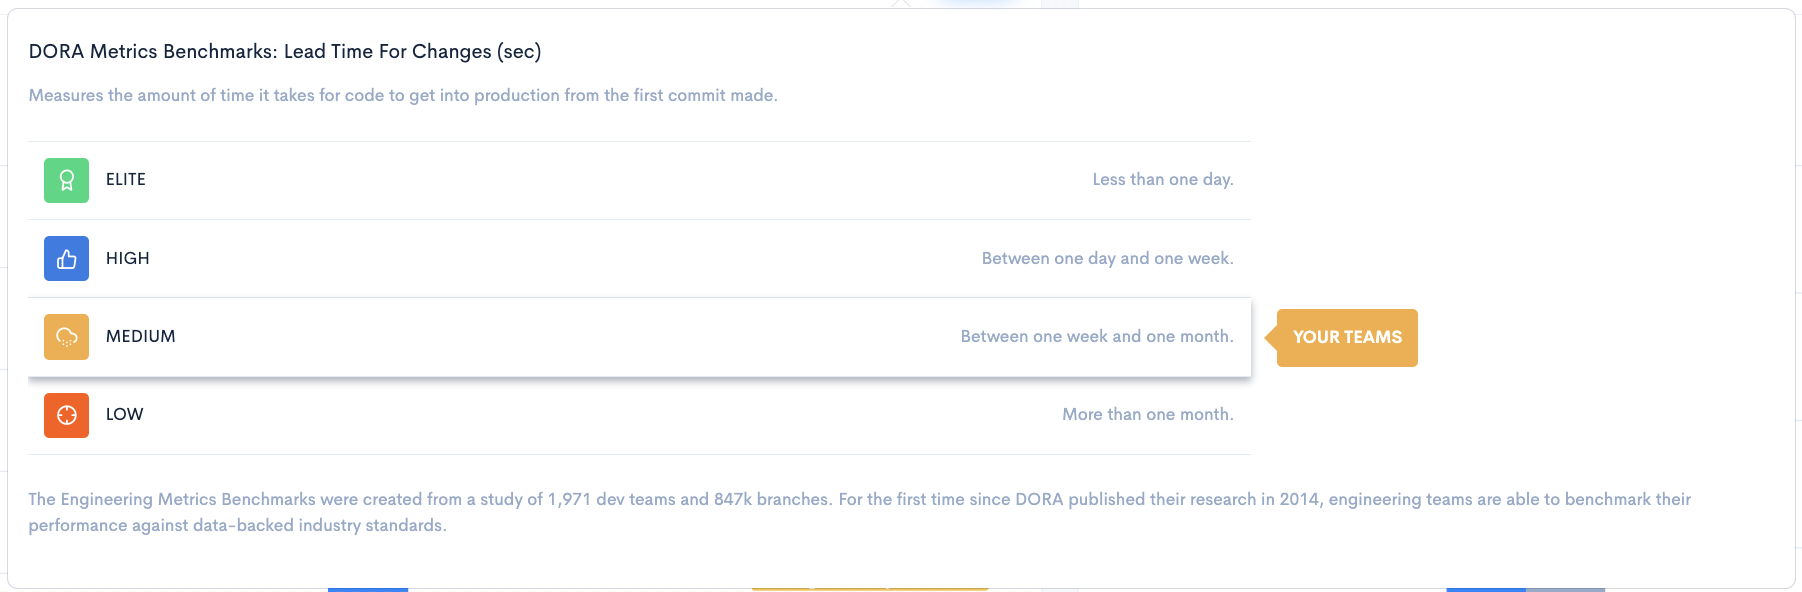
The Engineering Metrics Benchmarks have been derived from a comprehensive study of 1,971 development teams and 847,000 code branches. This represents a major milestone since the publication of DORA's research in 2014, as engineering teams now have the opportunity to gauge their performance against robust, data-driven industry benchmarks.
For every single metric, an icon representing the corresponding benchmark will appear in the metric widget. By simply hovering over this icon, you will be presented with detailed benchmarks for that particular metric and their associated values.
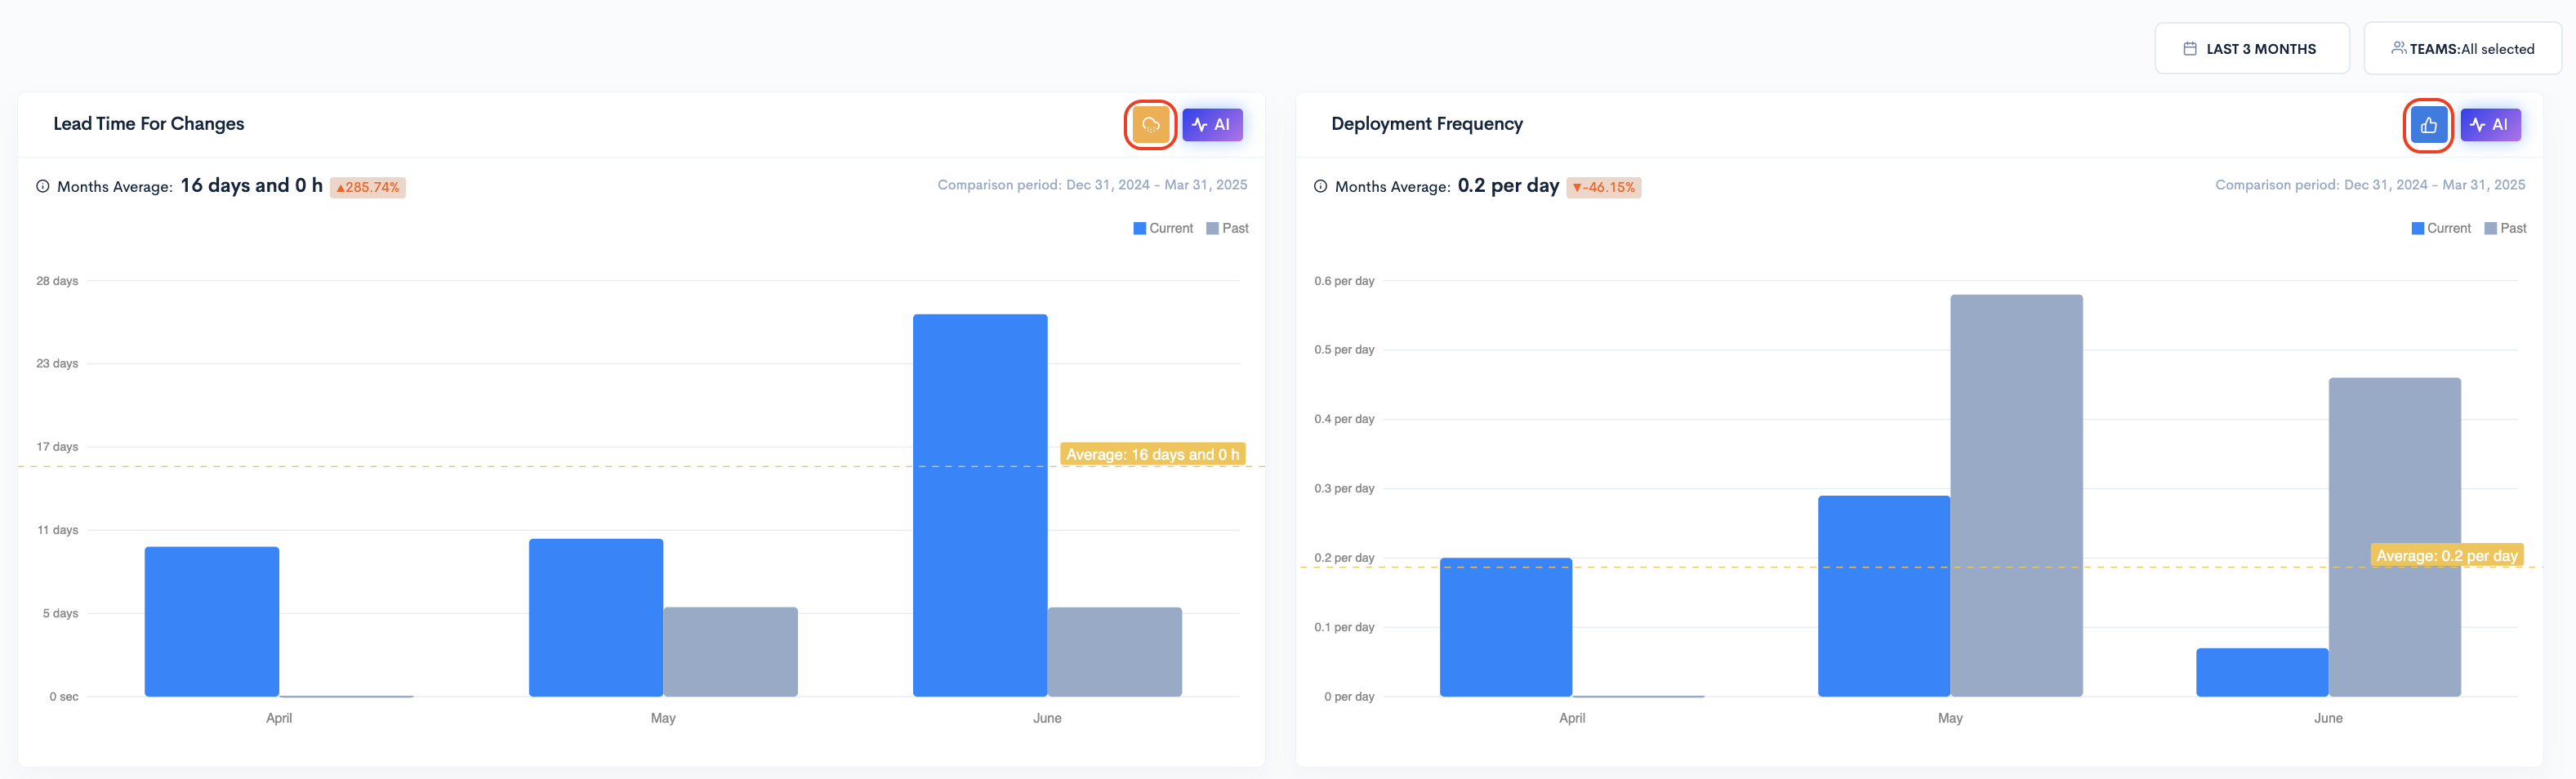
Deployment Frequency
Deployment Frequency measures how often code is deployed into production.
To see all the builds and deploys that occurred in the selected time period across the selected applications, scroll down on the DORA Metrics page and select View Releases.
You will see a breakdown of builds/deploys that occurred in the selected time period across the selected applications, including the source, environment, the number, outcome, repository, developer, release date.

Lead Time for Changes
Lead Time for Changes measures the elapsed time between the first commit and the deployment to the final environment.
To see a Pull Request breakdown of all the Pull Requests analyzed in the selected timeframe, scroll down and click View Pull Requests. To zoom into a particular Pull Request, click the "More" button corresponding to that Pull Request.
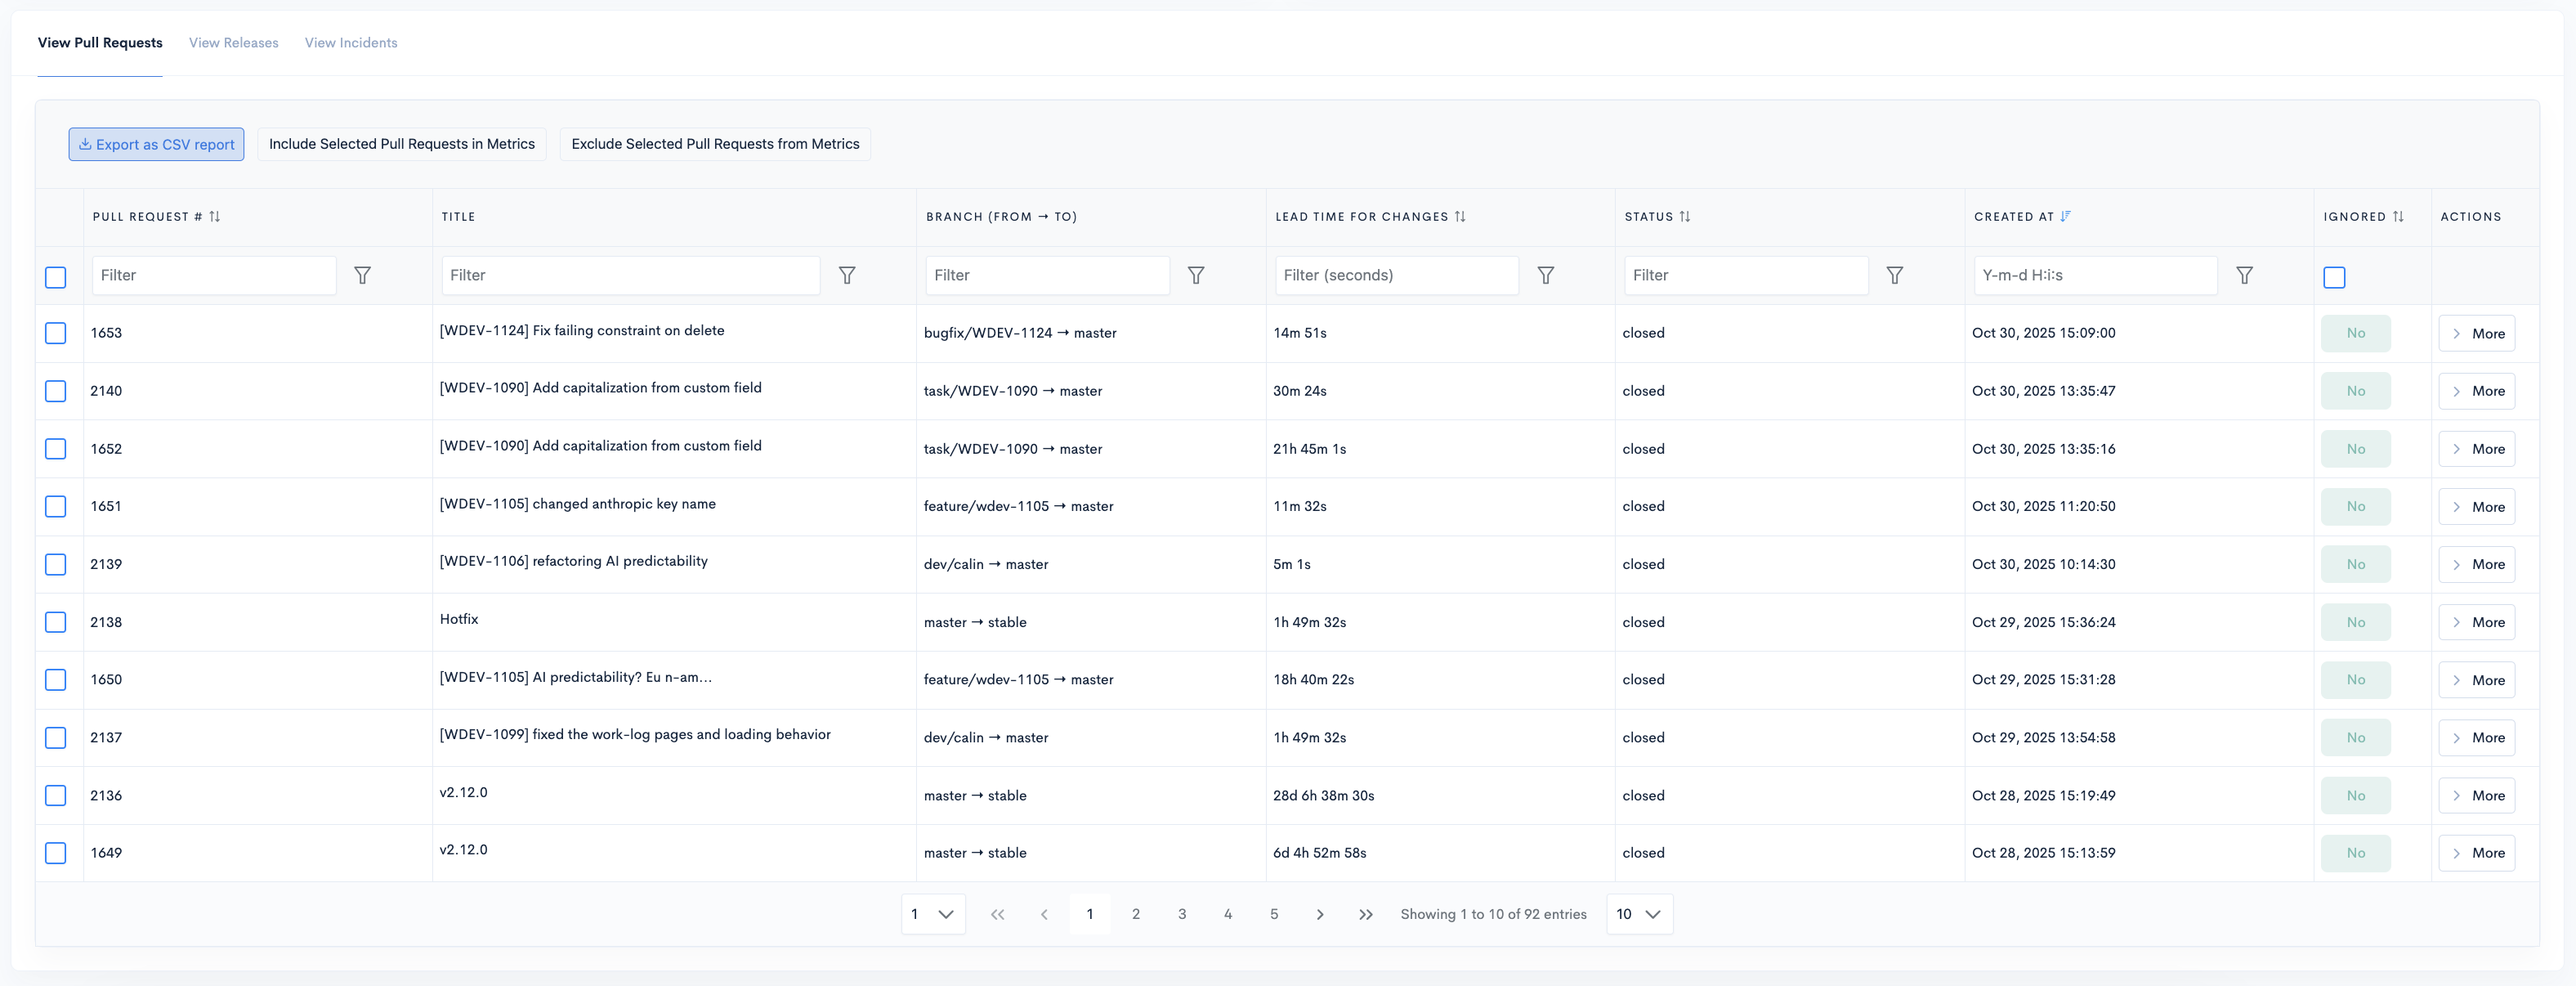
Once clicked, a modal will appear containing more information, such as the date of the first commit, when the Pull Request was created, when the Pull Request was reviewed and merged, the total number of files and lines of code affected, and the Lead Time for Changes for the Pull Request.
The Lead Time for Changes can be broken down into:
- Coding Time: Time elapsed between the first commit made and a Pull Request being opened.
- Review Lag Time: Time elapsed between a Pull Request being opened and the first review made.
- Review Time: Time elapsed between the first review and the Pull Request merged.
- Deploy Time: Time elapsed between the Pull Request being merged and its deployment to the final environment.
The modal also contains a link button which takes you directly to the Pull Request page in your Git Provider. It also shows all associated code commits, reviews, comments, tickets, deploys, and bot comments.

Change Failure Rate
The Change Failure Rate metric indicates the percentage of deployments that lead to failures in production.
Change Failure Rate is calculated by dividing the total number of failed deploys by the total number of deploys in a given time period. A deployment is considered "failed" if one or more incidents occur between deployments.
To view all failed deployments for the selected filters, scroll down and click View Incidents. You can view the type, status, time to recovery, developer, source, occurred date, fixed date.
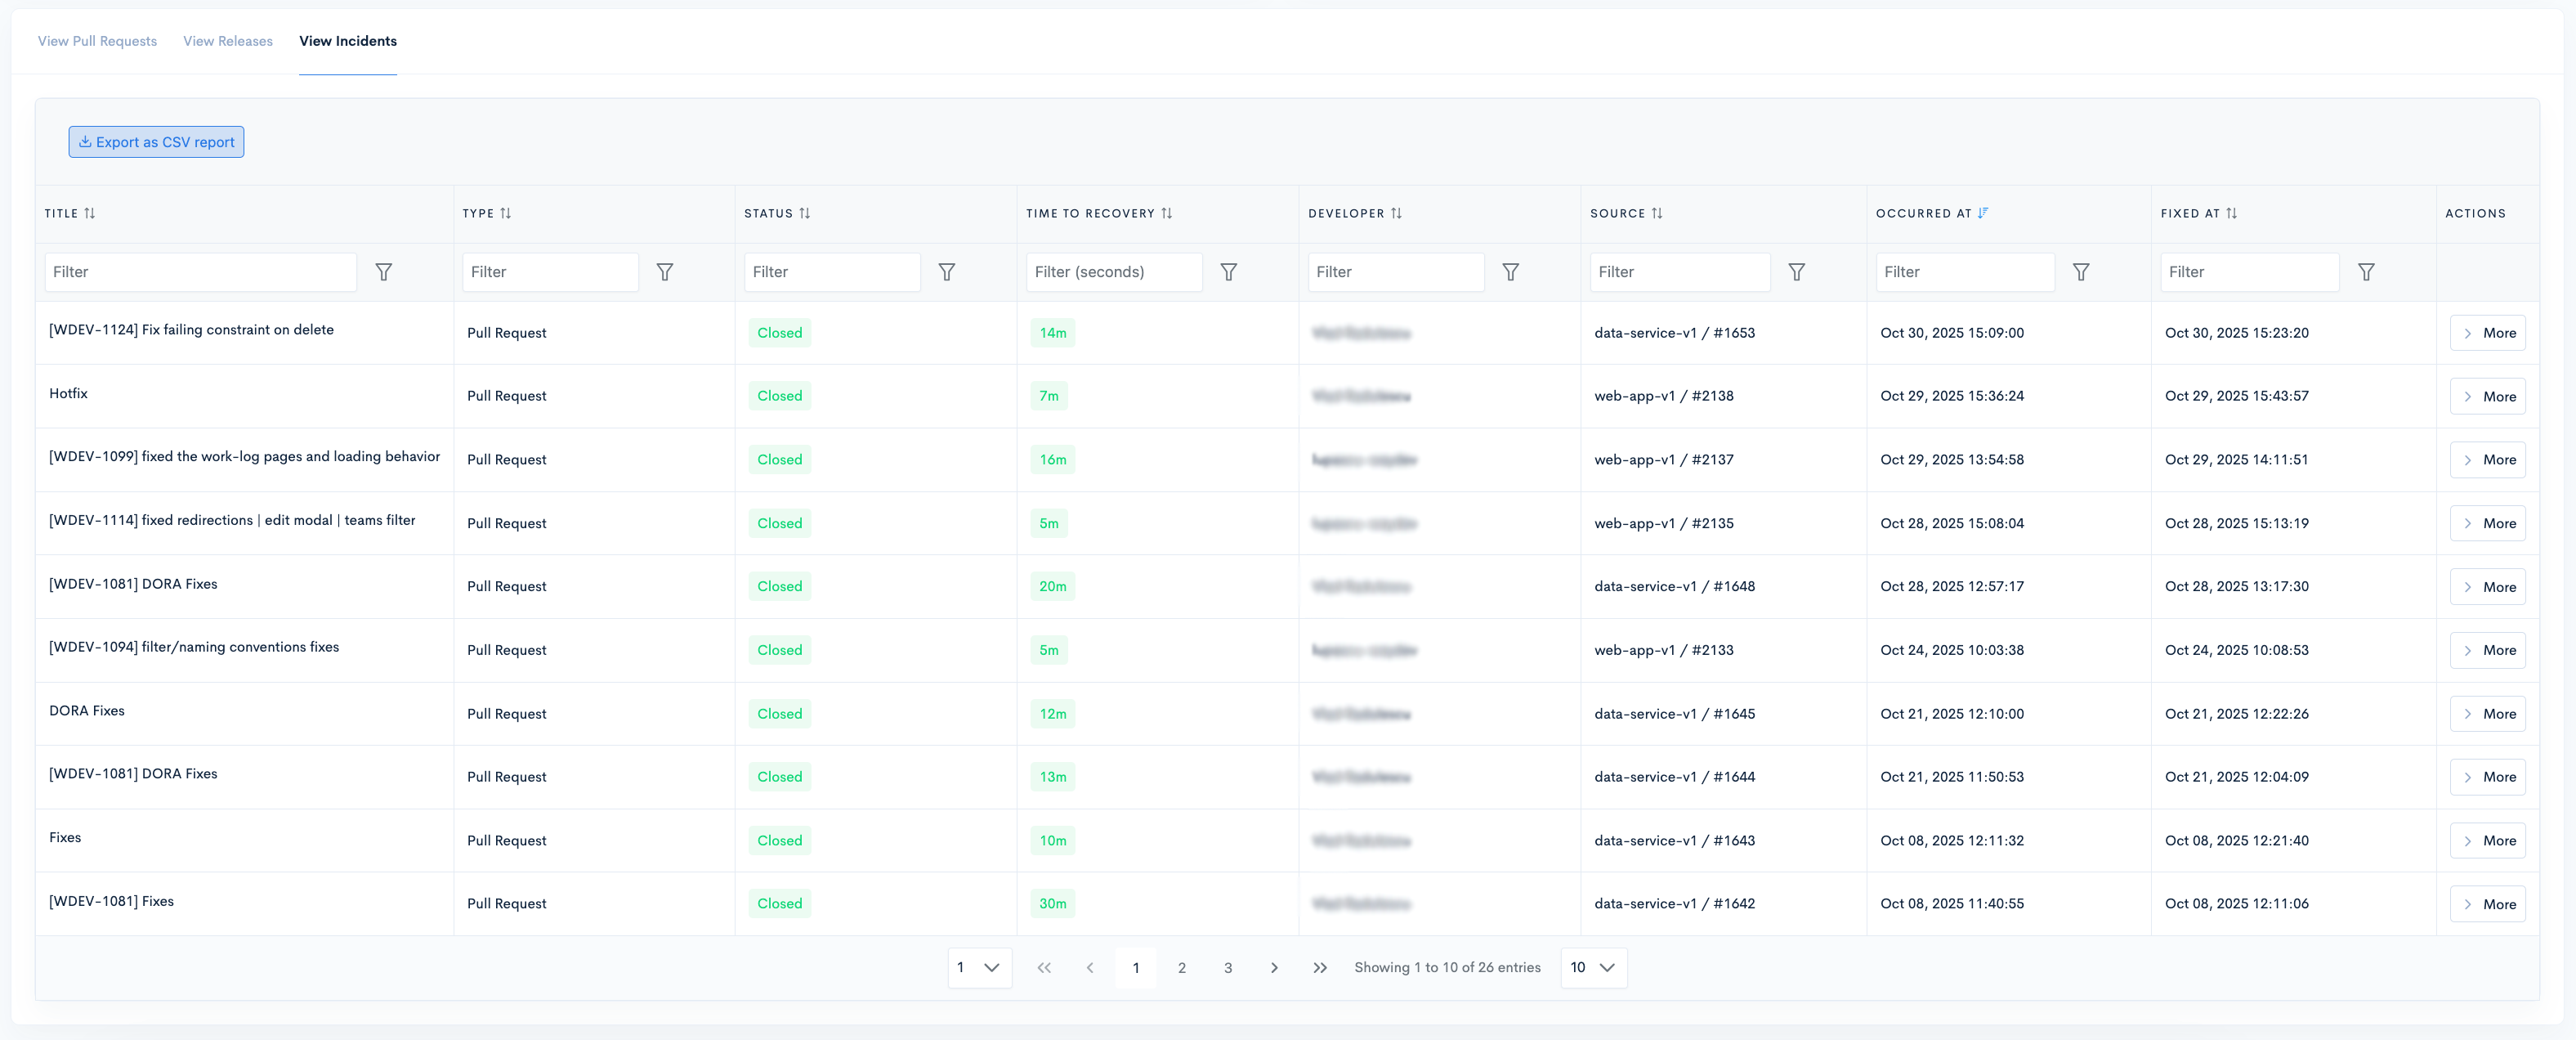
Mean Time to Recovery
The Mean Time to Recovery measures the time it takes to recover from a failure in production. It analyzes the elapsed time between a failed deployment and a successful deployment on the same repository and branch.
Calculation of Mean Time to Recovery: For each detected incident, we calculate the Cycle Time. The Mean Time to Recovery is the total Cycle Time of all incidents divided by the number of incidents.
To see an Incident Pull Request breakdown of all the Pull Requests analyzed in the selected timeframe, scroll down and click View Incidents. To zoom into a particular Pull Request, click the "More" button corresponding to that Pull Request.

Once clicked, a modal will appear containing more information, such as the date of the first commit, when the Pull Request was created, when the Pull Request was reviewed and merged, the total number of files and lines of code affected, and the Lead Time for Changes for the Pull Request.
The Lead Time for Changes can be broken down into:
- Coding Time: Time elapsed between the first commit made and a Pull Request being opened.
- Review Lag Time: Time elapsed between a Pull Request being opened and the first review made.
- Review Time: Time elapsed between the first review and the Pull Request merged.
- Deploy Time: Time elapsed between the Pull Request being merged and its deployment to the final environment.
The modal also contains a link button which takes you directly to the Pull Request page in your Git Provider. It also shows all associated code commits, reviews, comments, tickets, deploys, and bot comments.

DORA DevOps Metrics Tracking for Team Efficiency
With the help of the DORA Metrics, you will be able to:
- Measure your teams’ DORA Metrics automatically and increase software delivery velocity.
- Compare your teams’ DORA Metrics to industry benchmarks to spot areas for improvement.
Updated 8 months ago