

AI Adoption
Measure the AI adoption in your company by seeing how many contributors are actively using AI Coding tools.
Available integrations
Currently the feature supports GitHub Copilot, Cursor, Claude Code(beta) and Windsurf(beta), Devin.
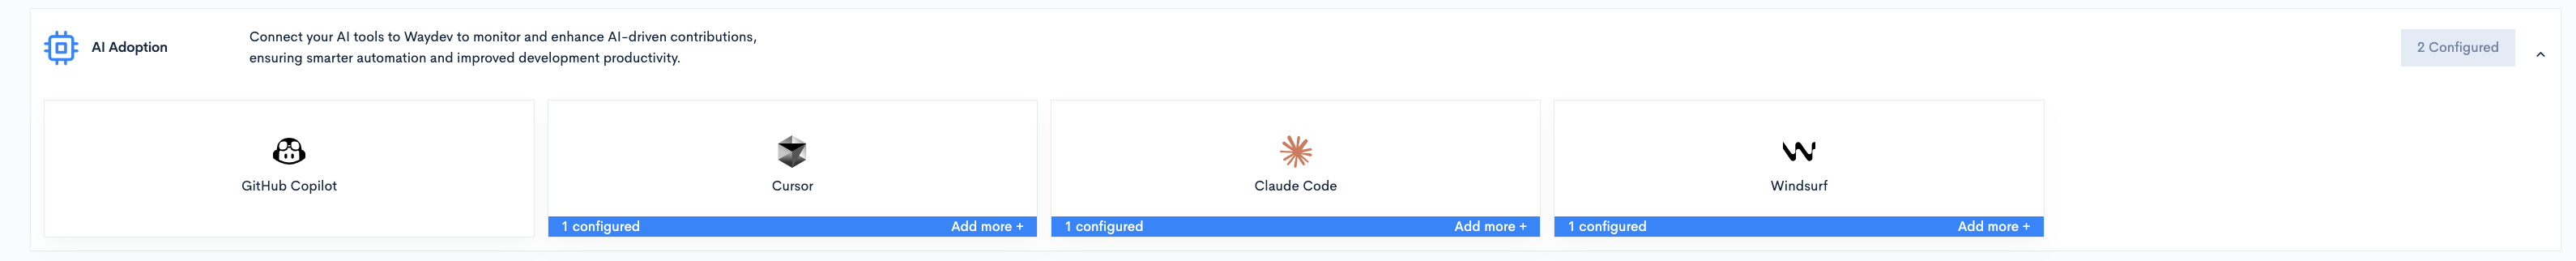
Additional integrations may be available in the future.
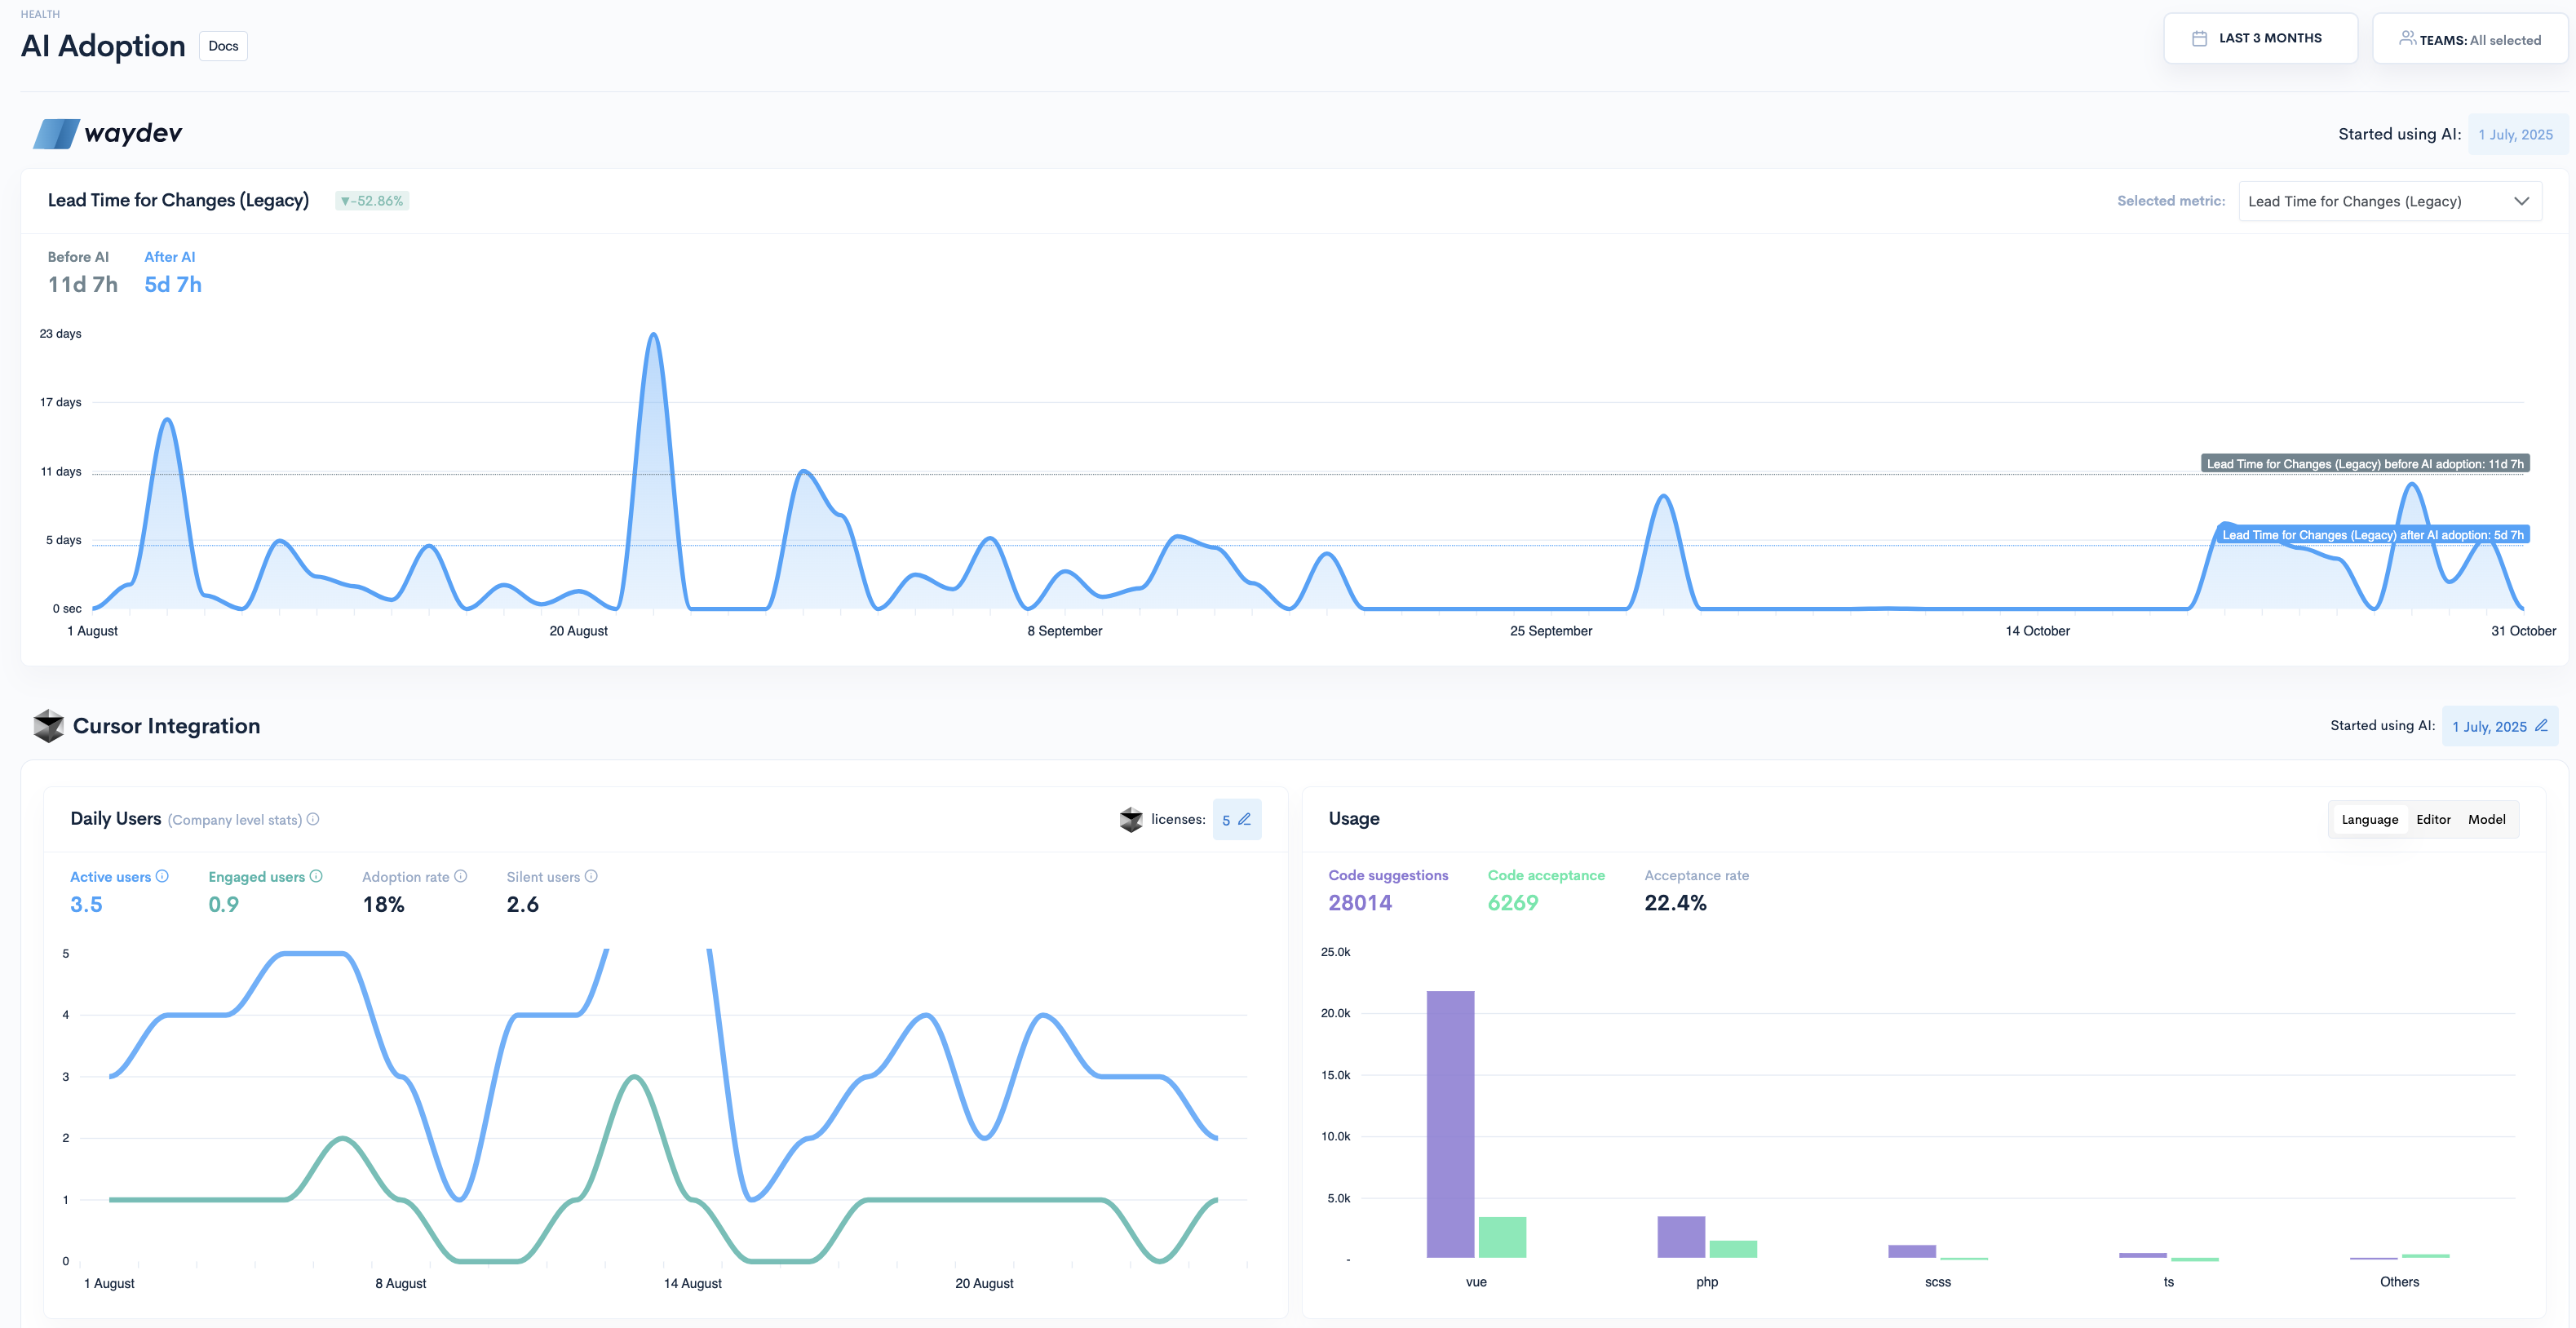
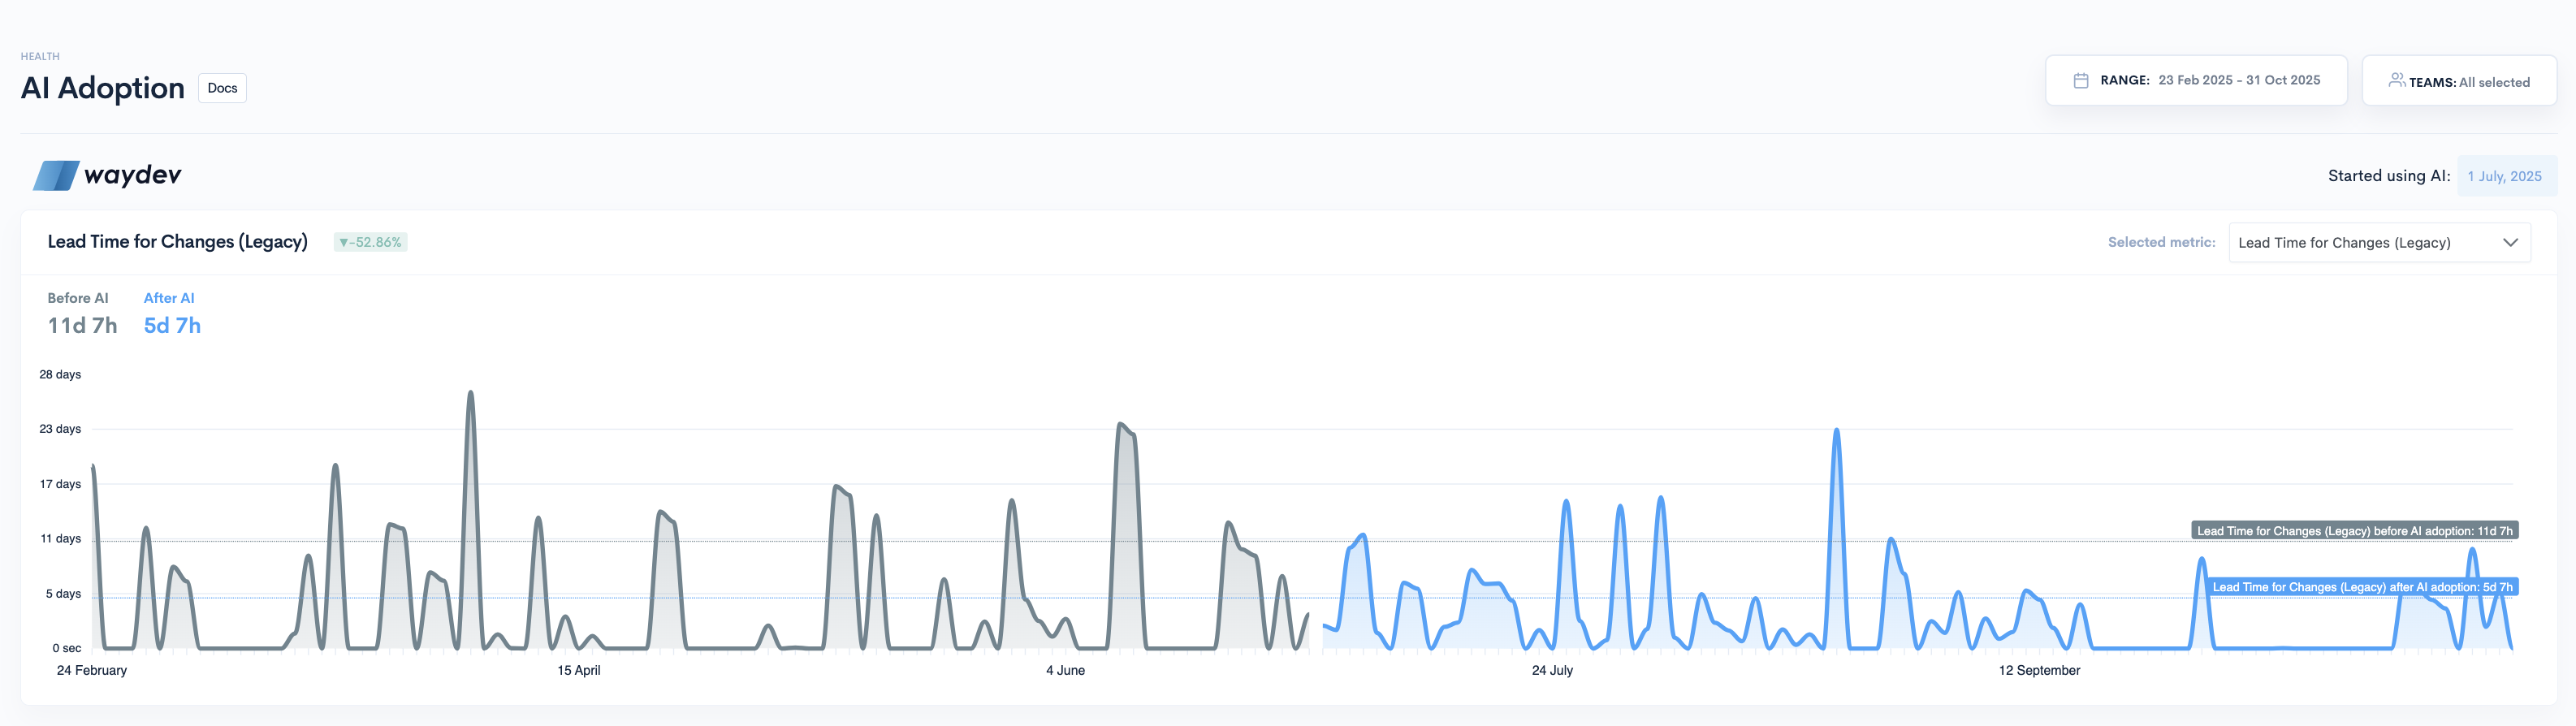
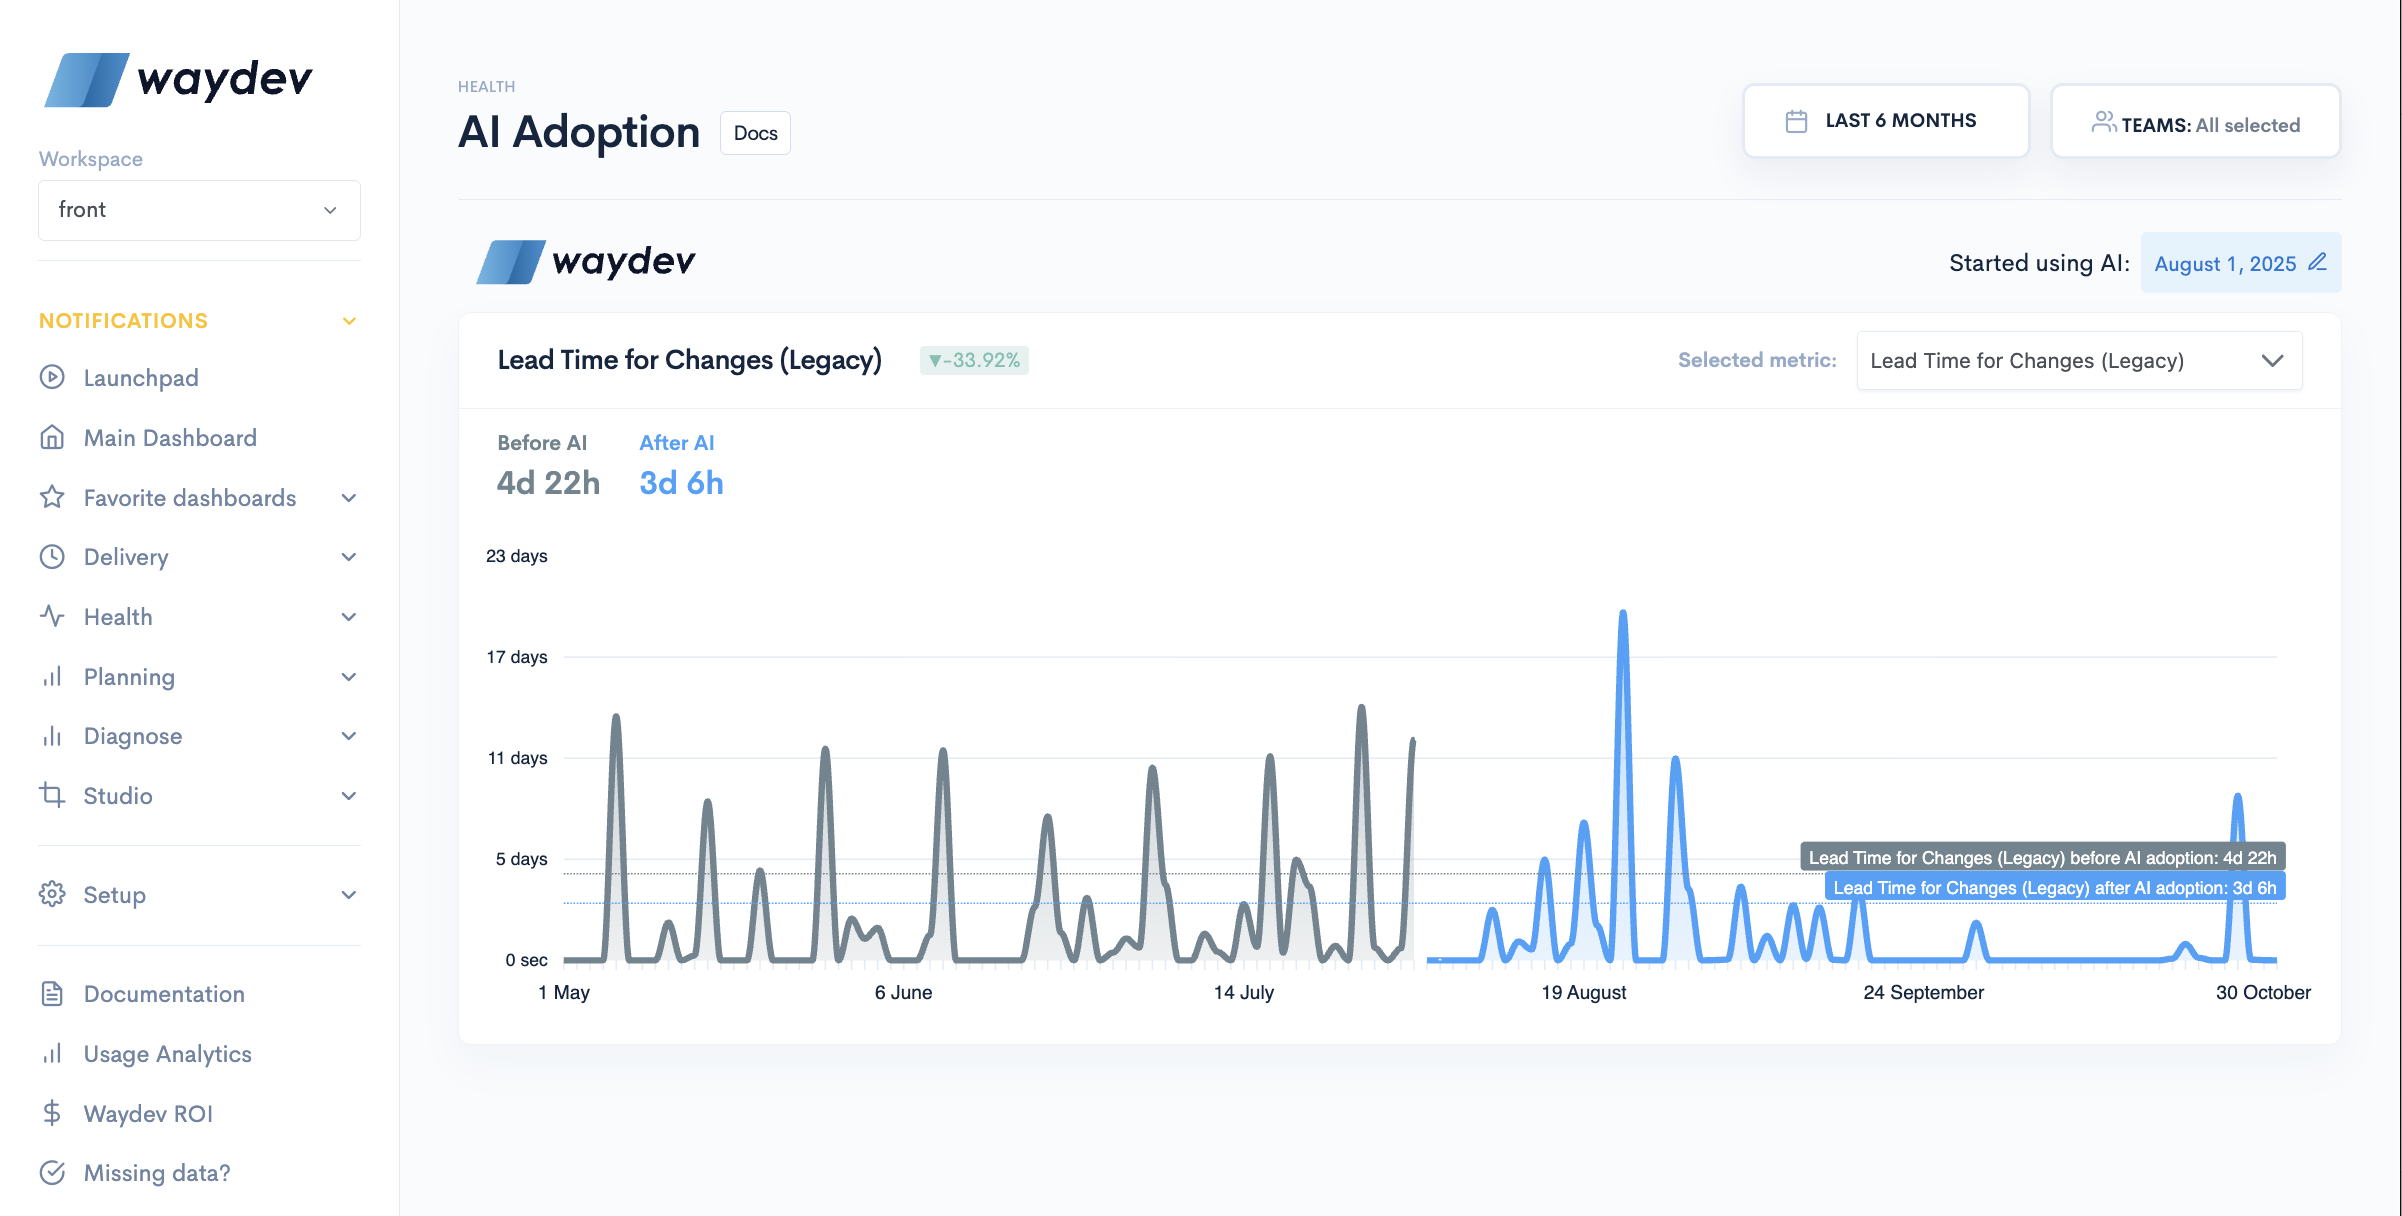
In the top right corner of the page, you can see when AI usage has started. This data helps track how AI adoption has impacted certain engineering metrics over time.
The graph visualizes these changes, comparing performance before and after AI adoption:
- The grey area represents metrics before AI adoption.
- The blue area reflects how the metrics evolved after adopting AI.
If the date when AI usage started is not included in the selected date range, the graph will display only the After AI trends and the average for Before AI for the metrics.
Here are some of the metrics you can see in this graph:
- Churn: Churn is defined as the proportion of code that has been rewritten or deleted within the first 21 days after its creation. This value is adjustable on the Settings page.
- Cycle Time: Cycle Time is one of the best measures of an engineering organization’s velocity. It measures the elapsed time from the first commit made to the production release.
- Coding time: Measures the average amount of time it takes for a contributor to issue a pull request after starting work on a code change or feature.
- Review time: Measures how fast submitters incorporate feedback from their peers in code review and is the time from a PR's first review to that PR being merged.
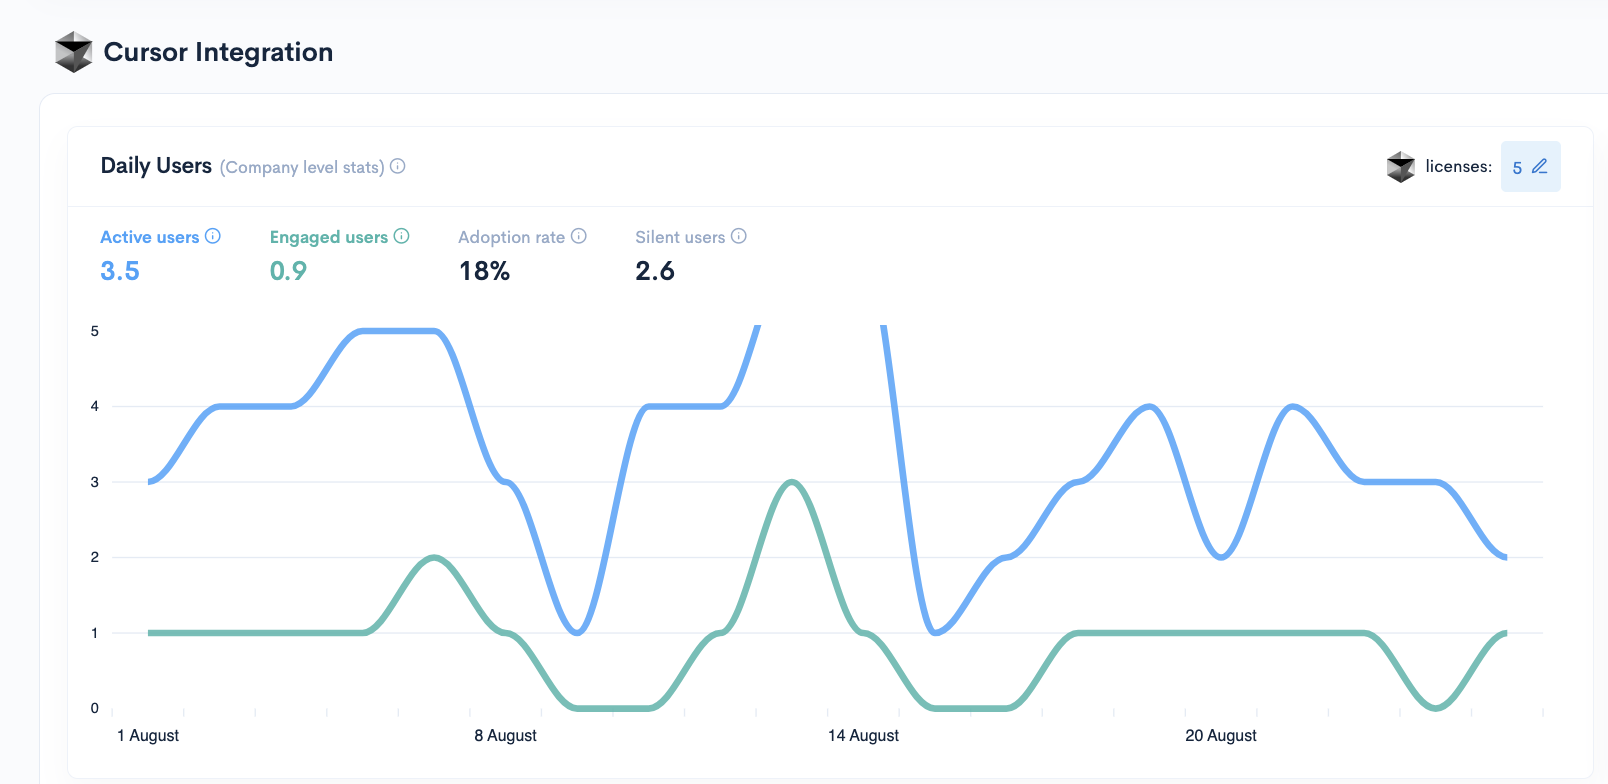
Daily Users
The Daily Users graph shows the daily usage of the AI copilot. Similar graph is available for all the AI integrations. The number of licences can be easily edited from the top right corner of the widget and it will also change the number initially set for the integration.
You can track the following metrics:
- Active users: Active users interacted with the Copilot, but they didn’t necessarily accept its suggestions.
- Engaged Users: Engaged users interacted with the Copilot and accepted at least one of its suggestions.
- Adoption rate: The percentage of users engaged with the Copilot out of all acquired licenses.
- Silent users: The percentage of active users who didn't accept any Copilot suggestions from all acquired licenses.
Usage Graph
The usage graph provides insights into the number of code suggestions the AI tool has generated and the number of those that were accepted. Similar graph is available for all the AI integrations.
Available Metrics
- Code suggestions – The total number of code suggestions made by the AI.
- Code acceptance – The number of accepted AI-generated suggestions.
- Acceptance rate – The percentage of accepted code suggestions.
Additional Breakdown
You can also filter the graph by:
- Coding language – Identify which programming languages are used most with AI-generated suggestions.
- Coding editor – See which code editor has the highest AI-assisted activity.
- AI model – Analyze which AI model is being used the most.

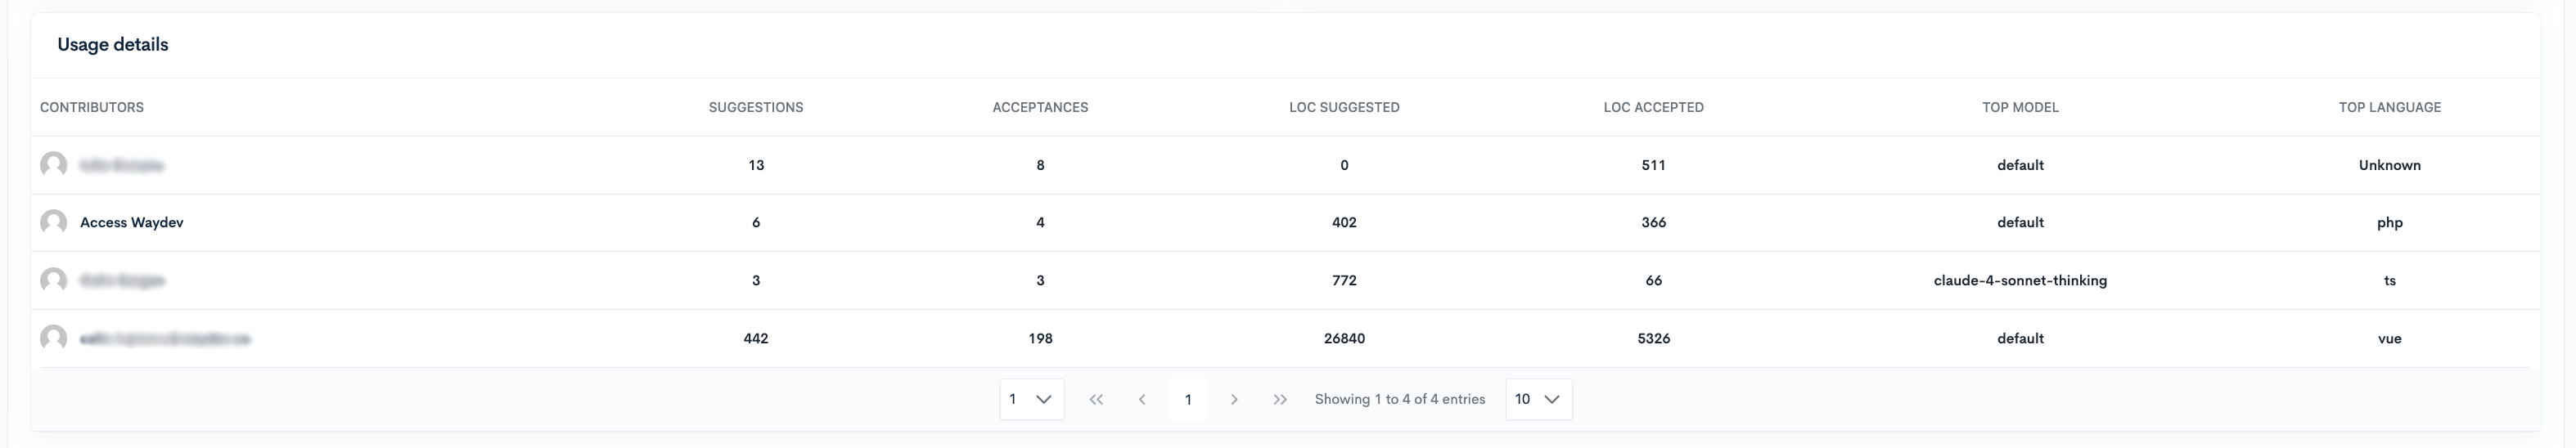
Usage details
The Usage details table will show six usage related metrics for contributors who have active licences. Similar table is available for all the AI integrations.
You'll be able to see:
- The number of AI Suggestions
- Acceptances: the total number of suggestions accepted
- LoC Suggested: total lines of code suggested
- Loc Accepted: total lines of code accepted
- Top Model: the most used AI model by the contributor
- Top Language: the most used language by the contributor
No integrations
I you have no AI tools integrations you can use the top graph from the feature. Simply fill the Started using AI date and the graph will display a before and after for the metrics.
Updated 4 months ago