

Custom Targets
Set targets within Waydev, so you can keep track of your team’s progress.
Creating a new target
To set targets, navigate to Custom Targets in the Studio section.
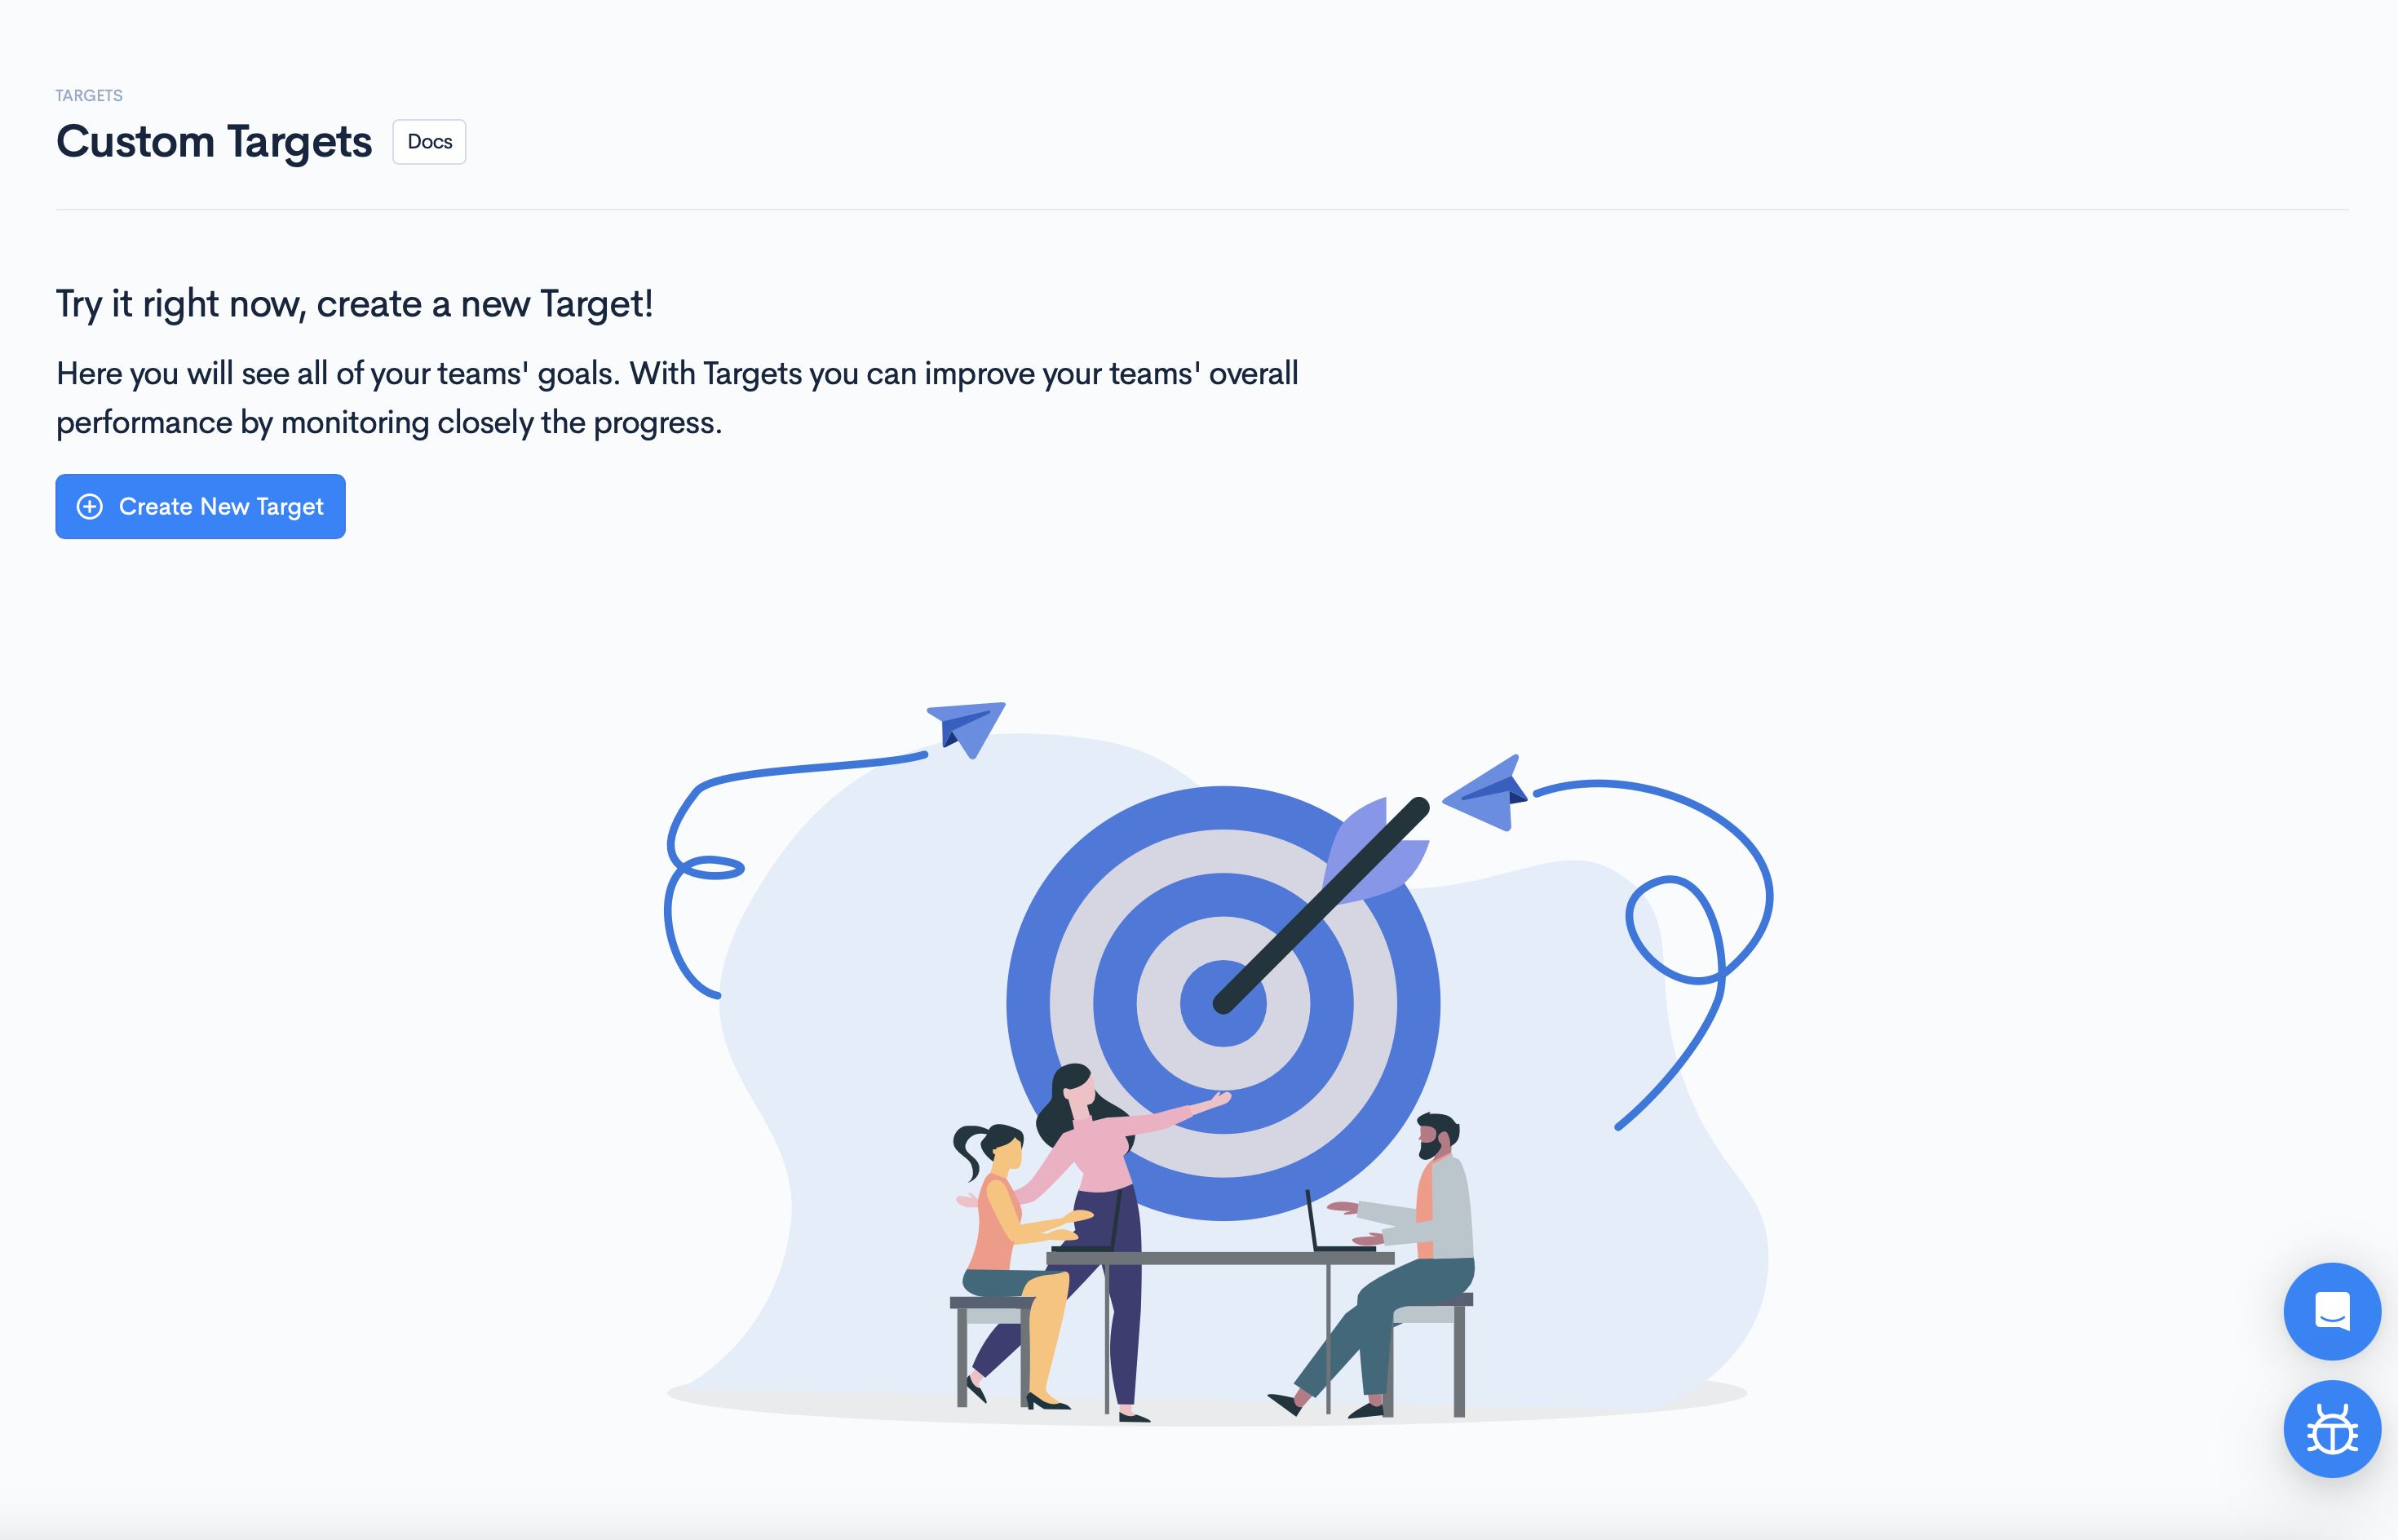
Click the Create New Target button to create a new target.
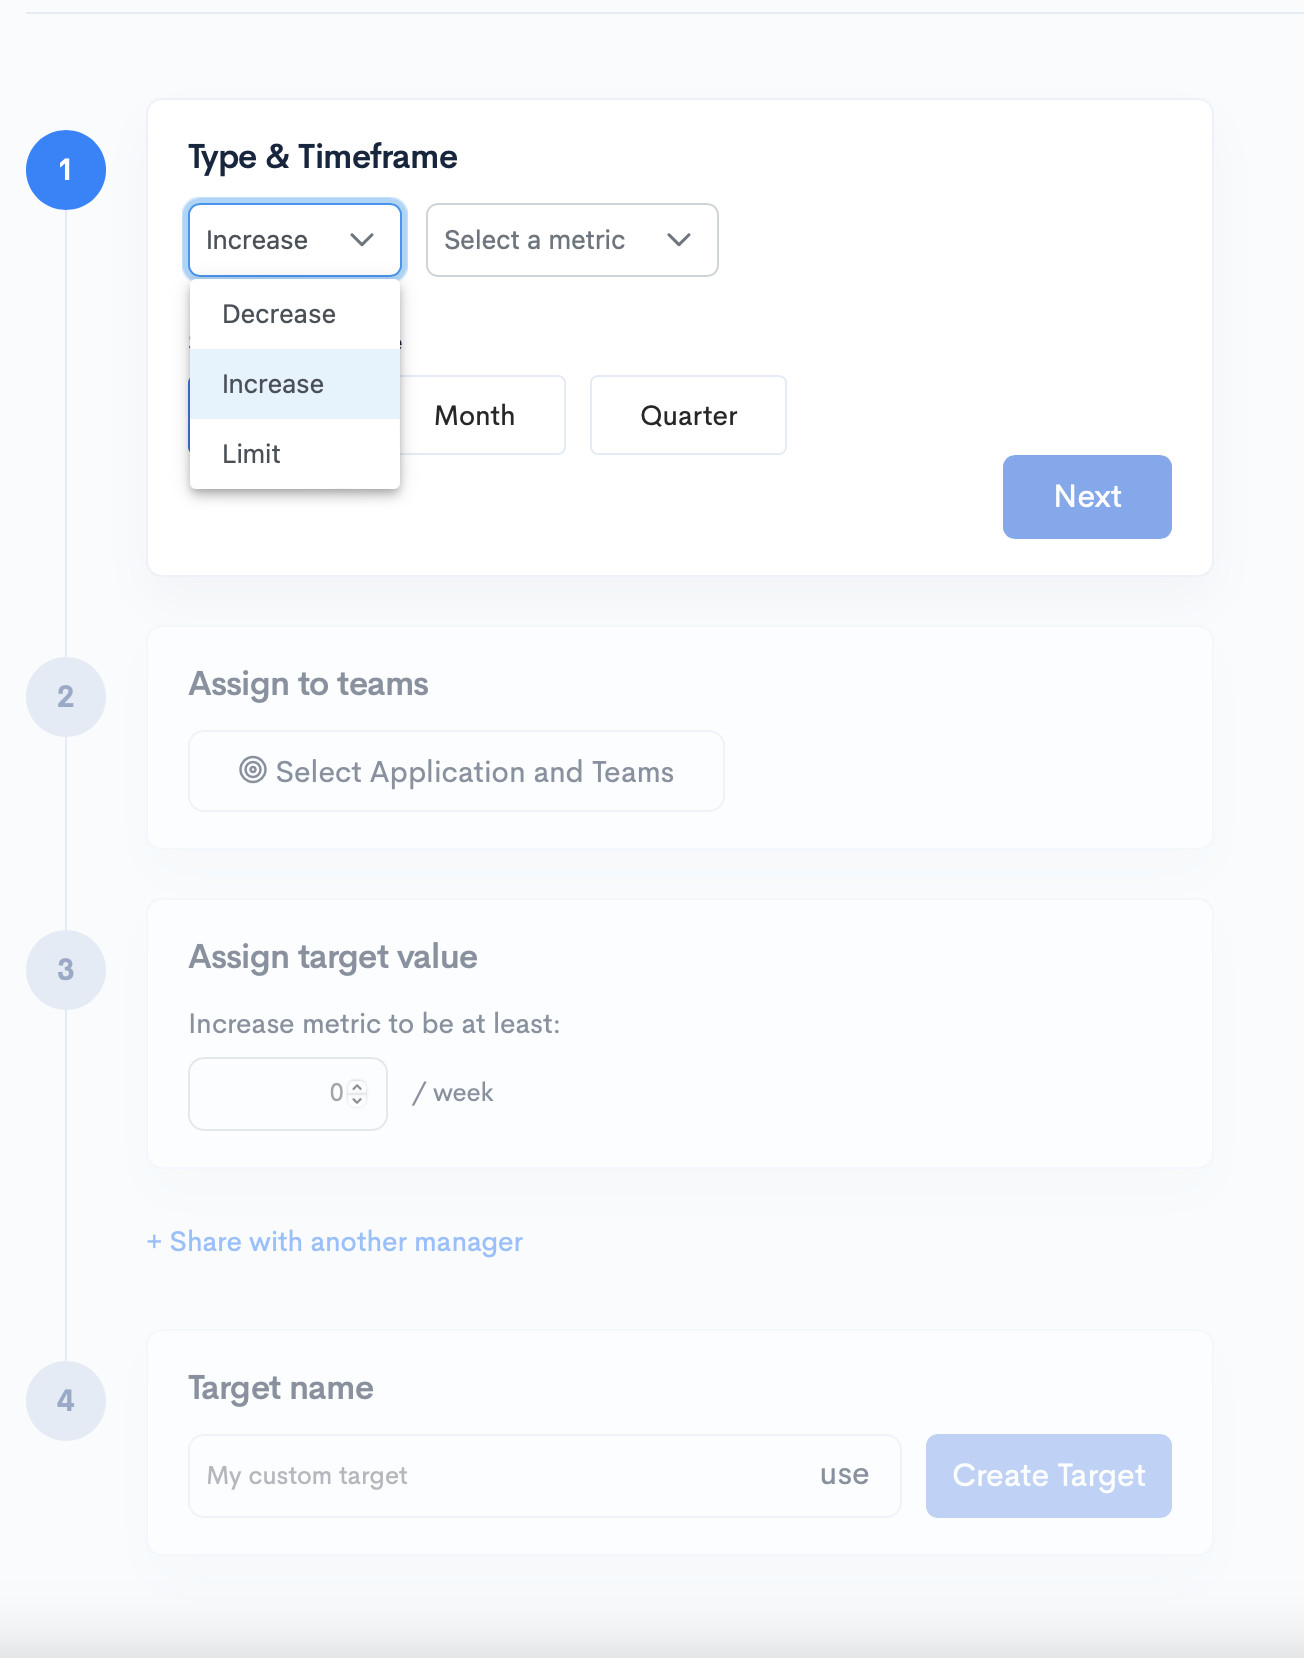
The first step you must complete is setting the Type & Timeframe.
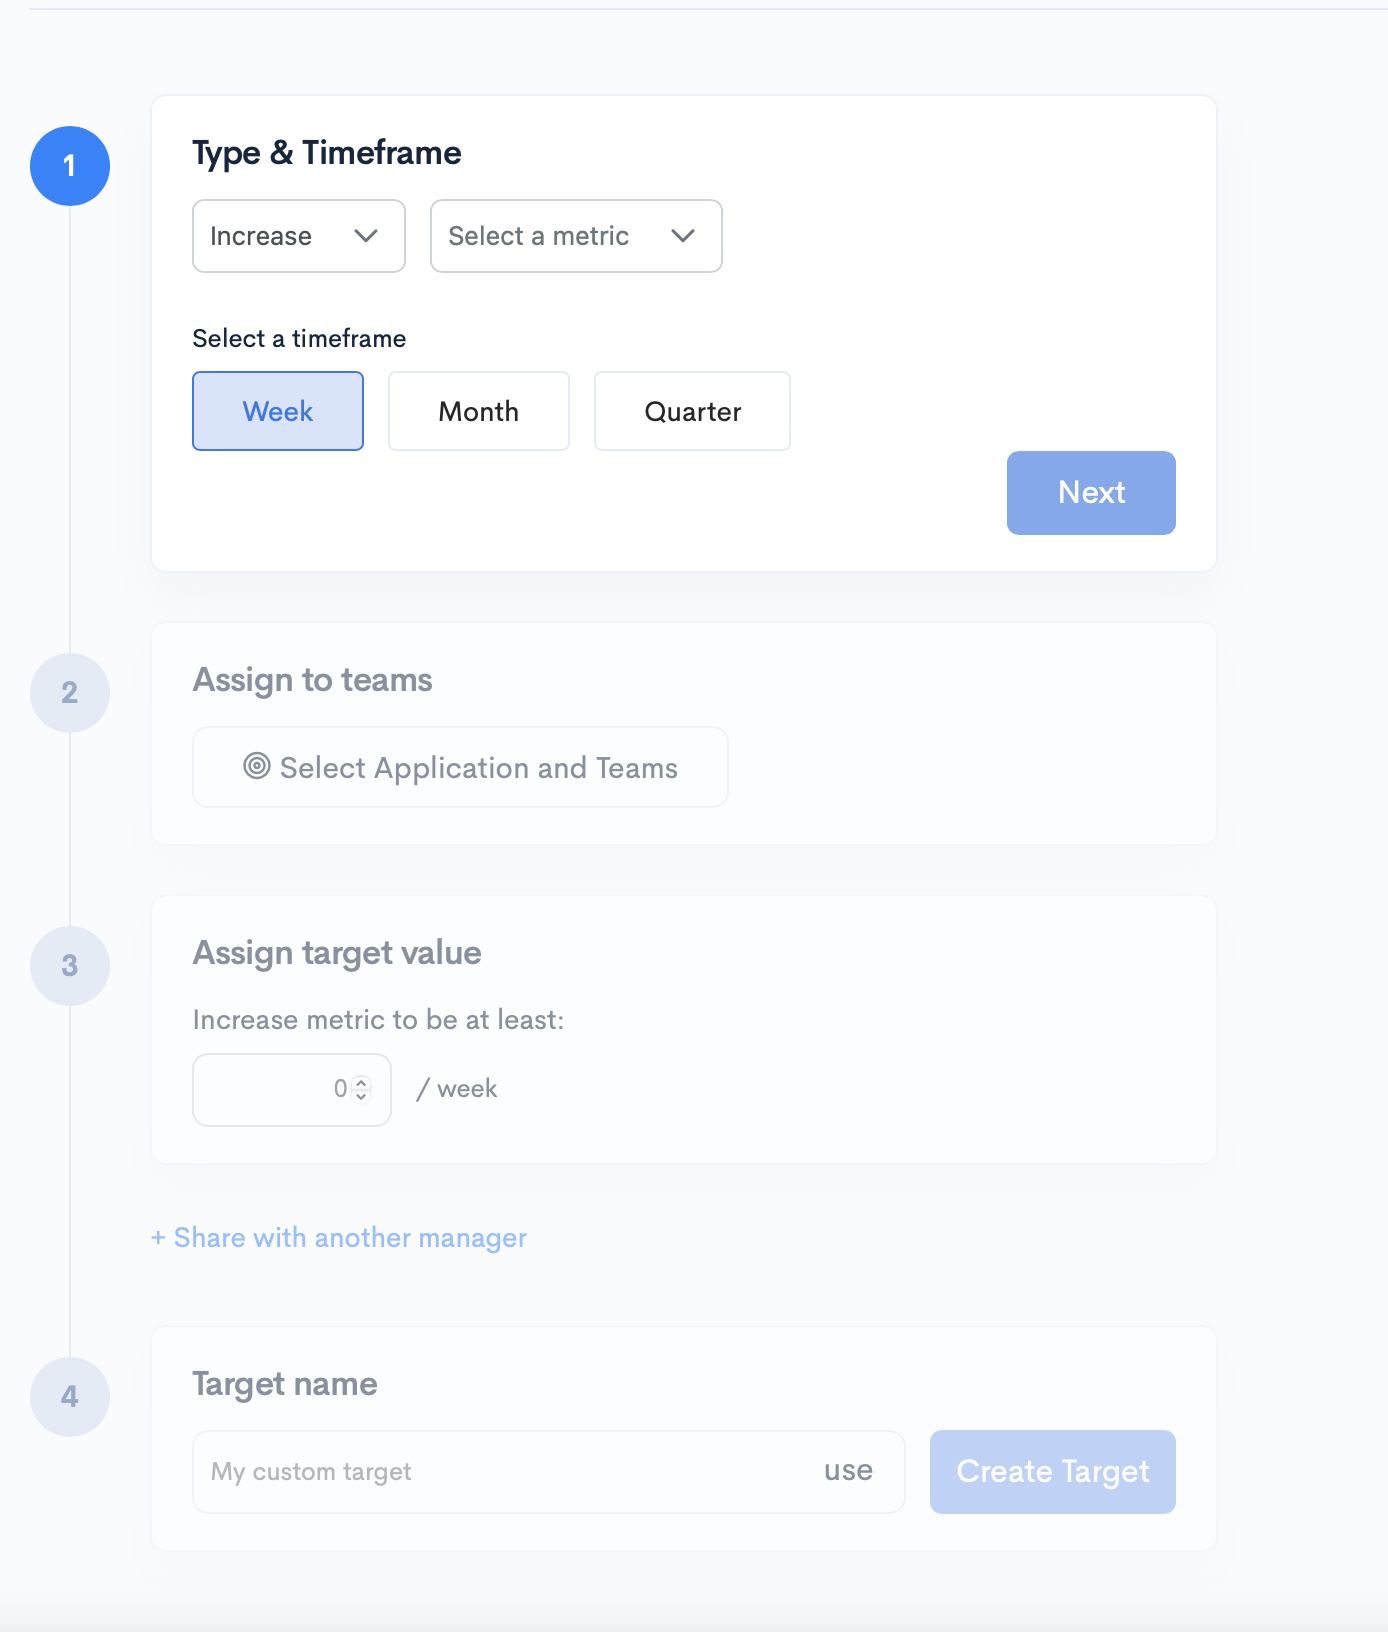
Here, you will have to select the following:
- The metric you want to set a target for;
- If you want this metric to be Increased, Decrease, or set a Limit;
- The timeframe you want to set this target for (week; month; quarter).
Once done, click Next.
Next up, you will have to select the Application and team/s you want to set this target for and click Apply. Once done, click Next.
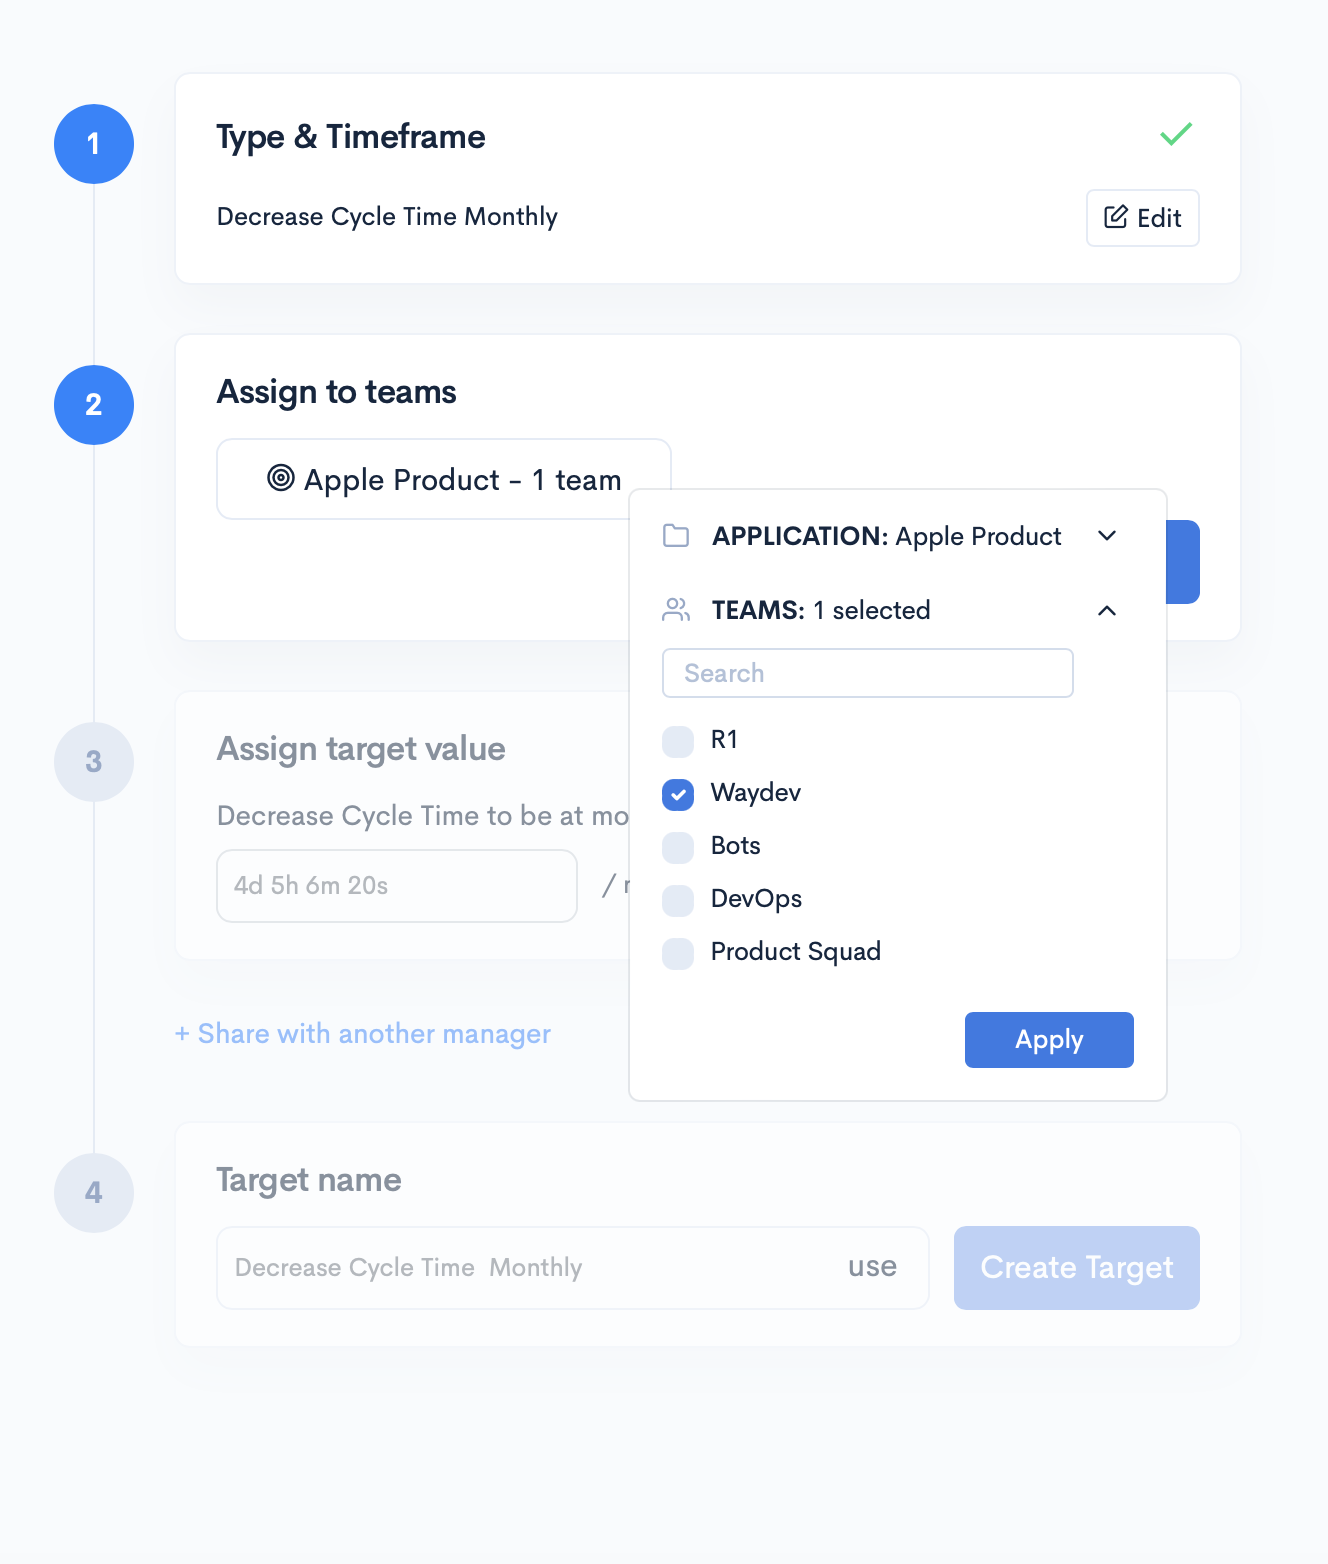
The next step is to Assign target value. In this step, you will also be able to see the average of the metric for the timeframe selected for the selected team.
For time-based metrics, specify the unit (e.g. 4d 5h 20m).
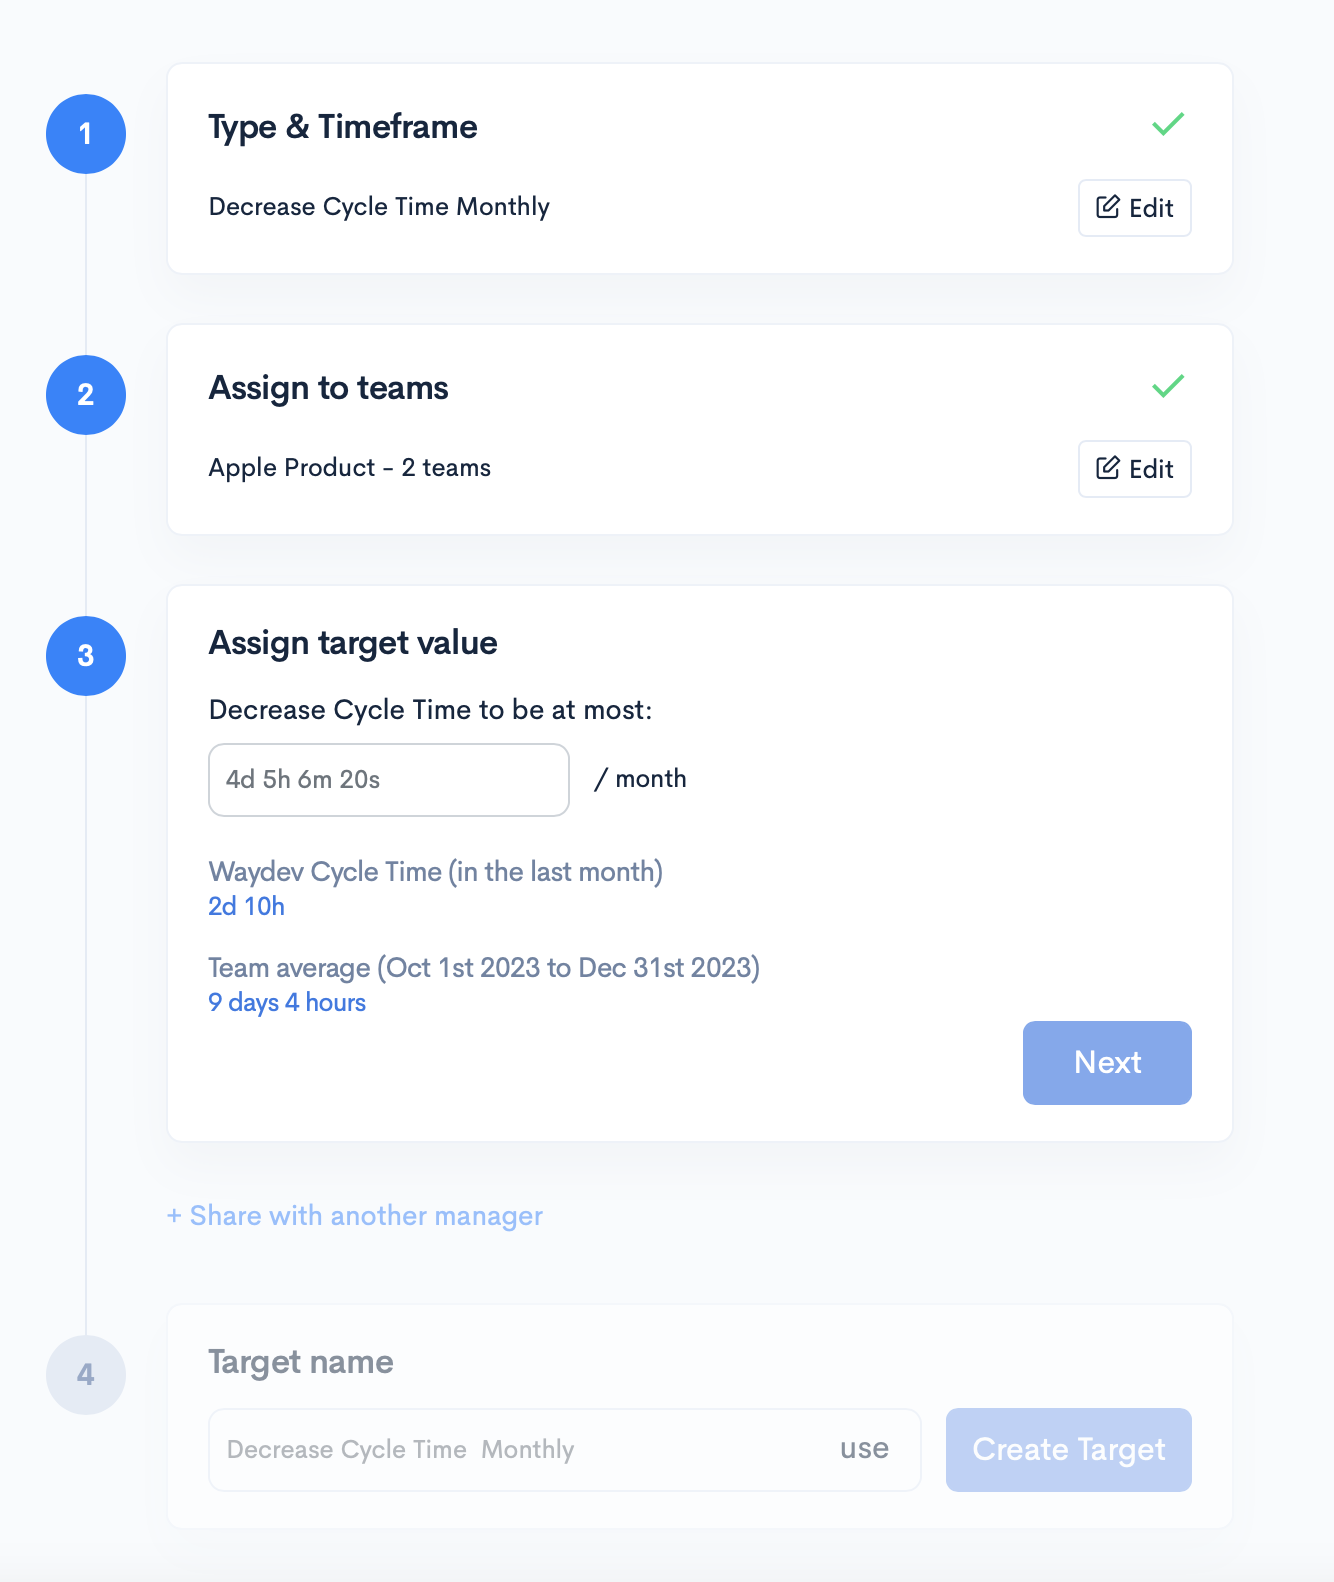
Once the value is selected, click Next.
You can share this target with other Waydev users by clicking the Share with another manager button. Type in their email and once selected, click Next.
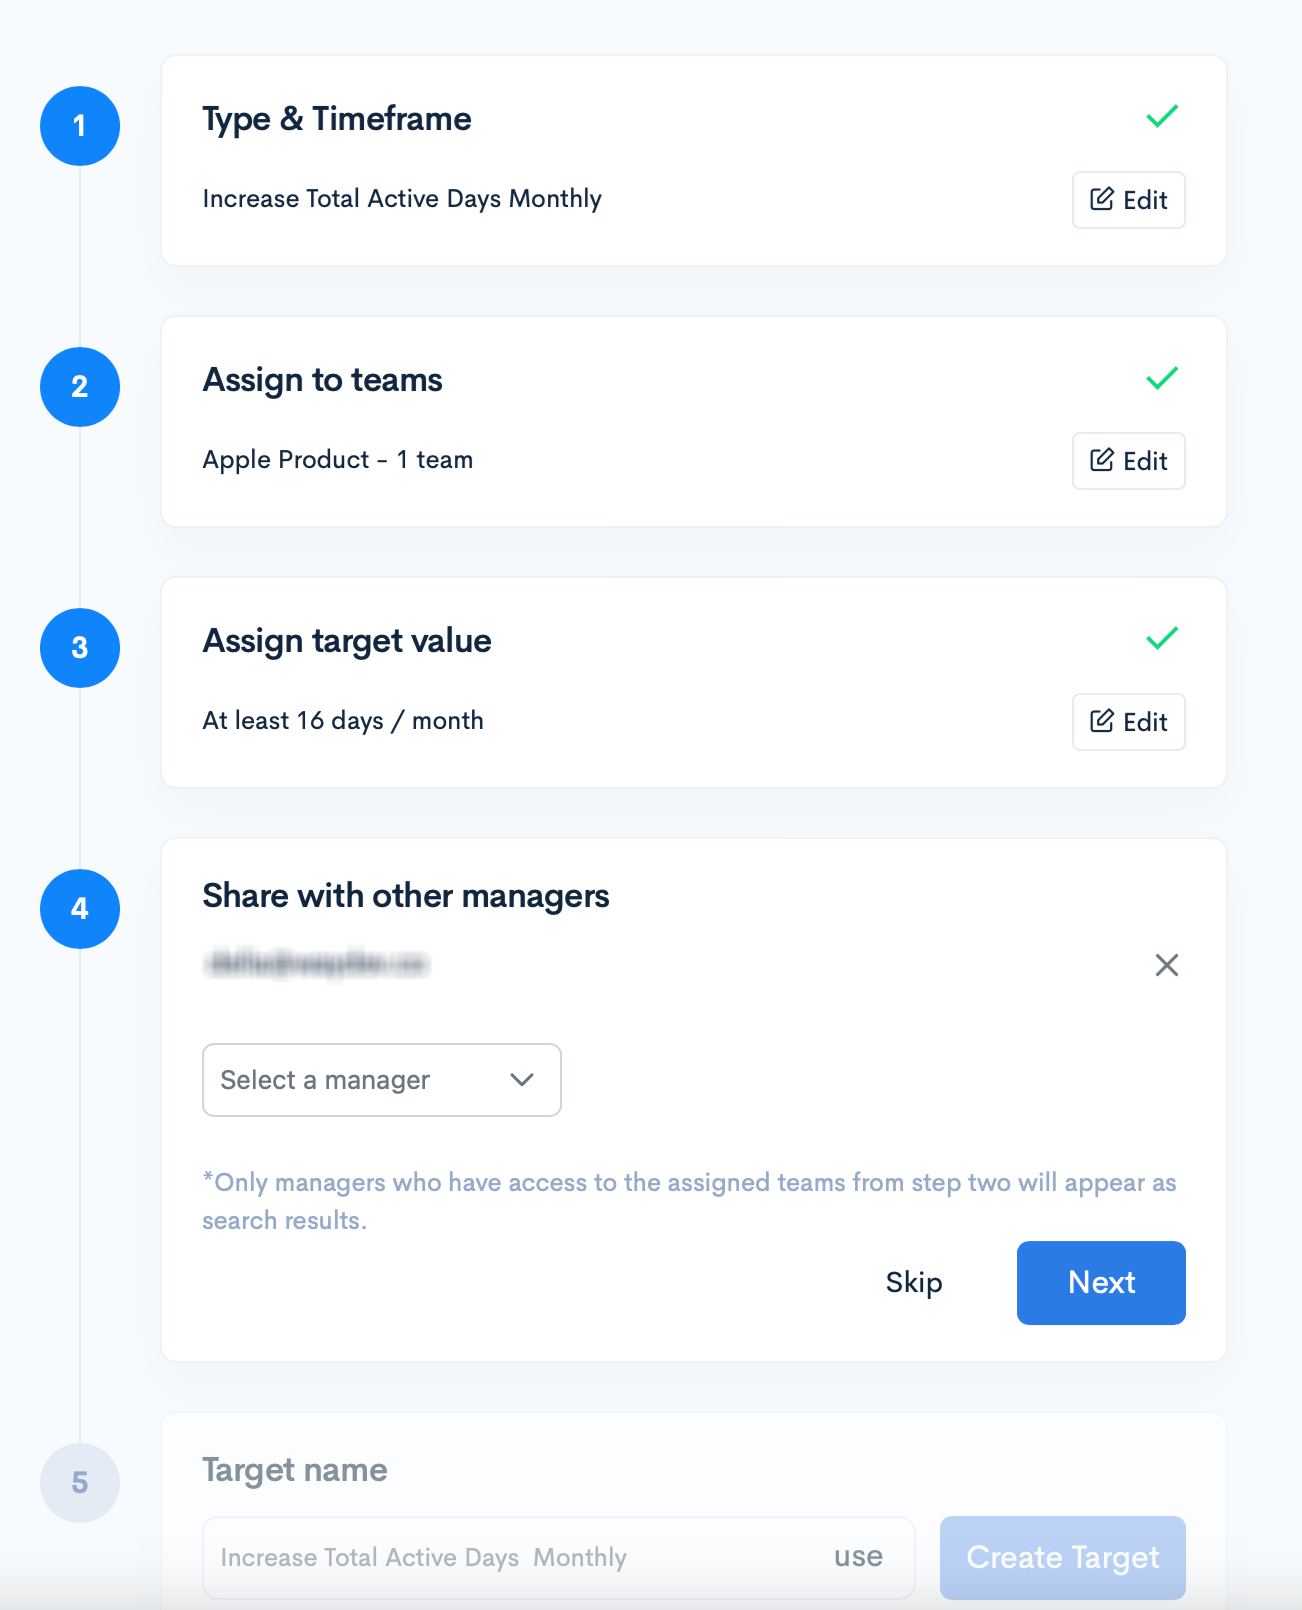
Lastly, select a name for the target you just created. To use the one Waydev suggested, click Use.
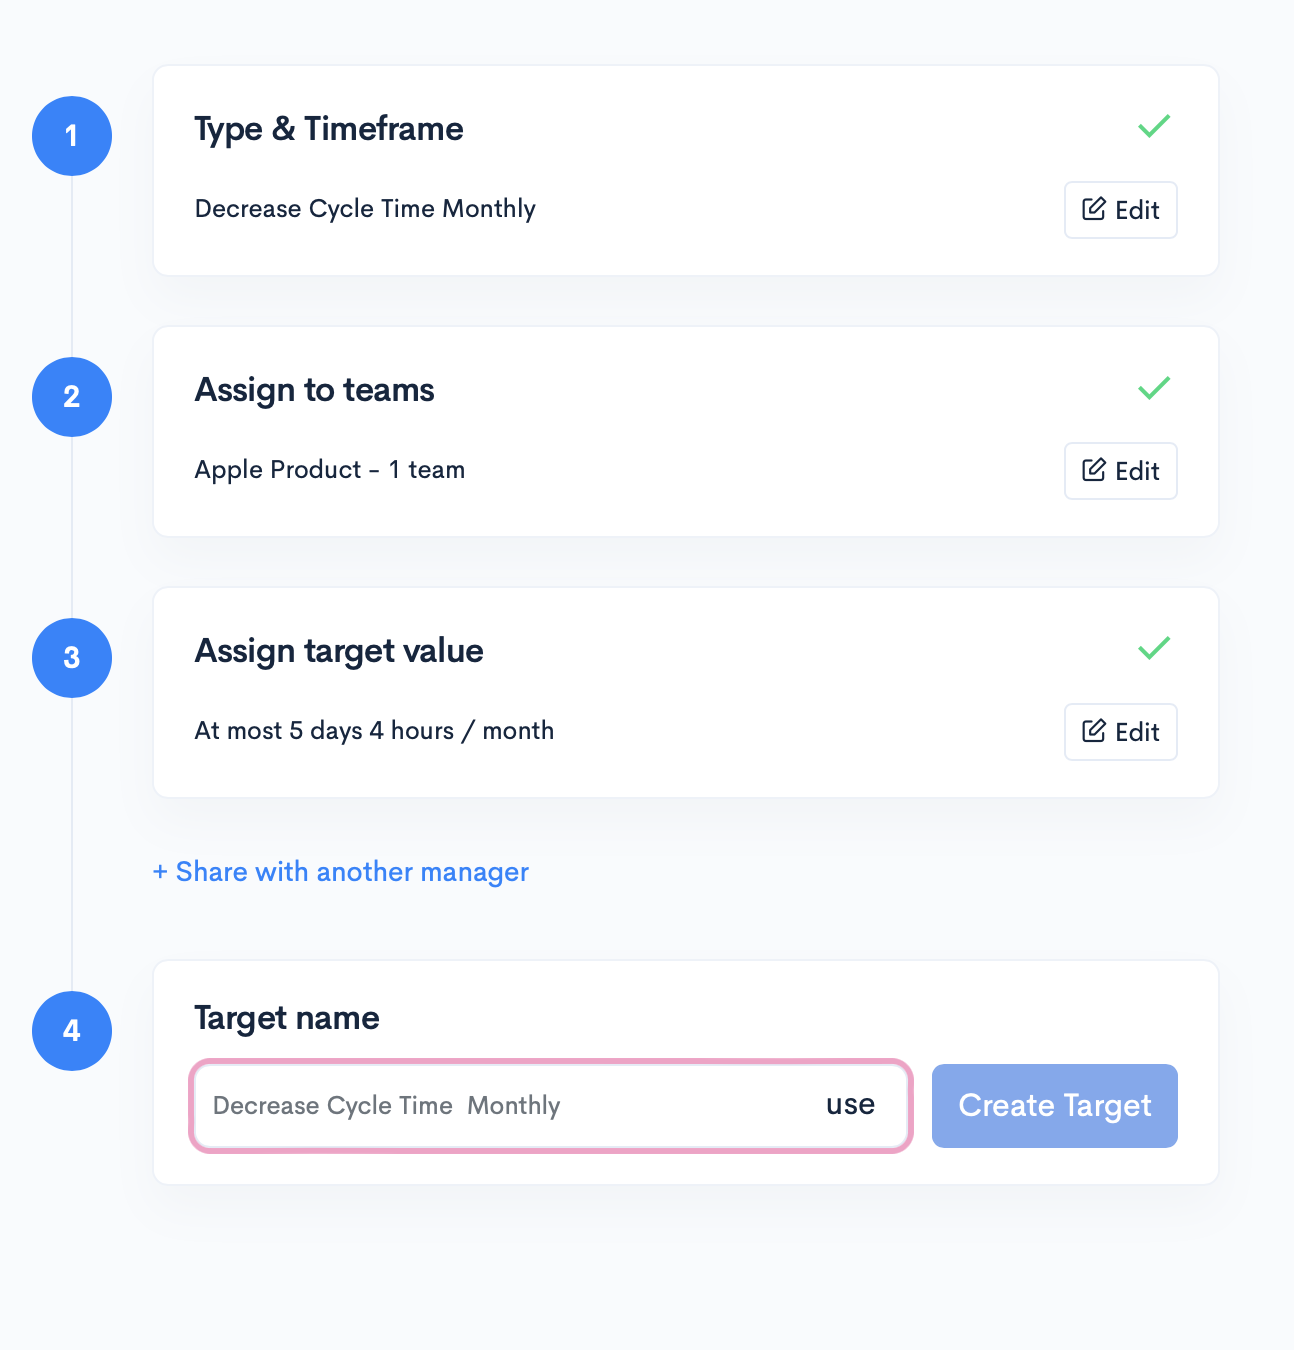
Once done, click Create Target.
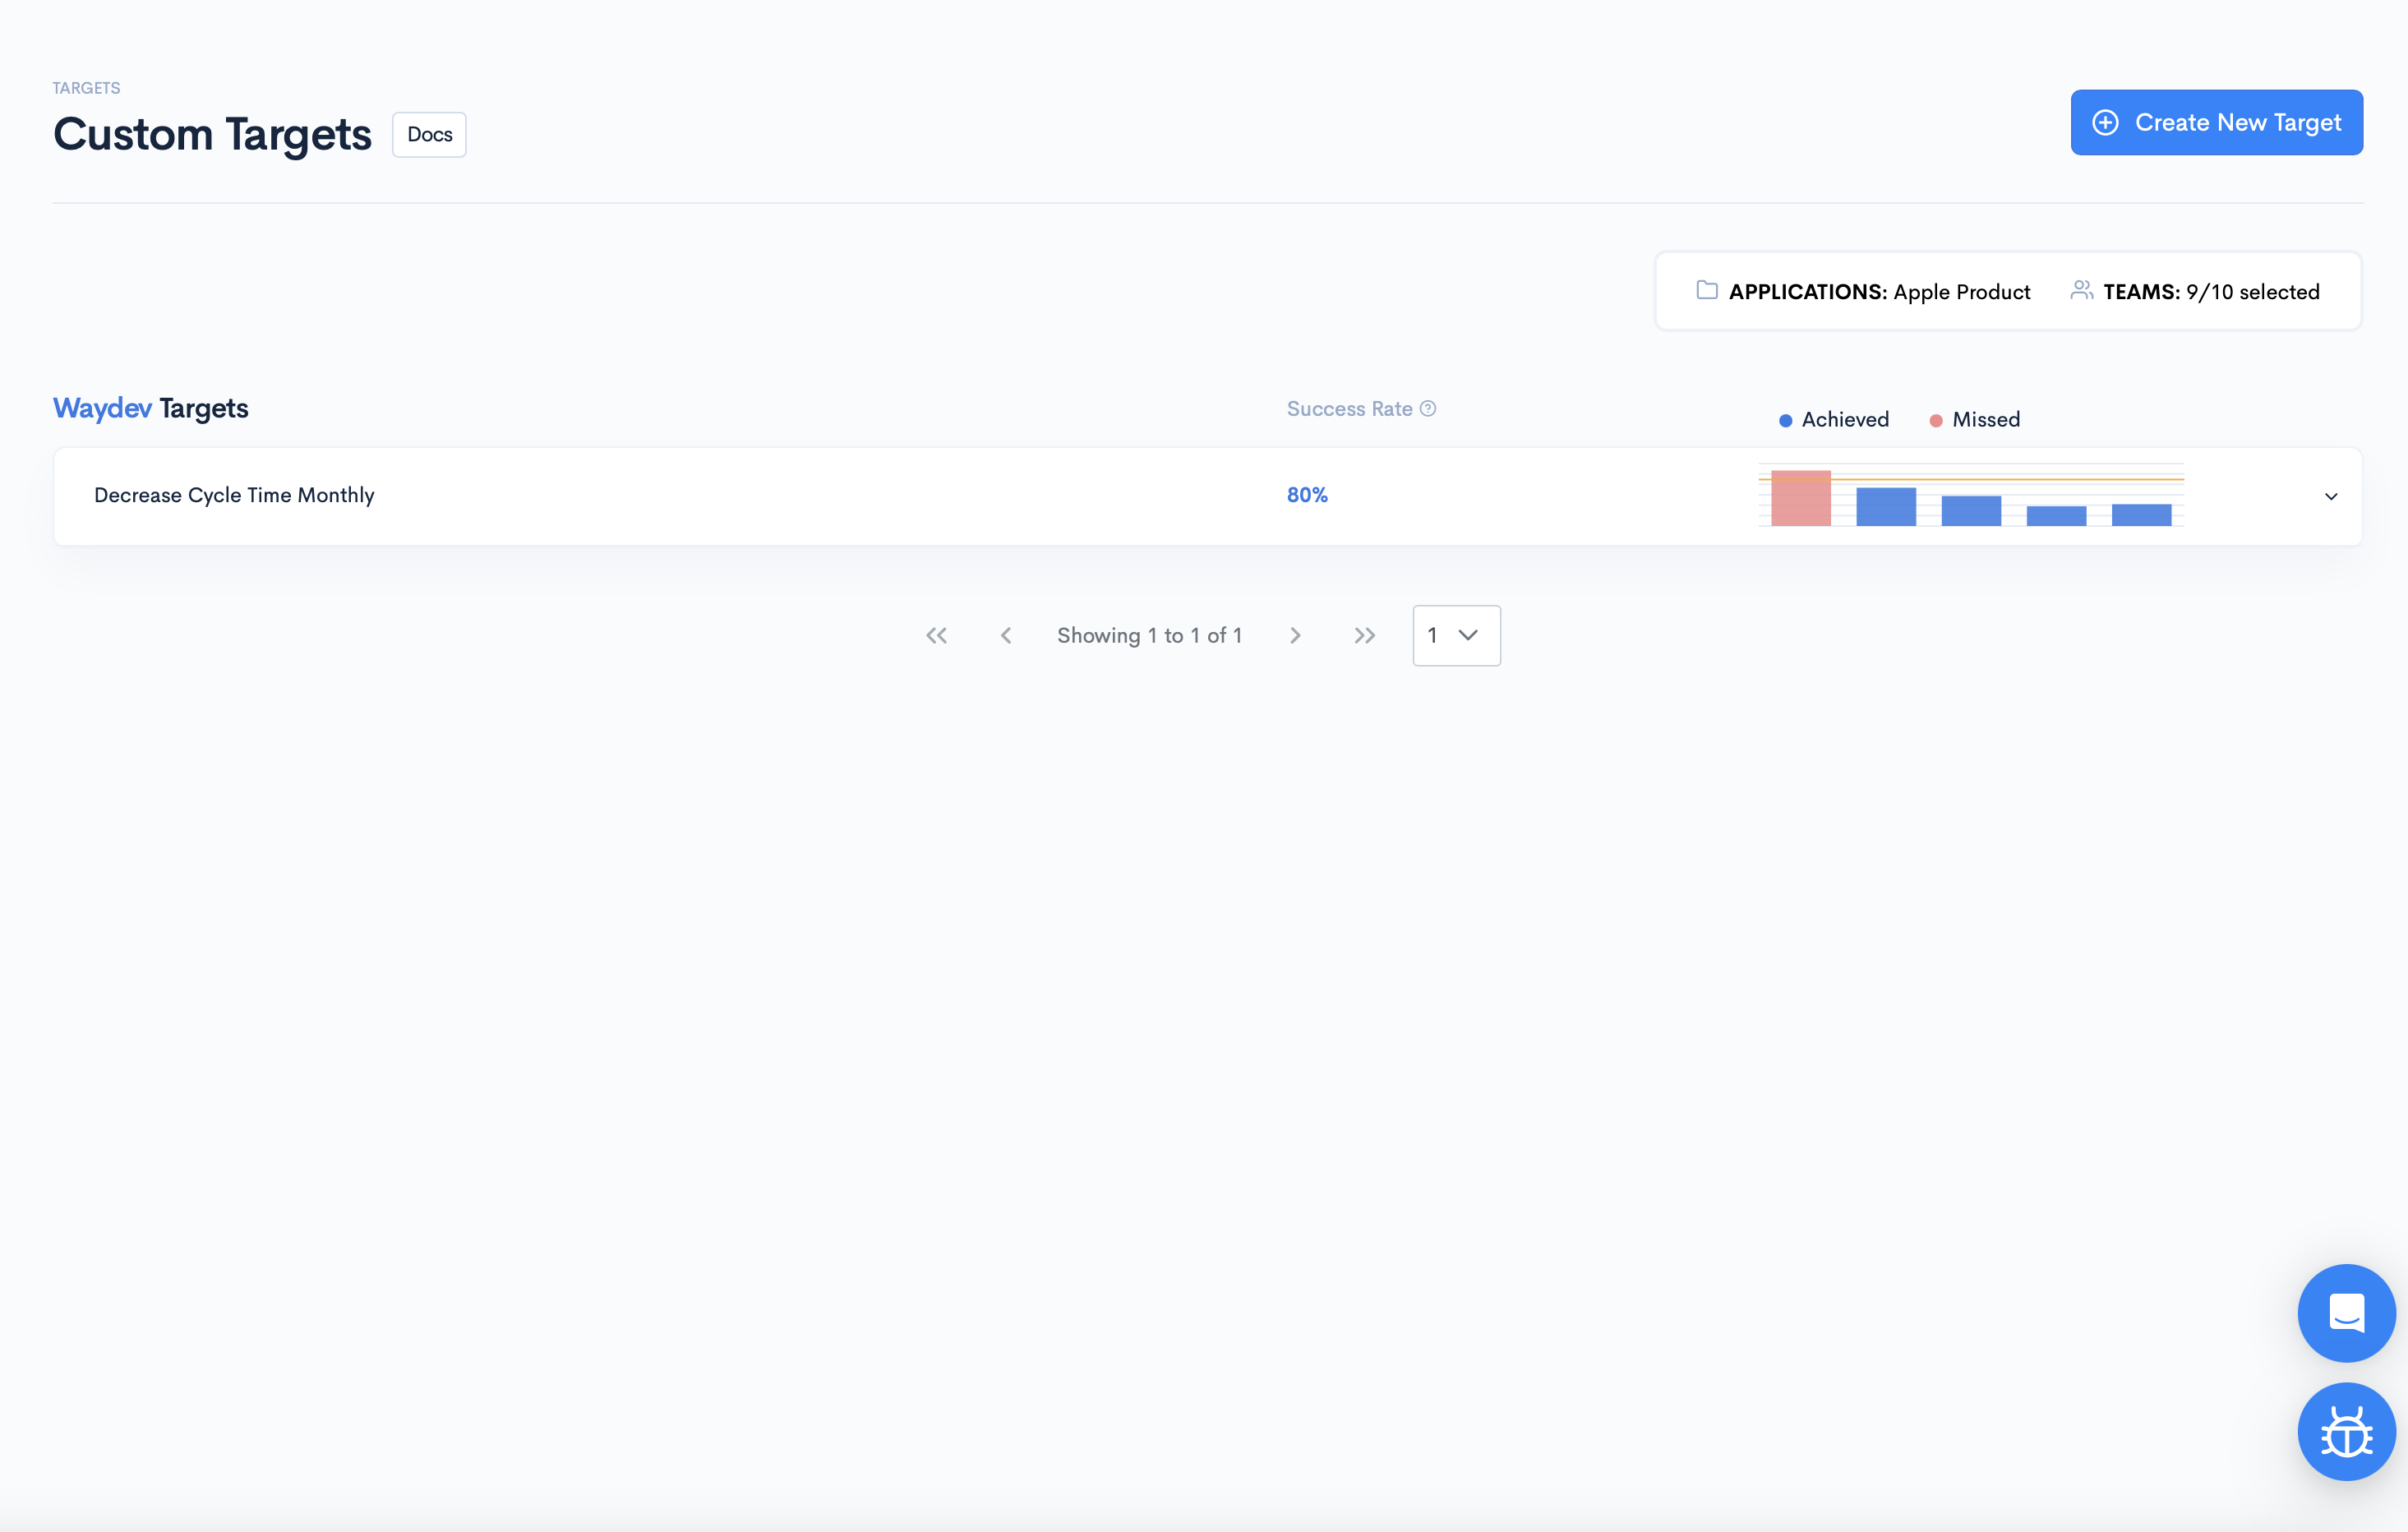
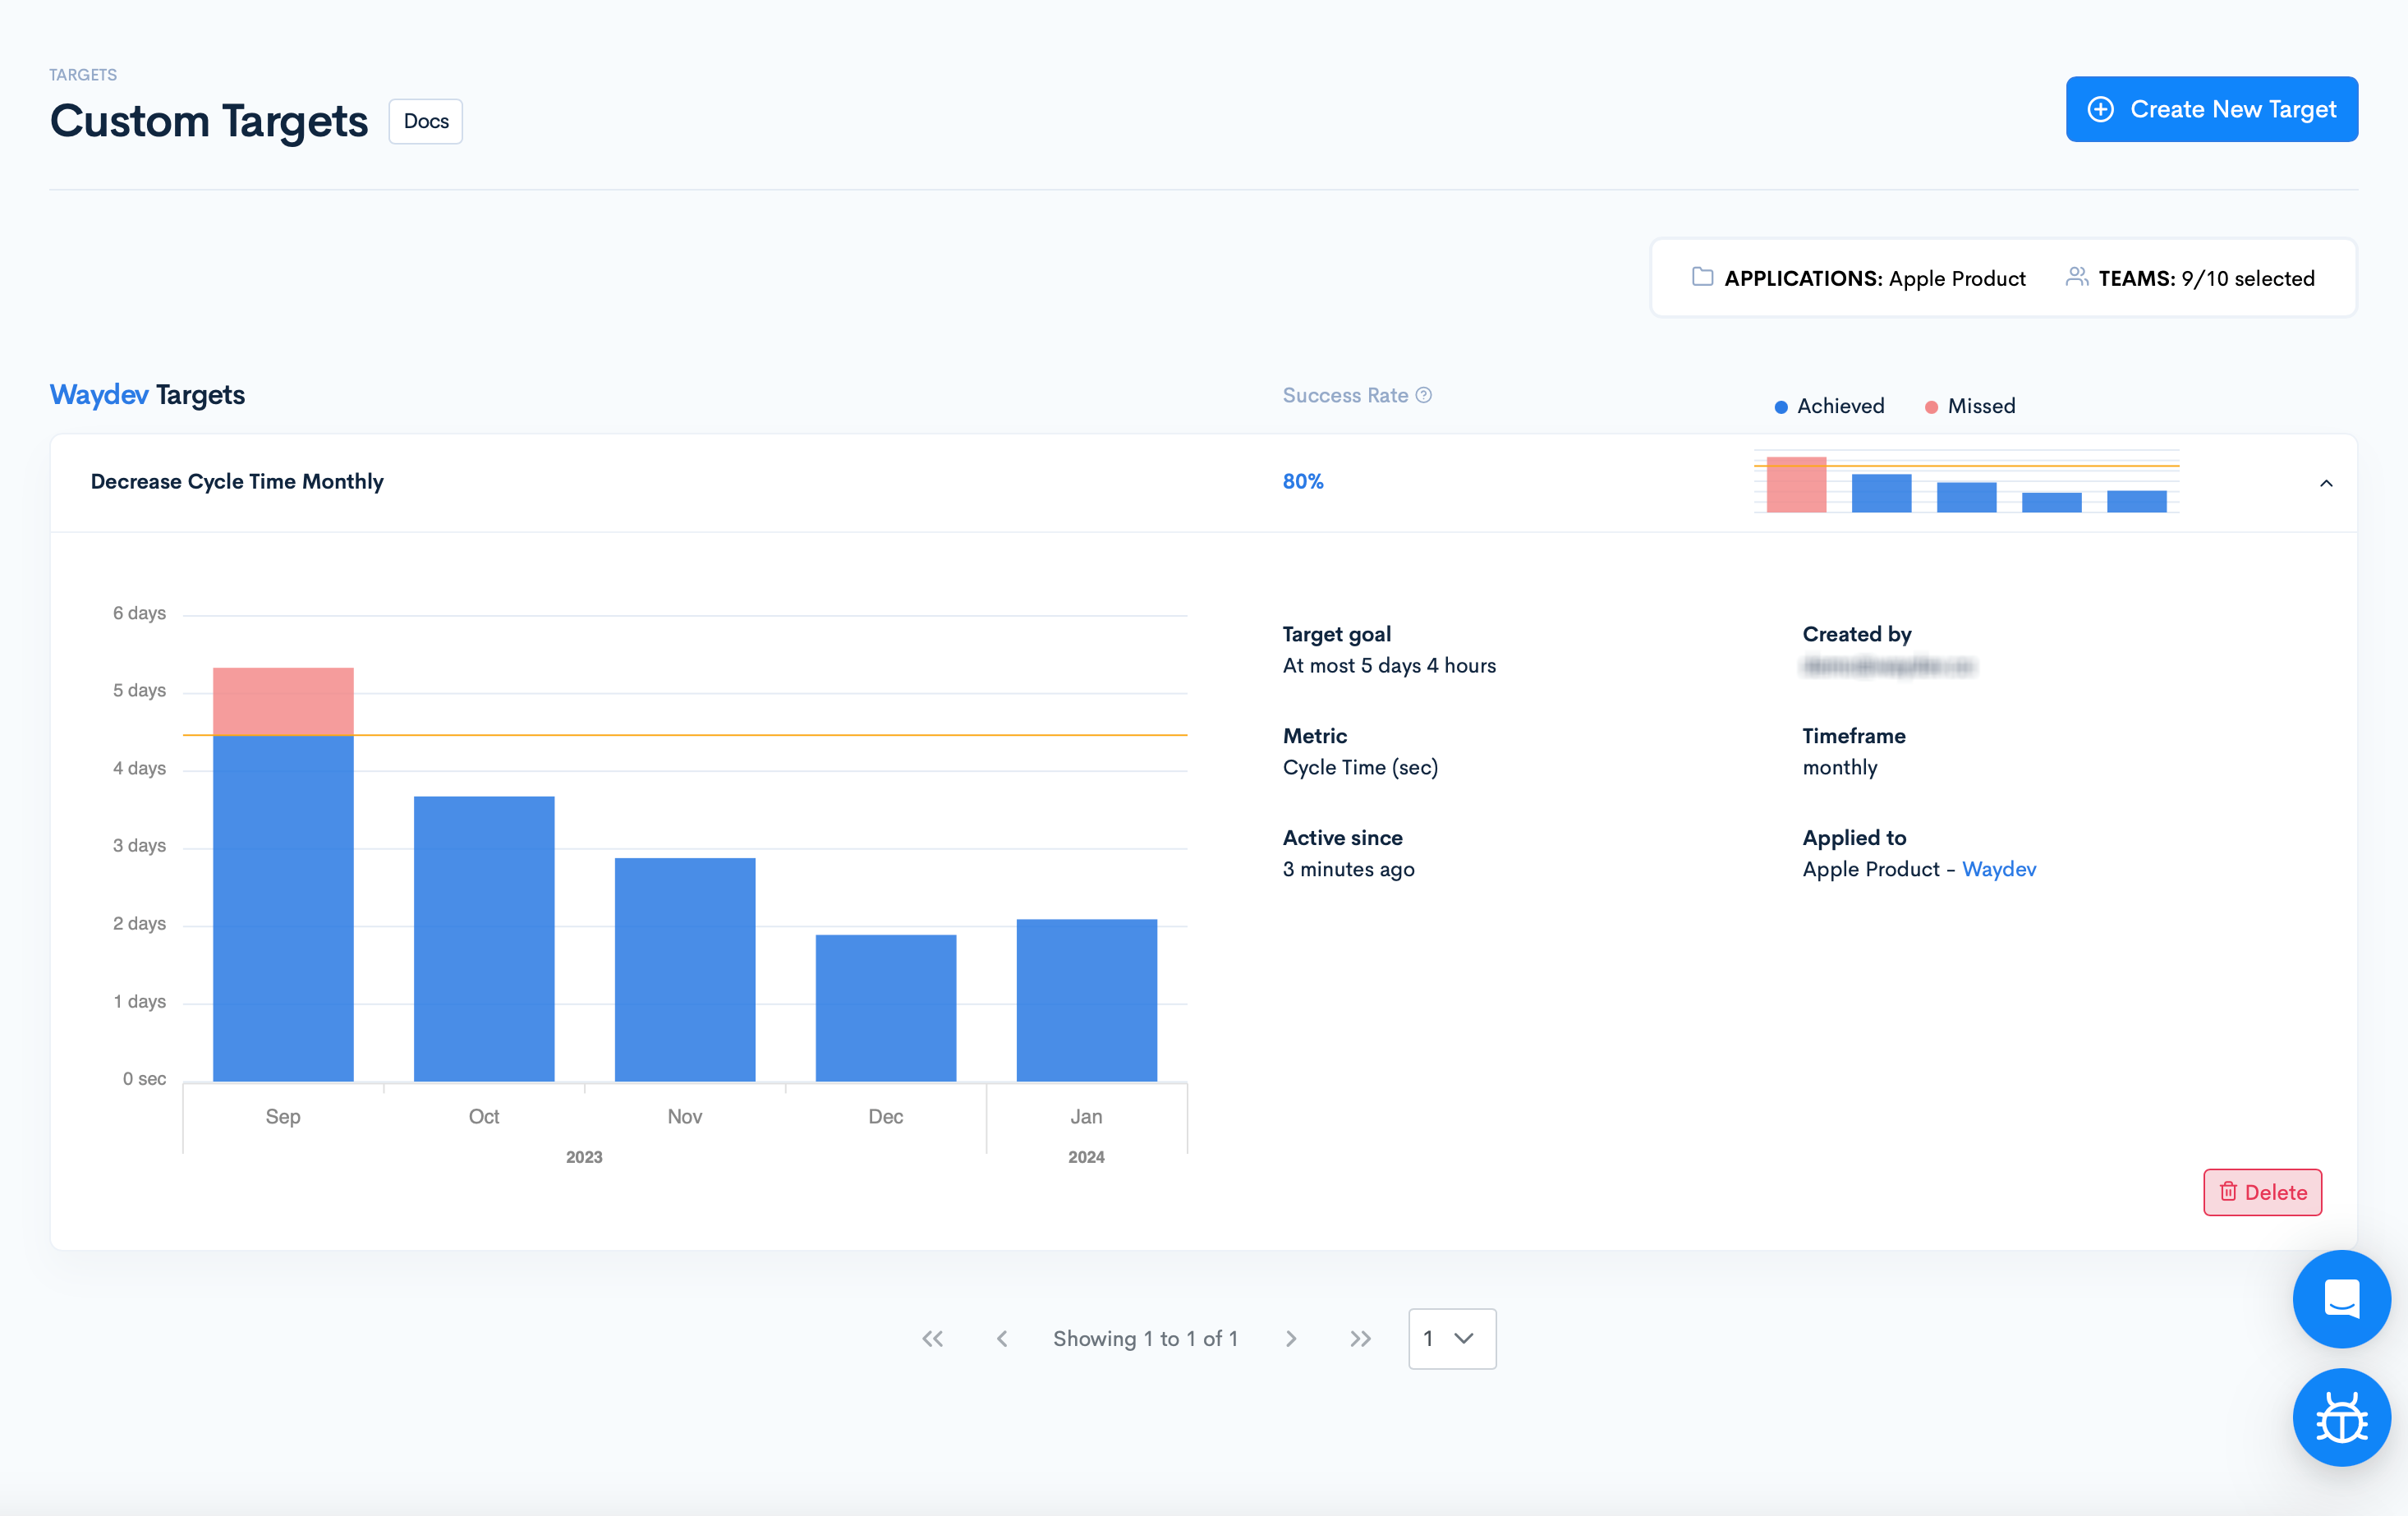
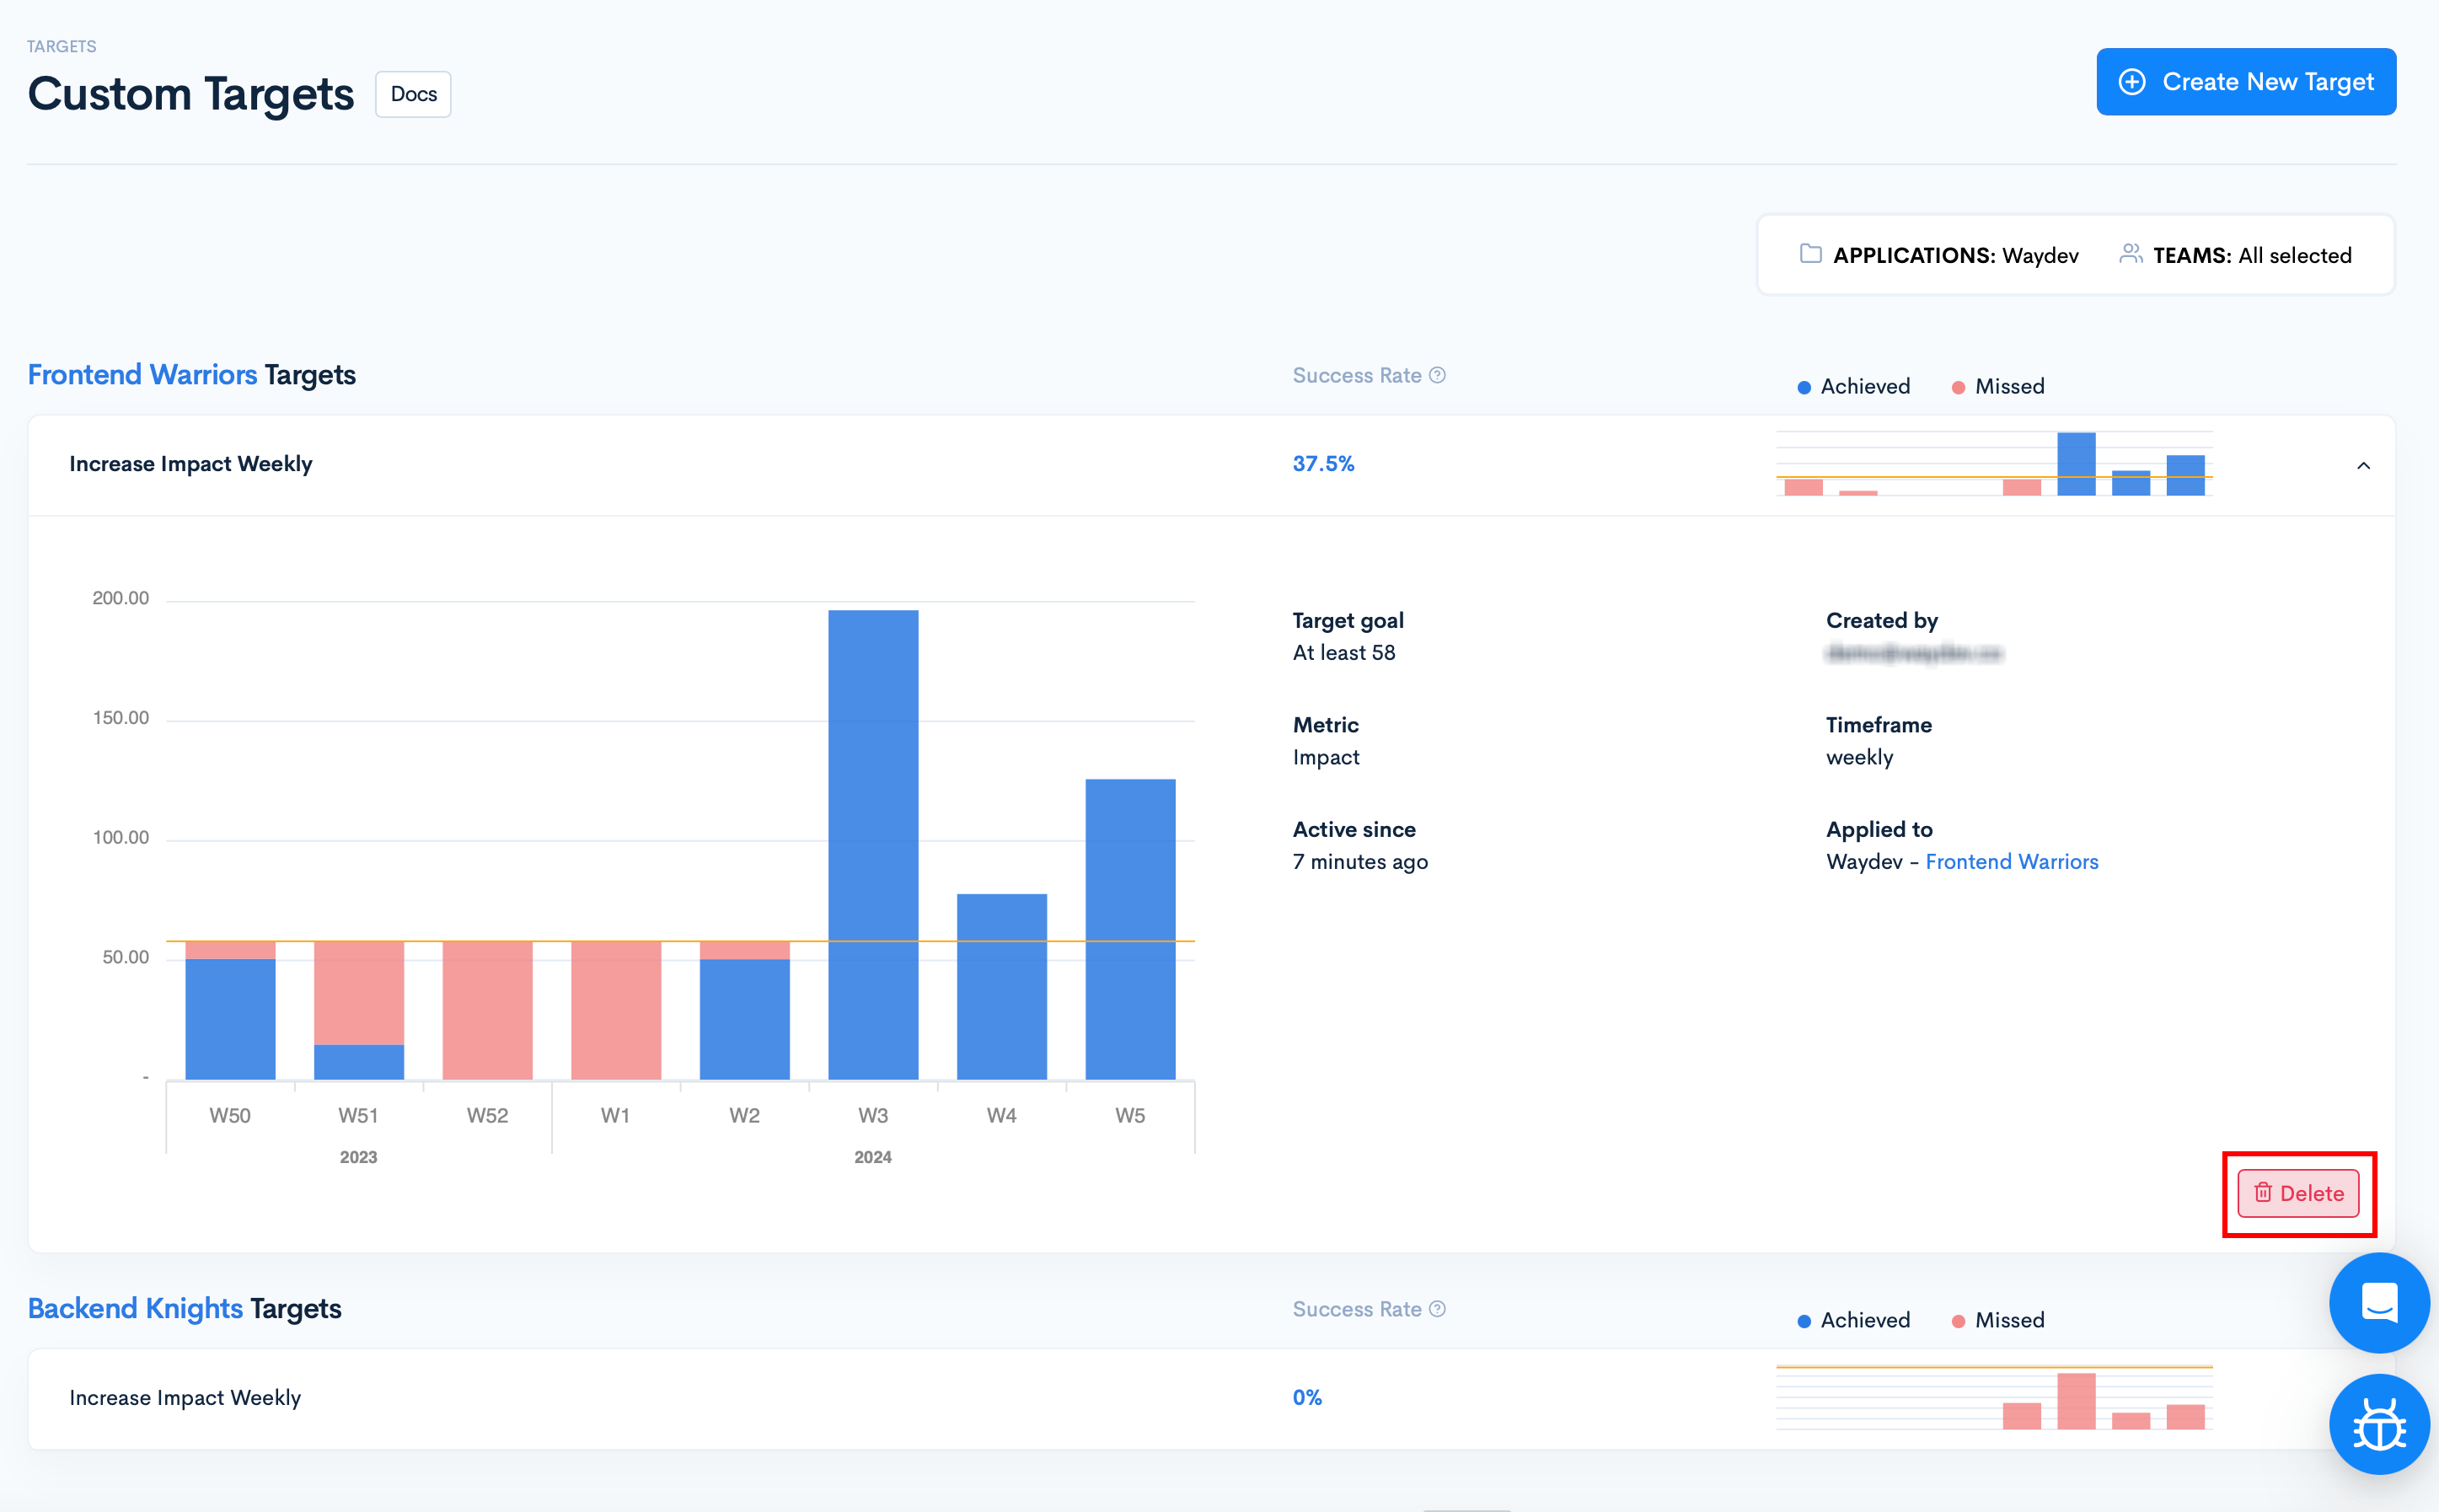
Once created, find the target on the team's Targets page, displaying the success rate and a graph showing past achievement over weeks/months/quarters.
The Success Rate reflects how often has been achieved in the past.
Click a target to view the following details:
- The target goal
- The selected metric
- Since when it was active
- The user that created the target
- The timeframe
- The team which it is applied to
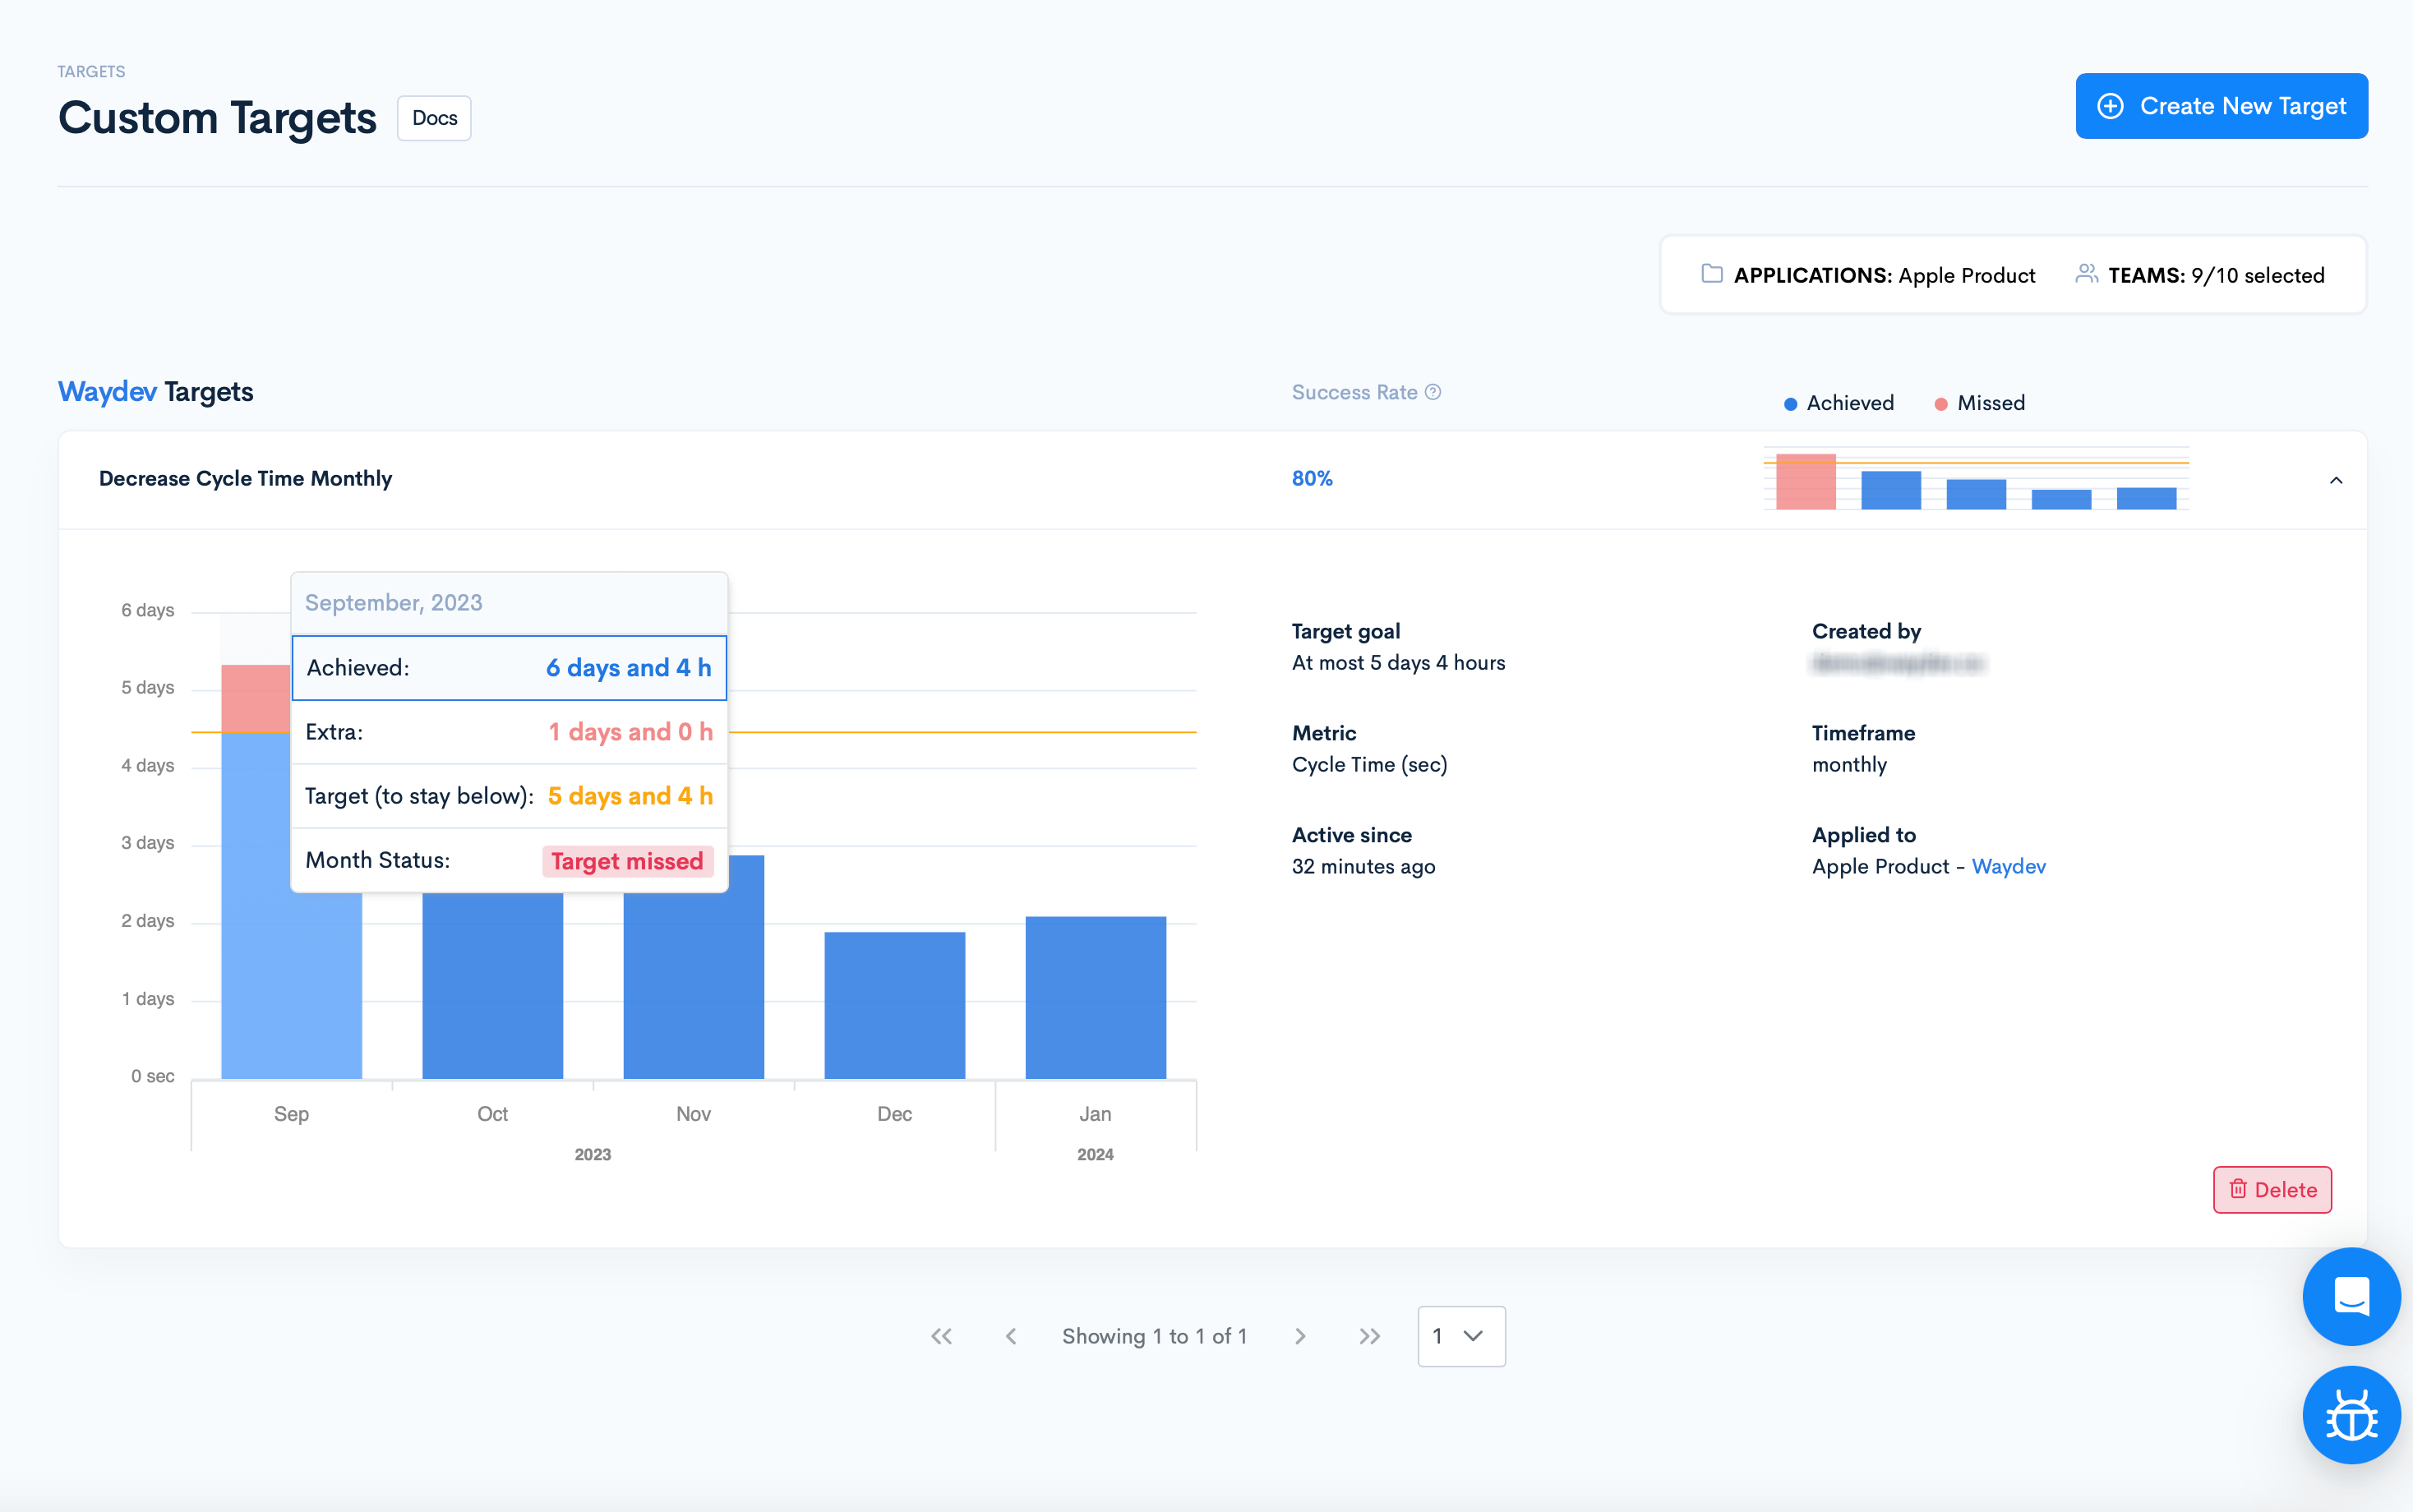
- A graph illustrating how this target has been achieved in the past, highlighting in red the months/weeks/quarters in which the teams haven't reached this goal you set.
Hover over the graph bars to view past performance, including whether targets were met or missed and by how much.
Deleting a target
Navigate to Custom Targets in the Benchmarking section.
Select the target you want to delete by clicking on it, then click the Delete button.
Updated 5 months ago