

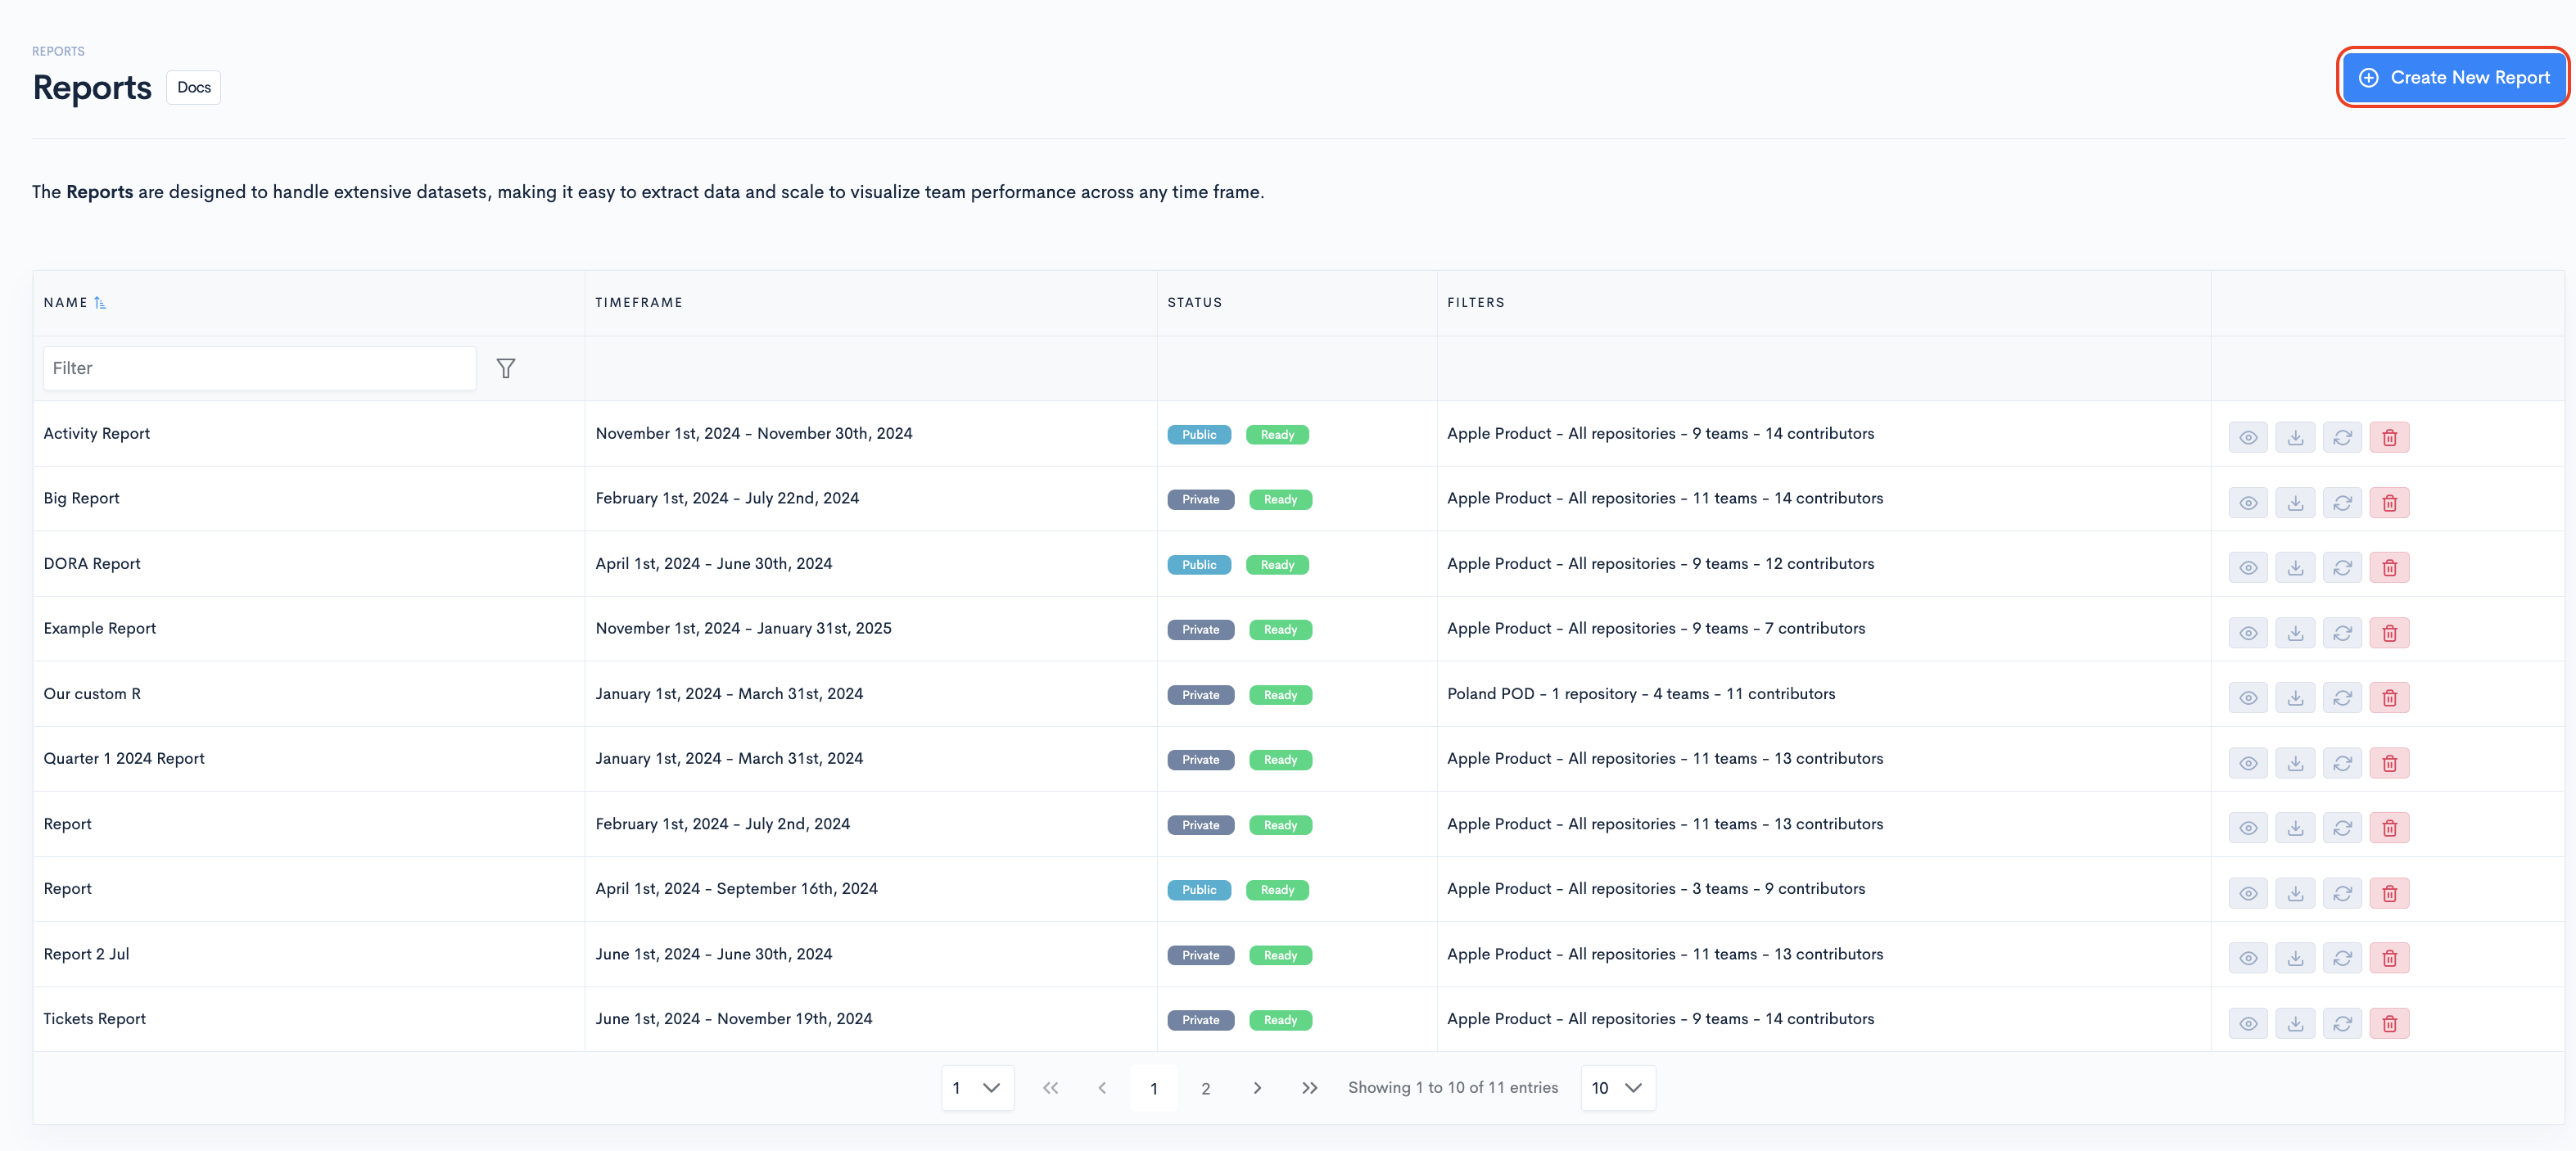
Custom Reports
The Reports feature enables the creation of custom, complex reports using any Waydev metric. Designed for extensive datasets, it offers scalability for in-depth analysis of engineering performance
To navigate to this feature, click Studio in the side-bar menu and open the Reports.
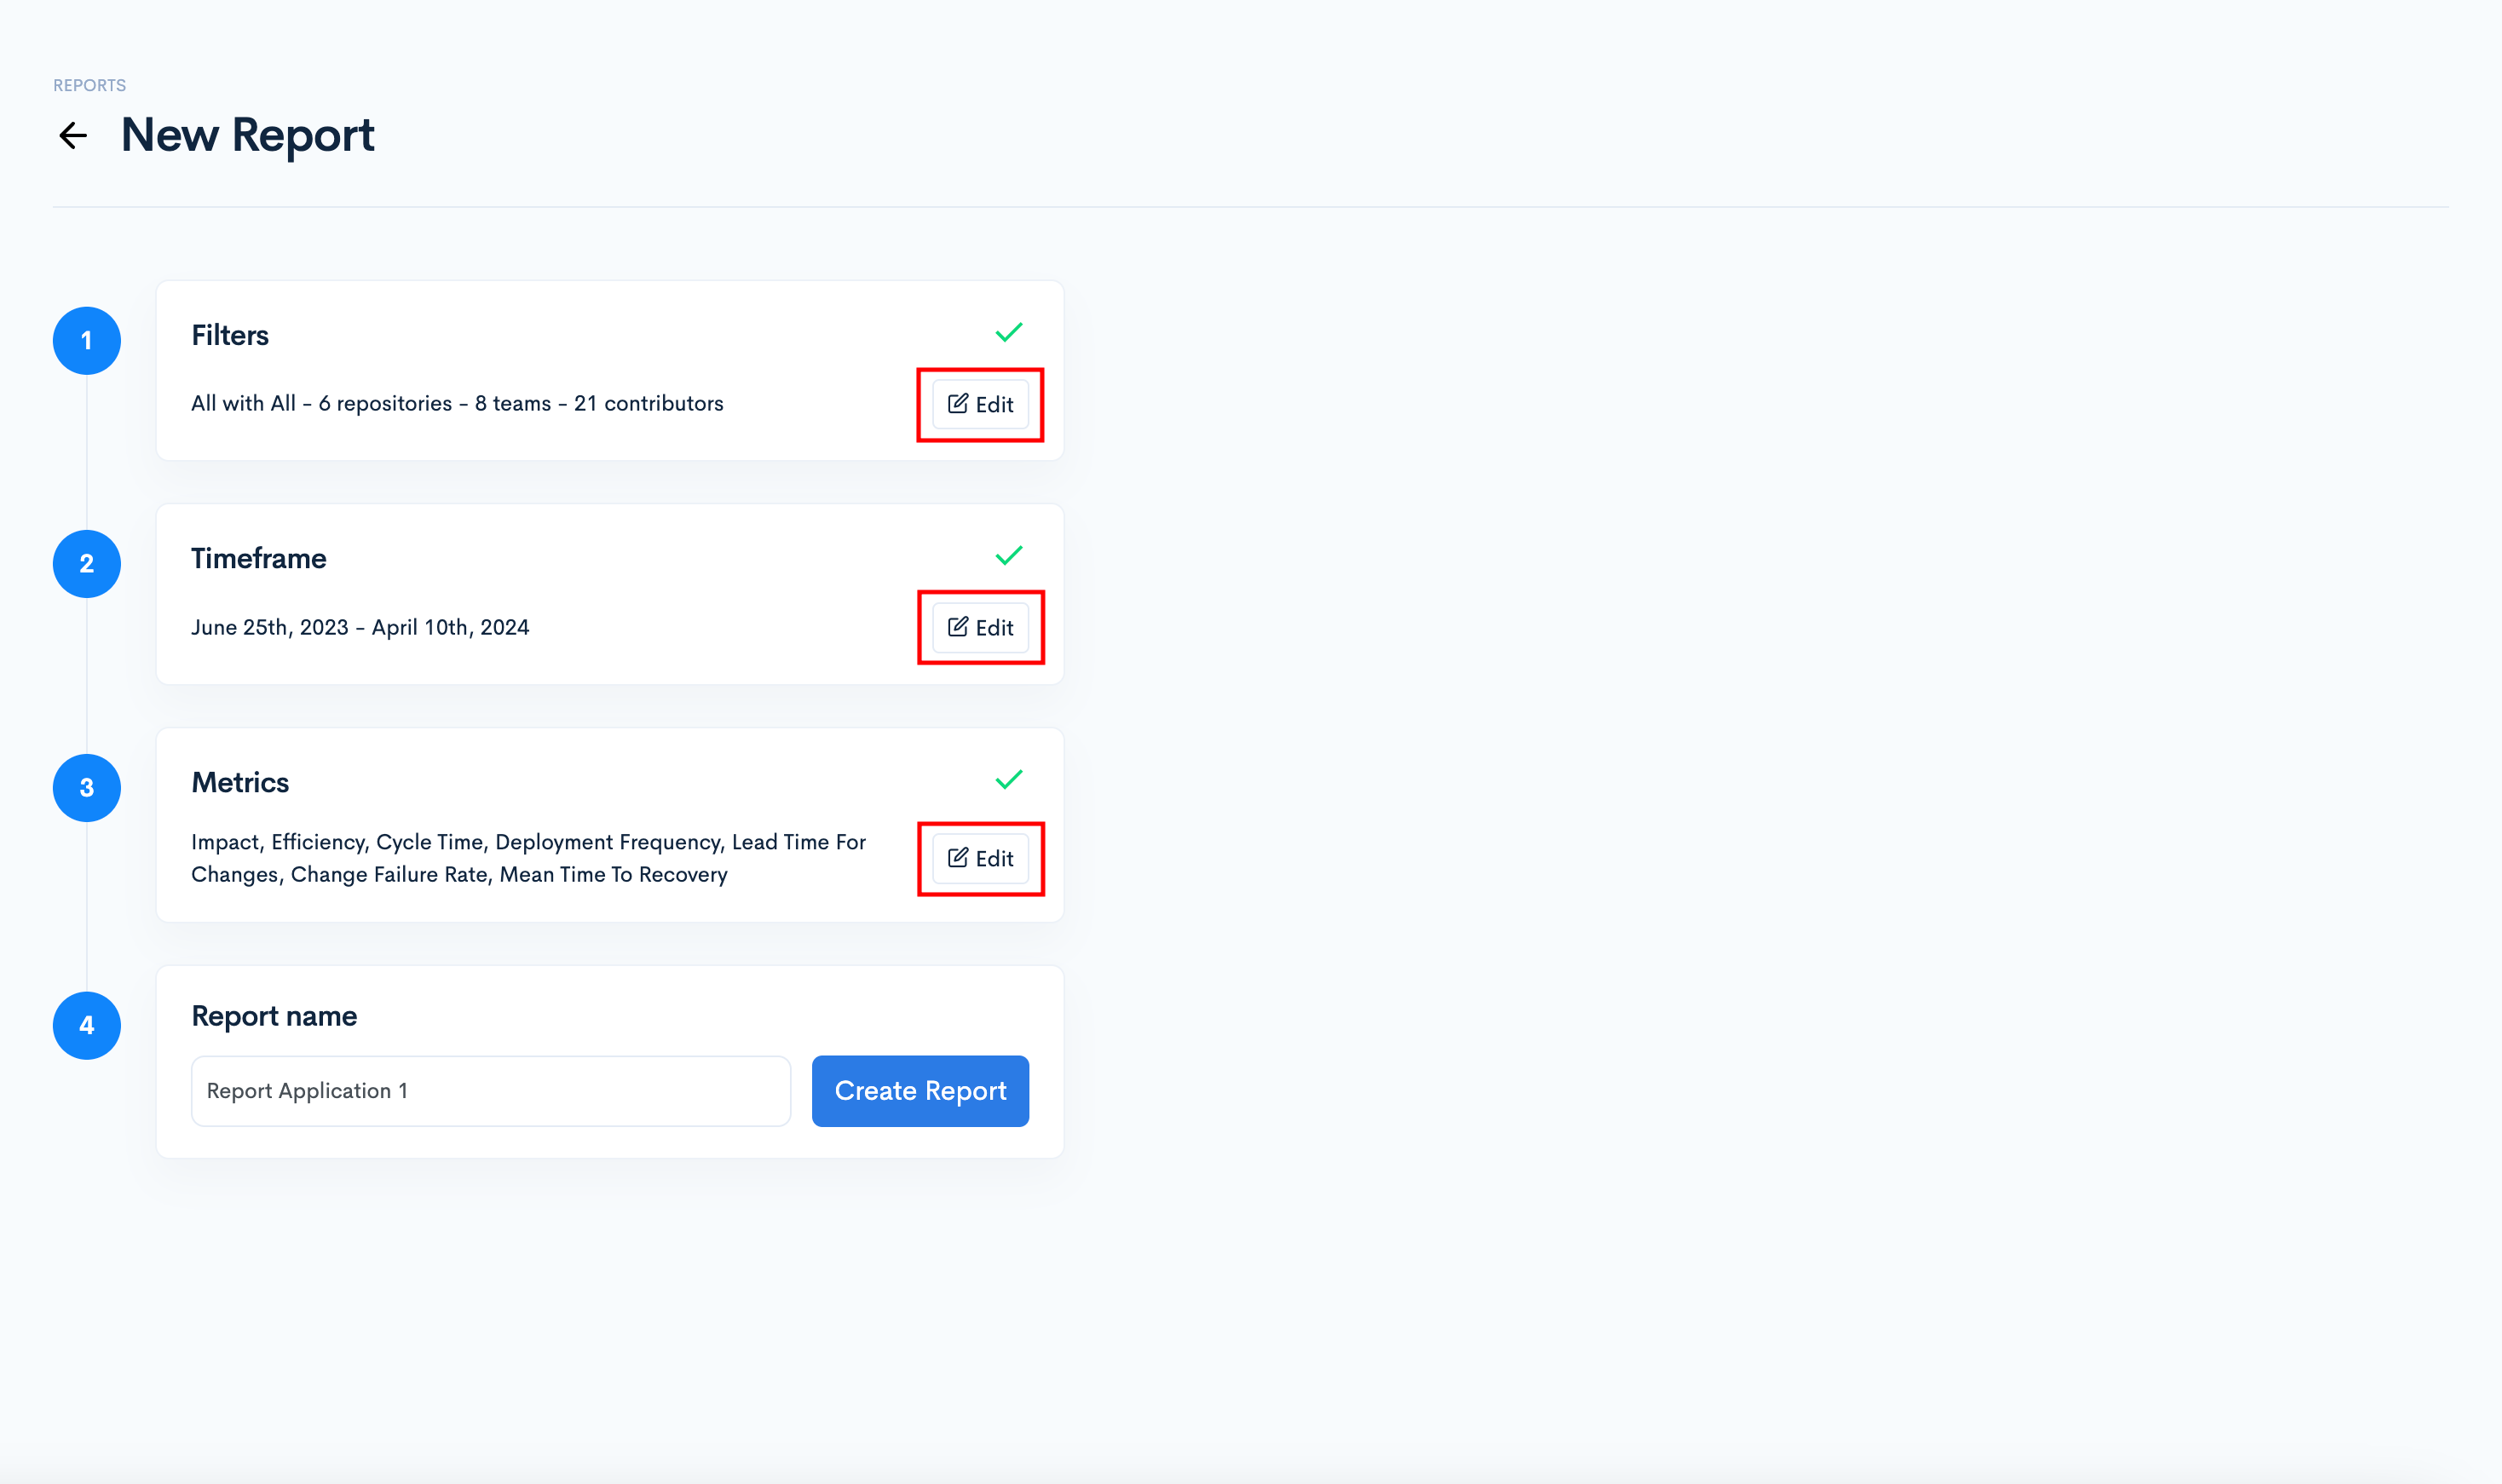
Create a new report
To create a new report, click the "Create New Report" button from the upper-right corner.
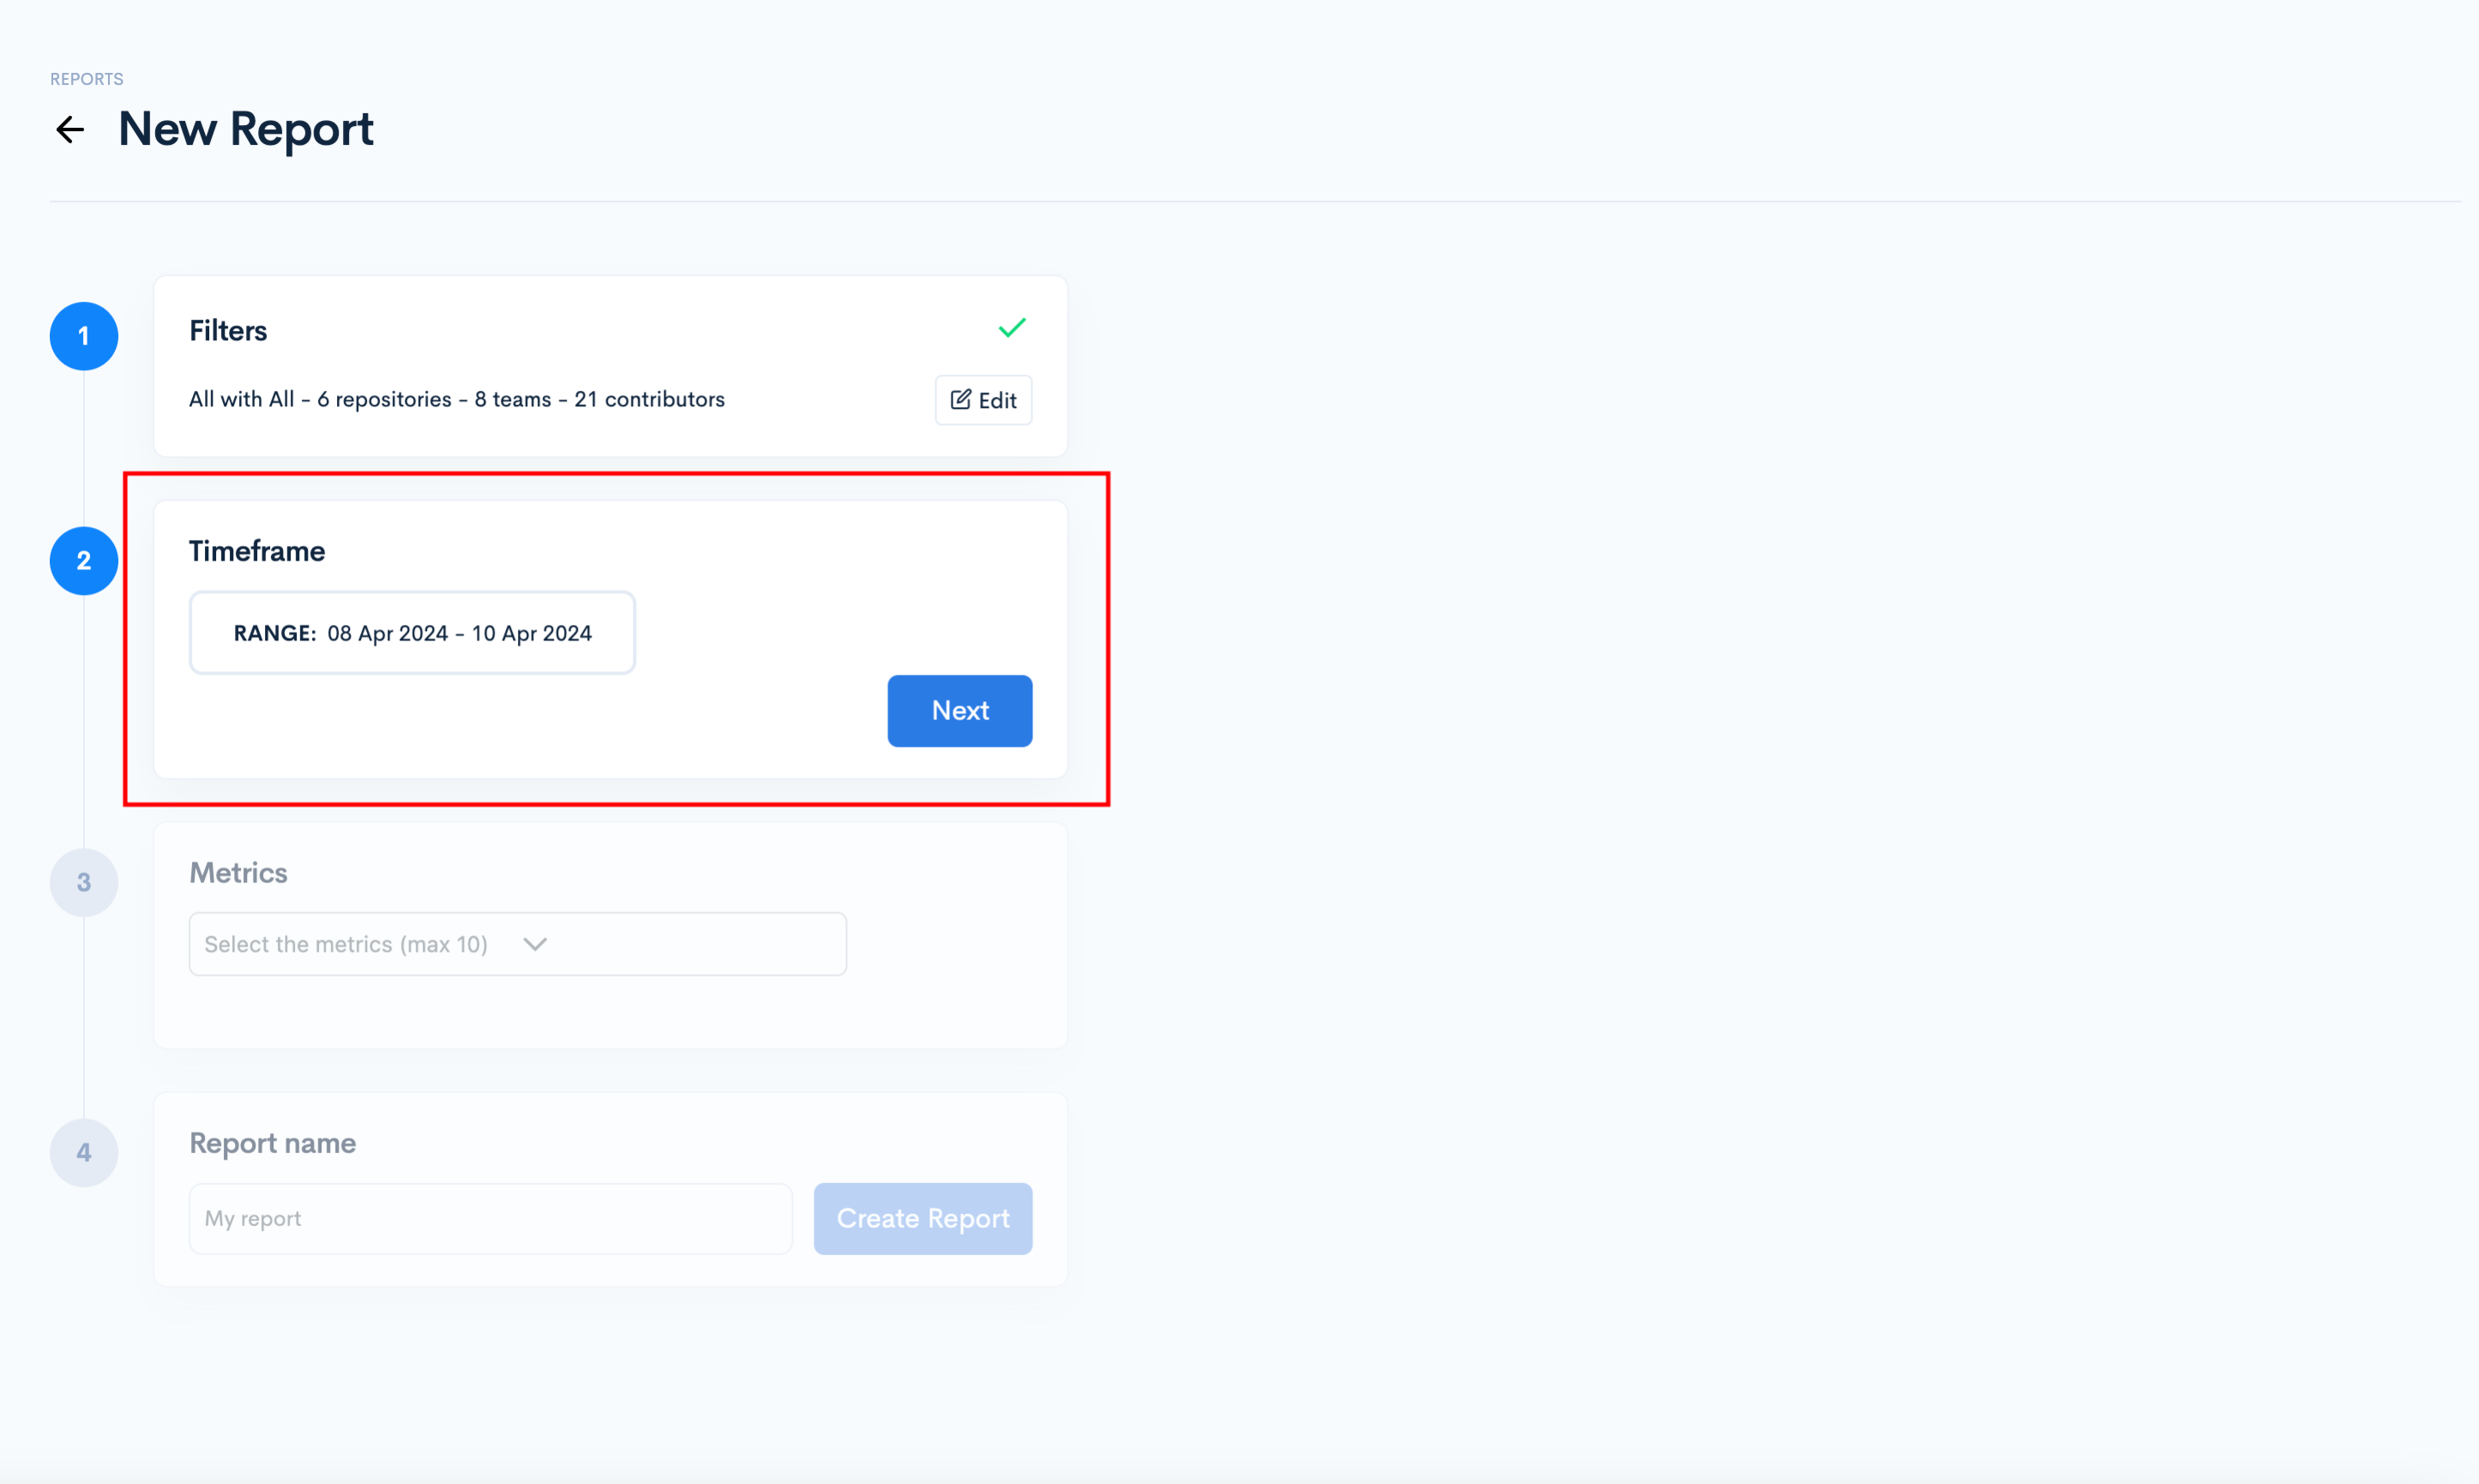
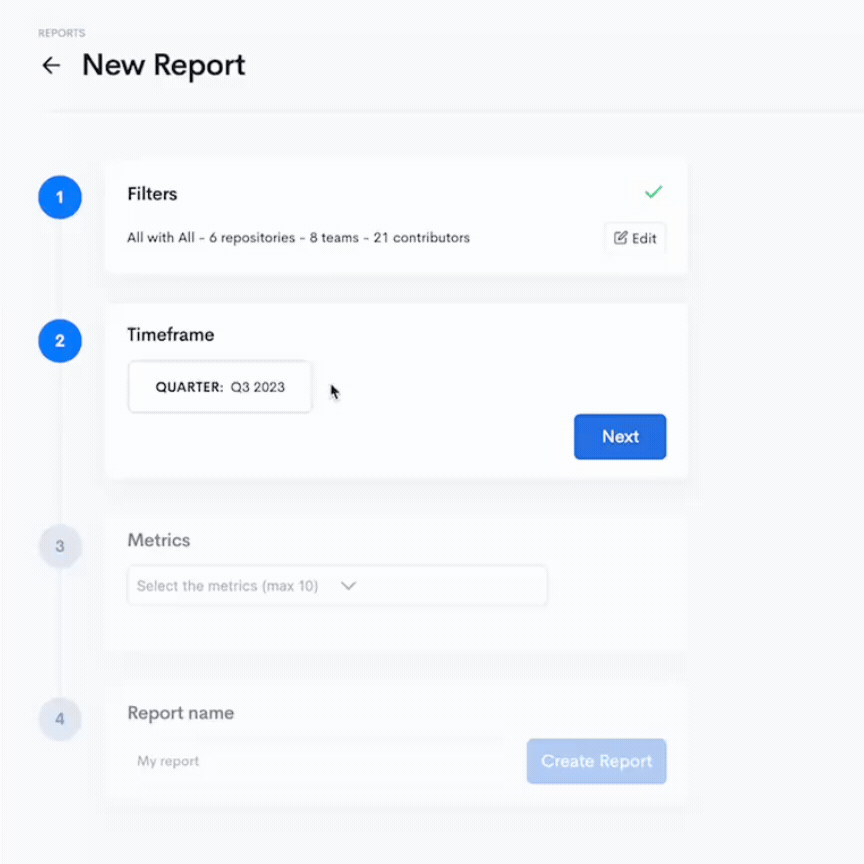
- First, select the Filters (application; repositories; teams and cotributors).
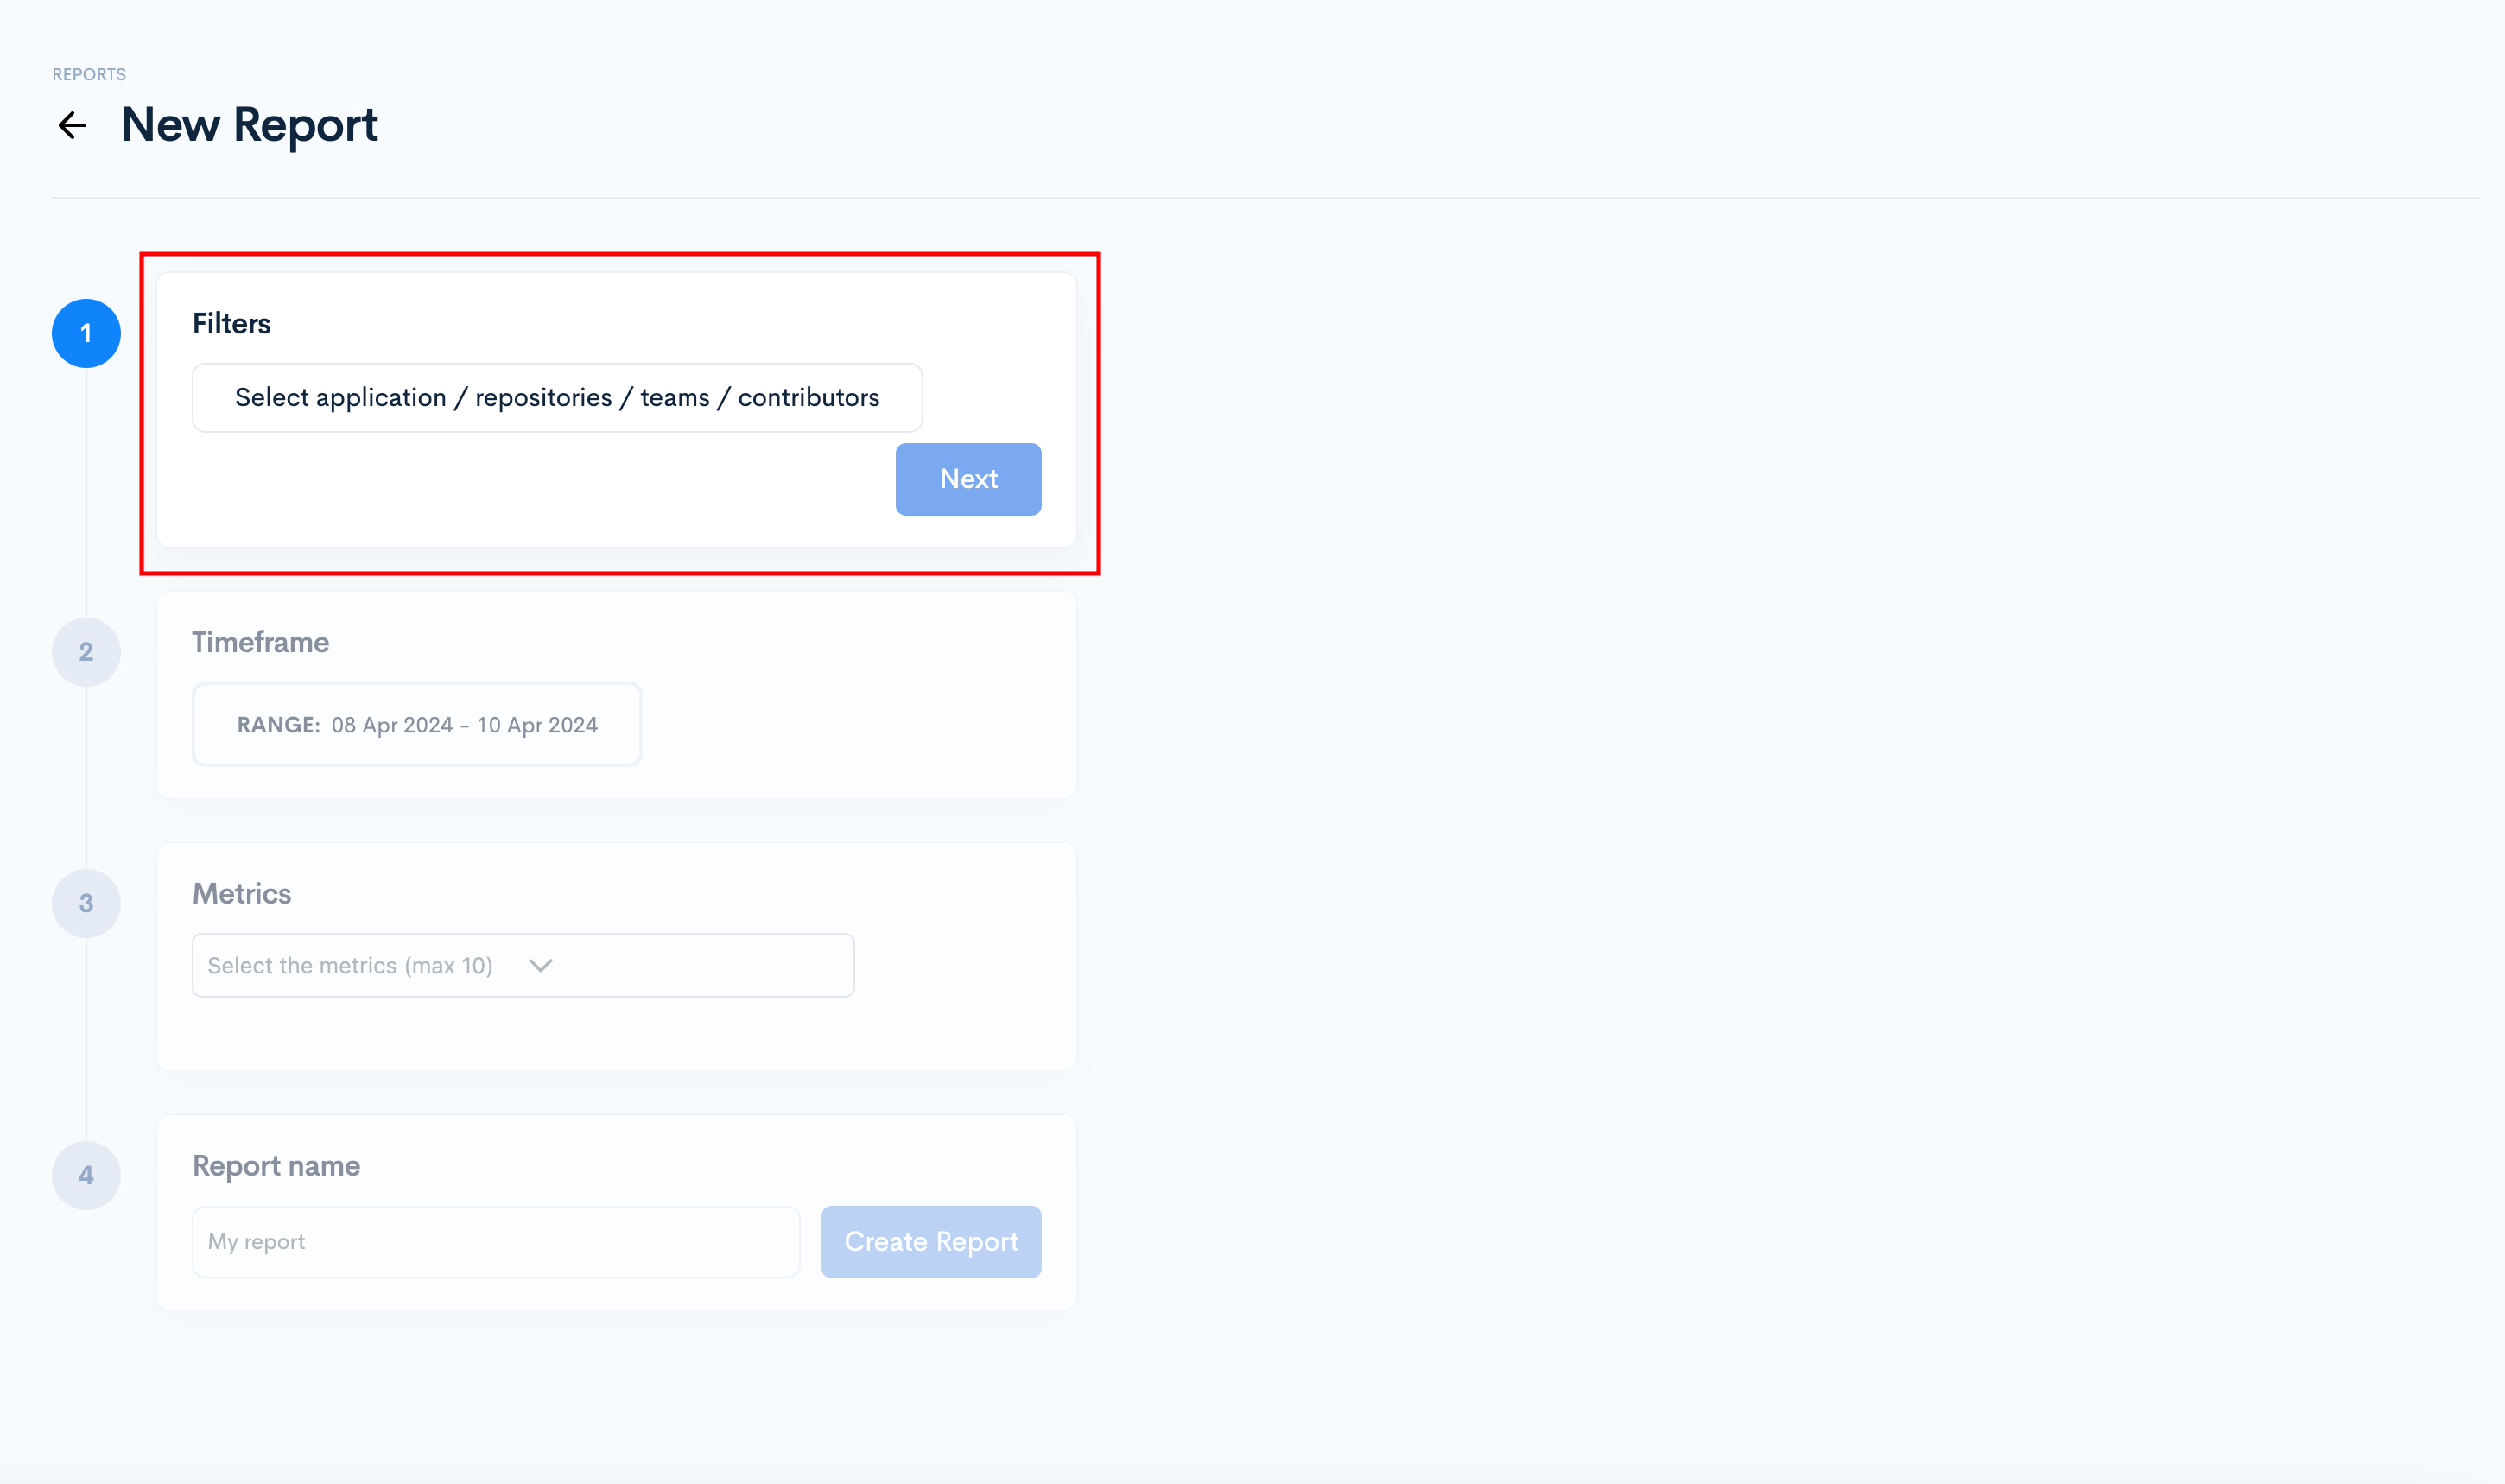
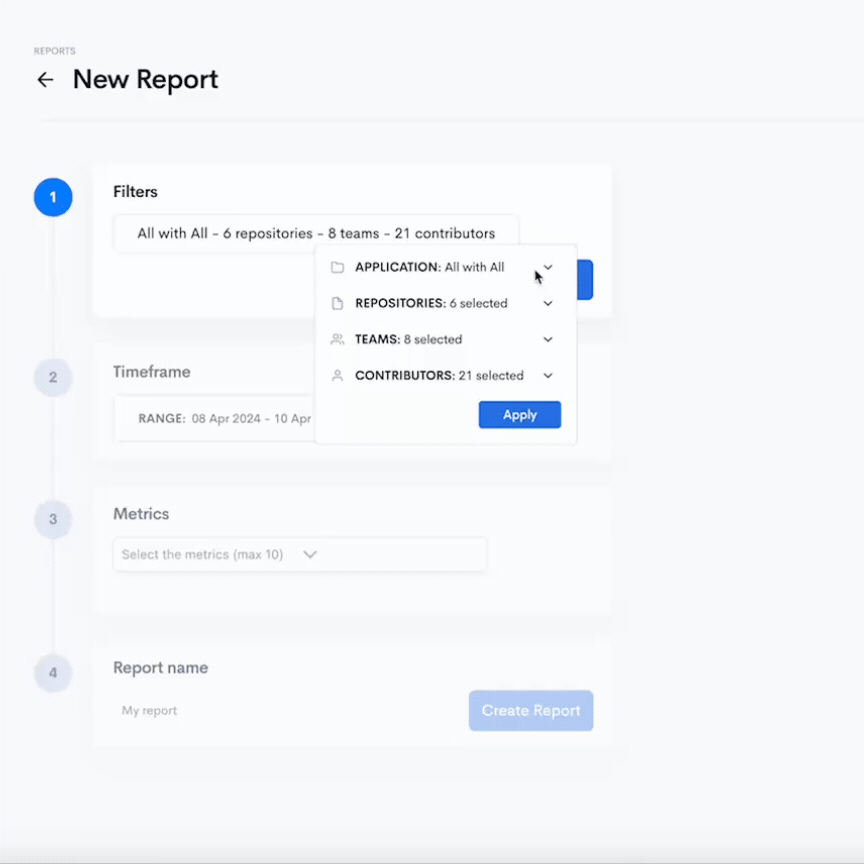
Once done, click Next.
- Select the time range you want to extract the data for.
This feature is designed to effectively manage large datasets, ensuring scalability as data volume grows.
Once done, click "Next".
- Select the metrics (max. 10)
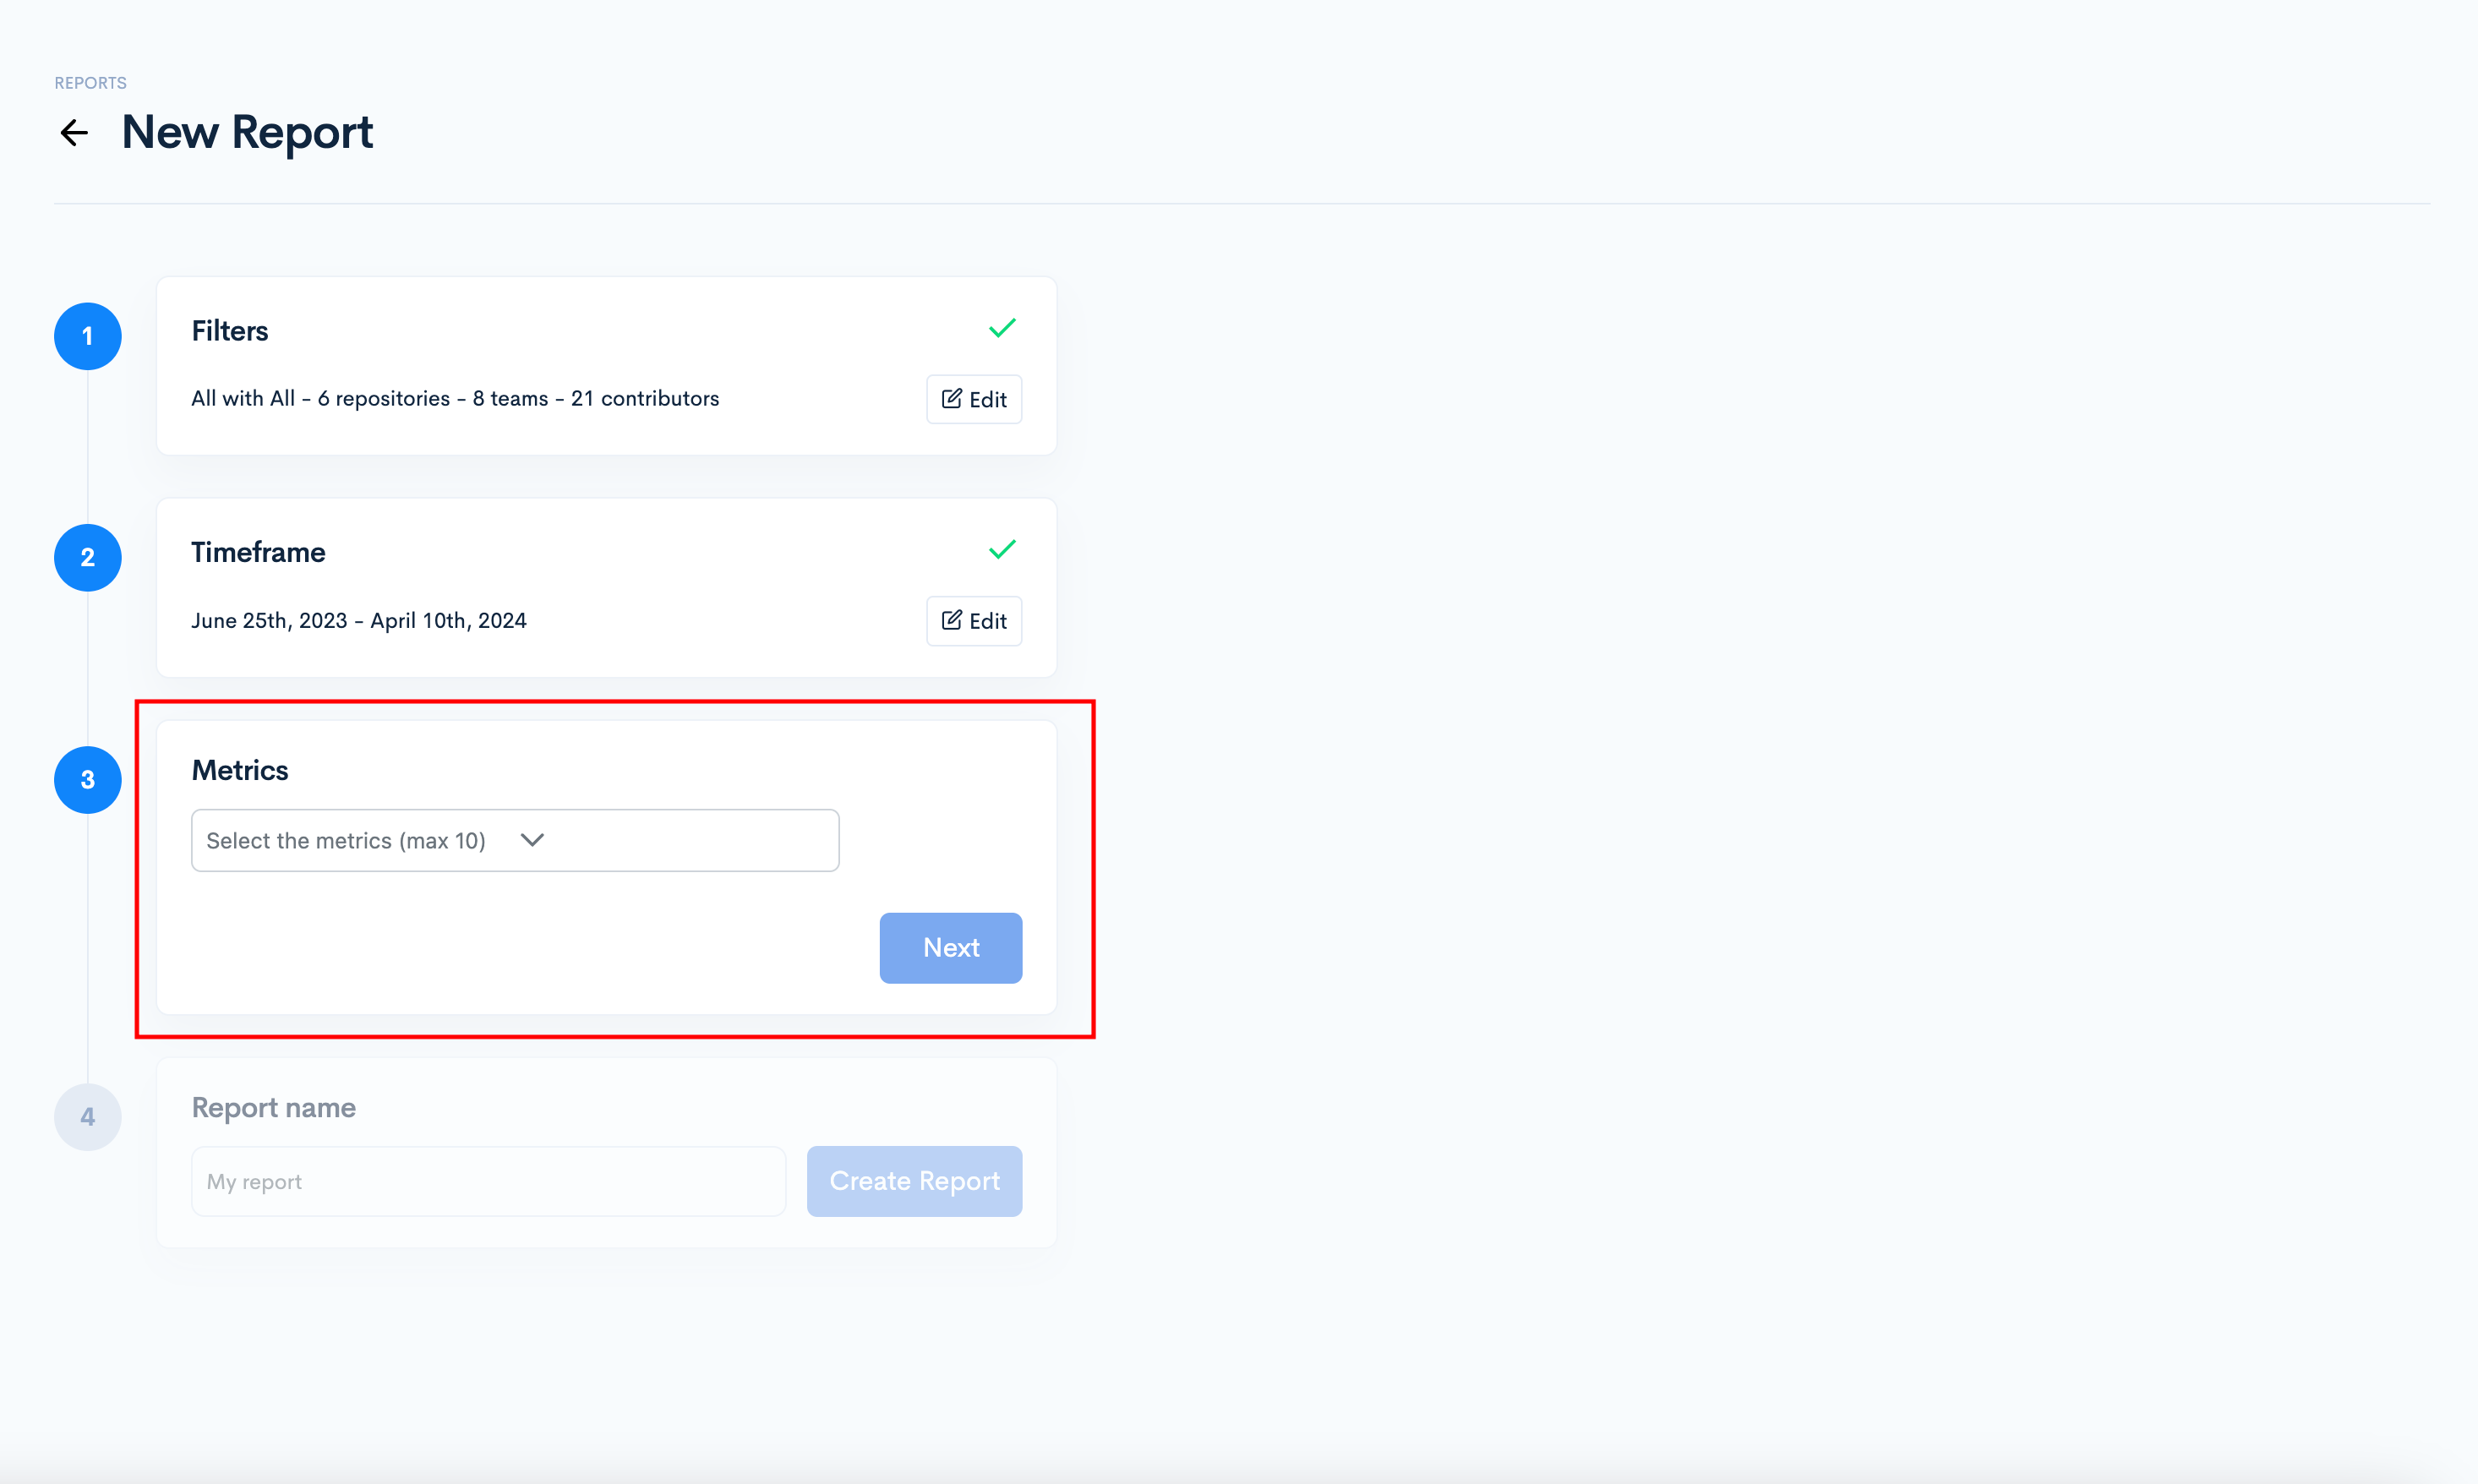
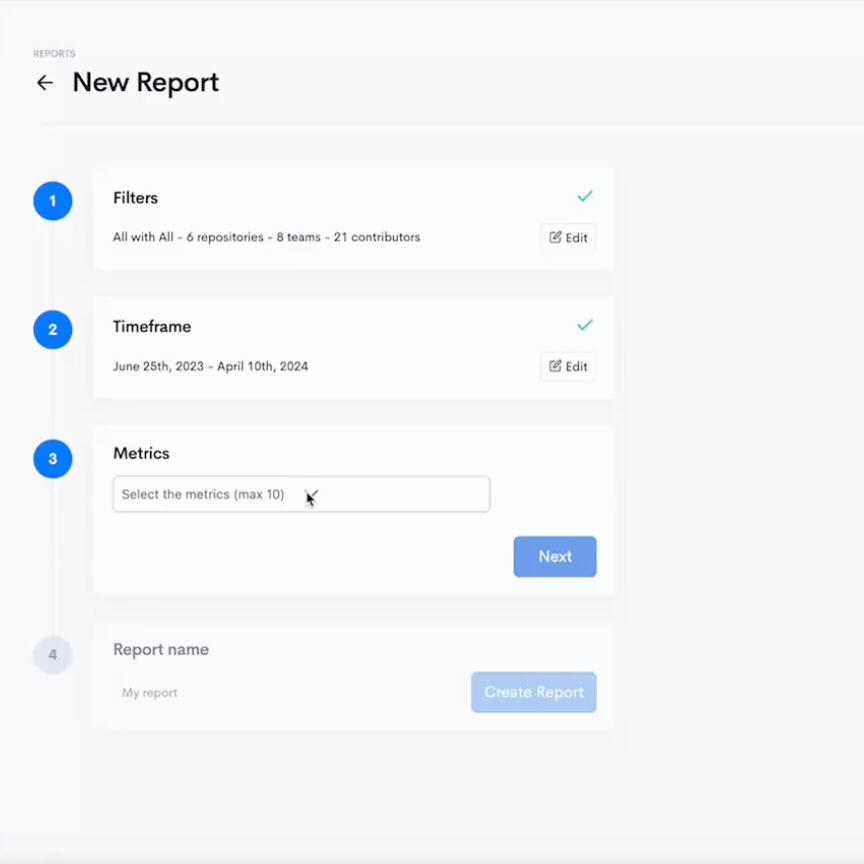
Once you select the metrics, click "Next."
- Name your report
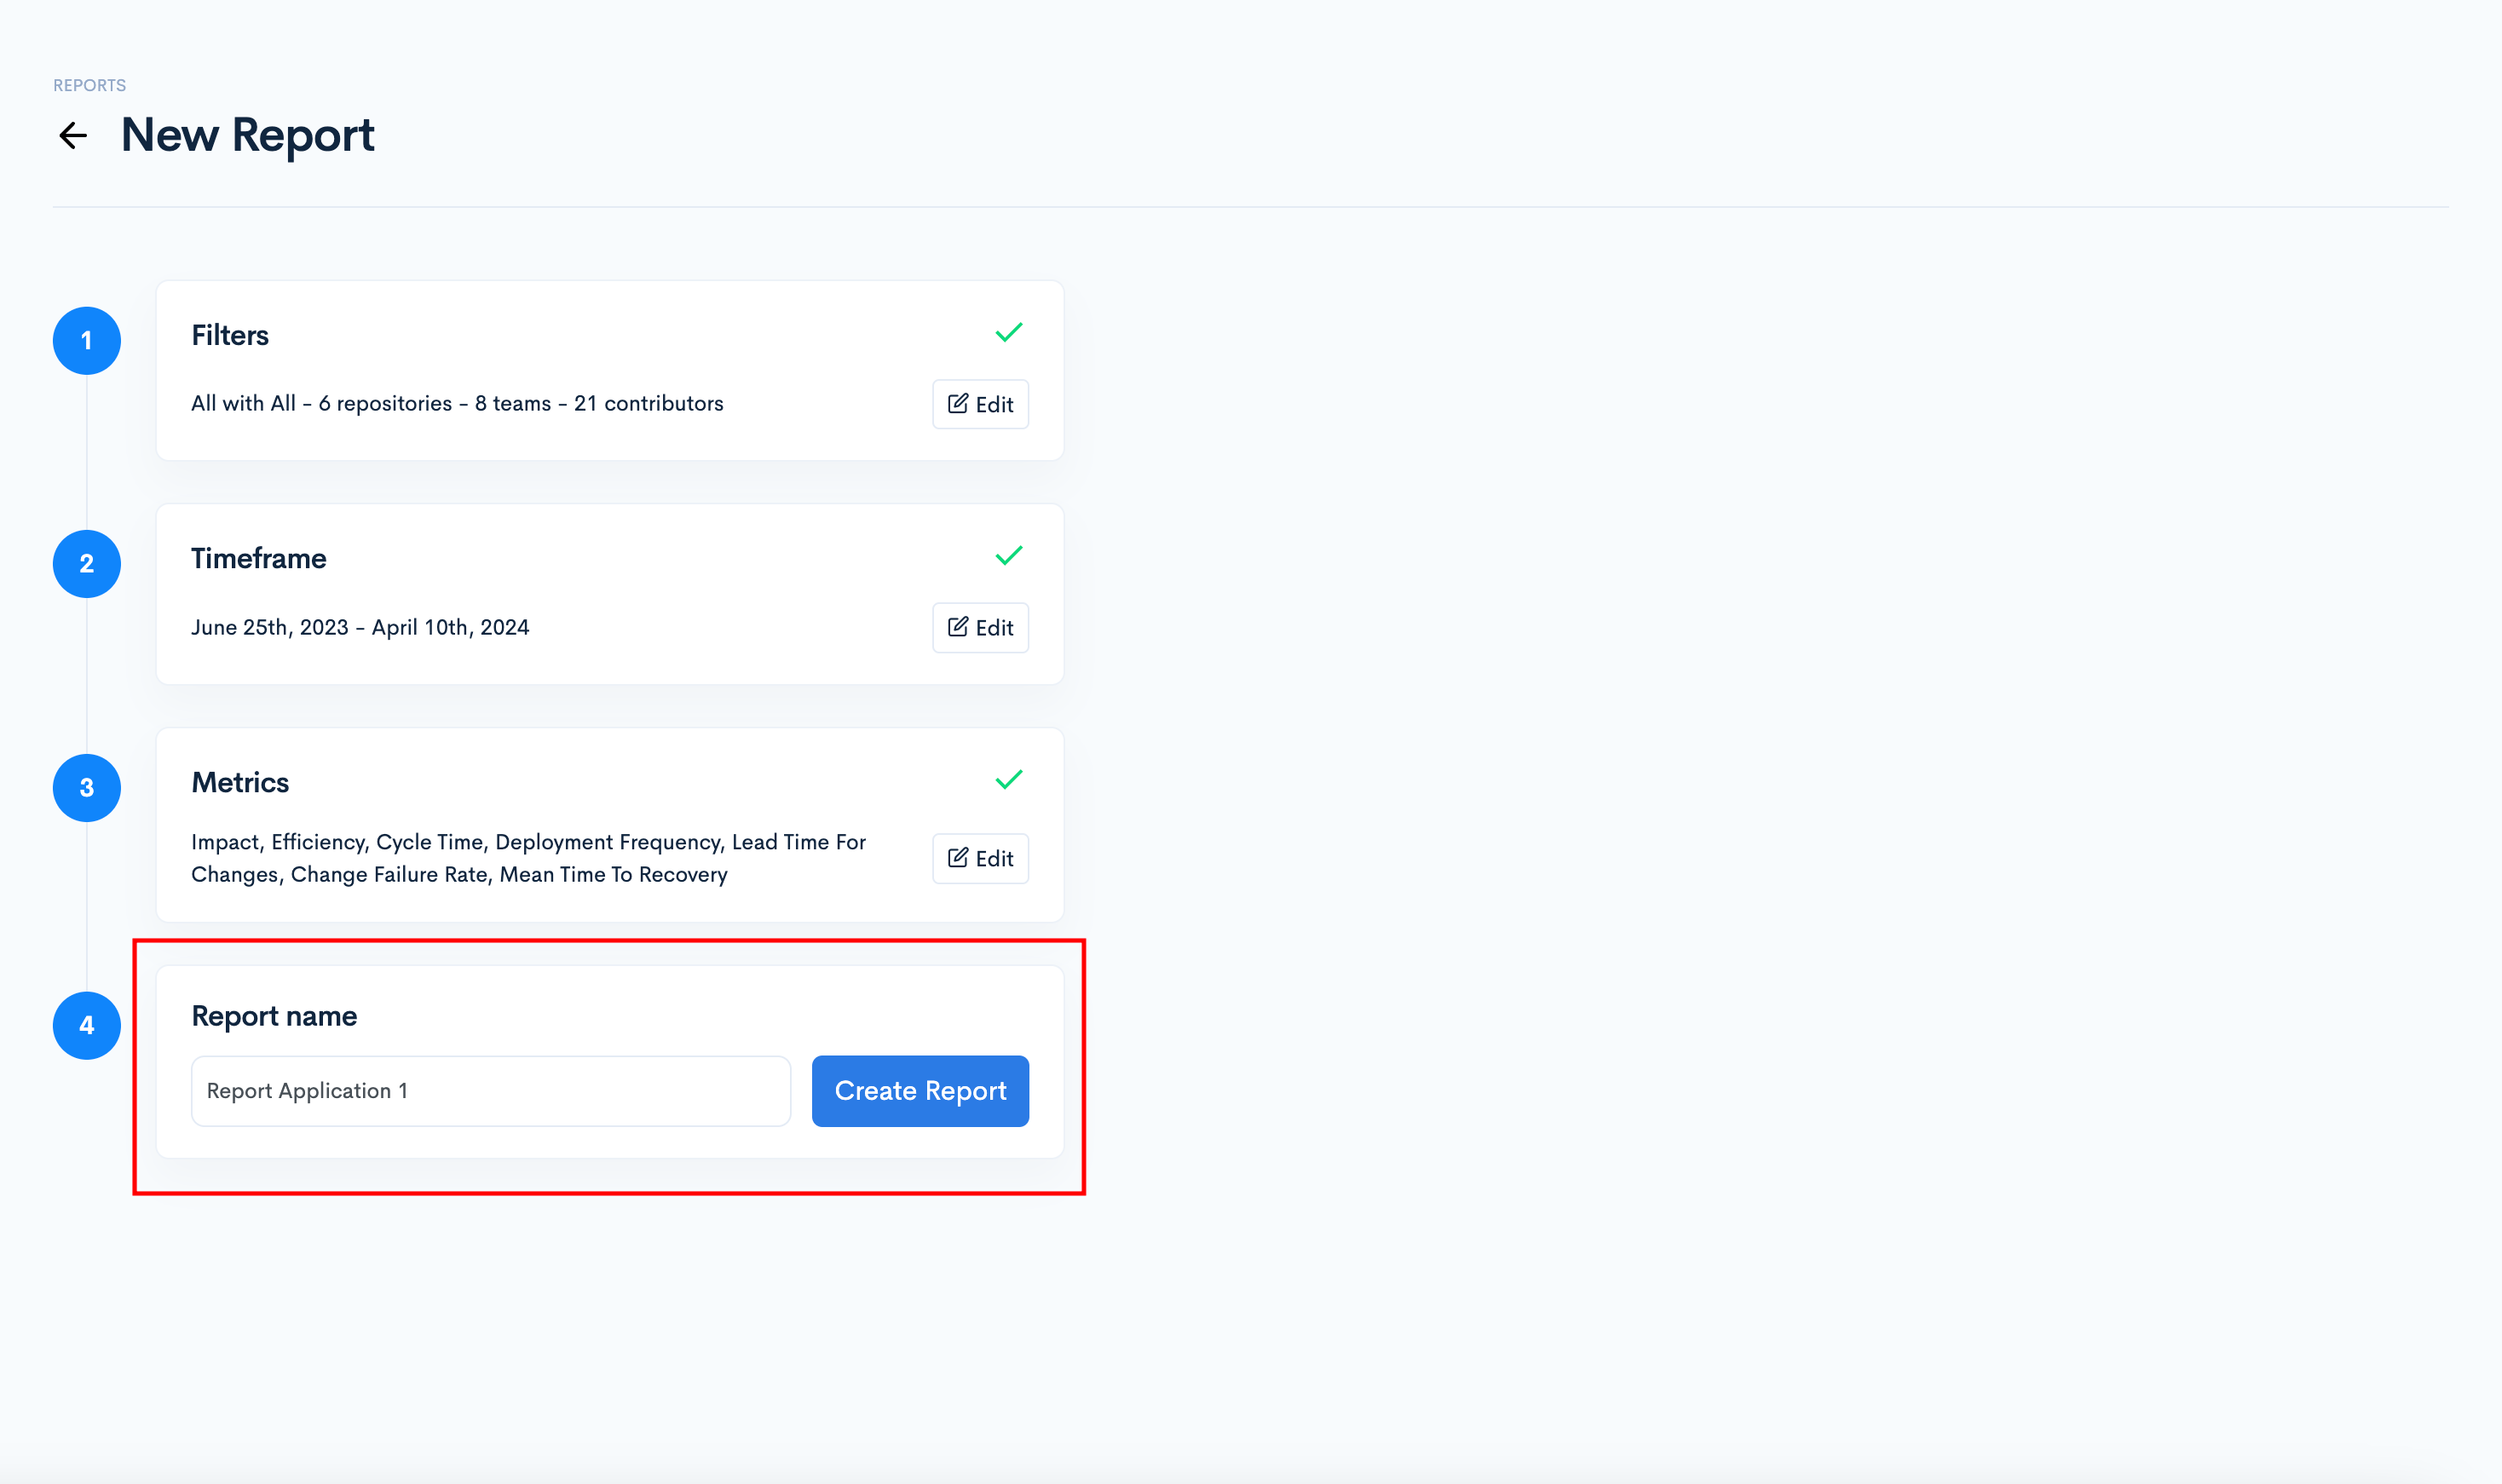
Once named, click "Create Report".
If you want to edit a previous step, you can click the Edit button of that specific step.
After creating the report, please wait for the data to be compiled. The Status column will show the progress. The report will be available once the status indicates "Ready."
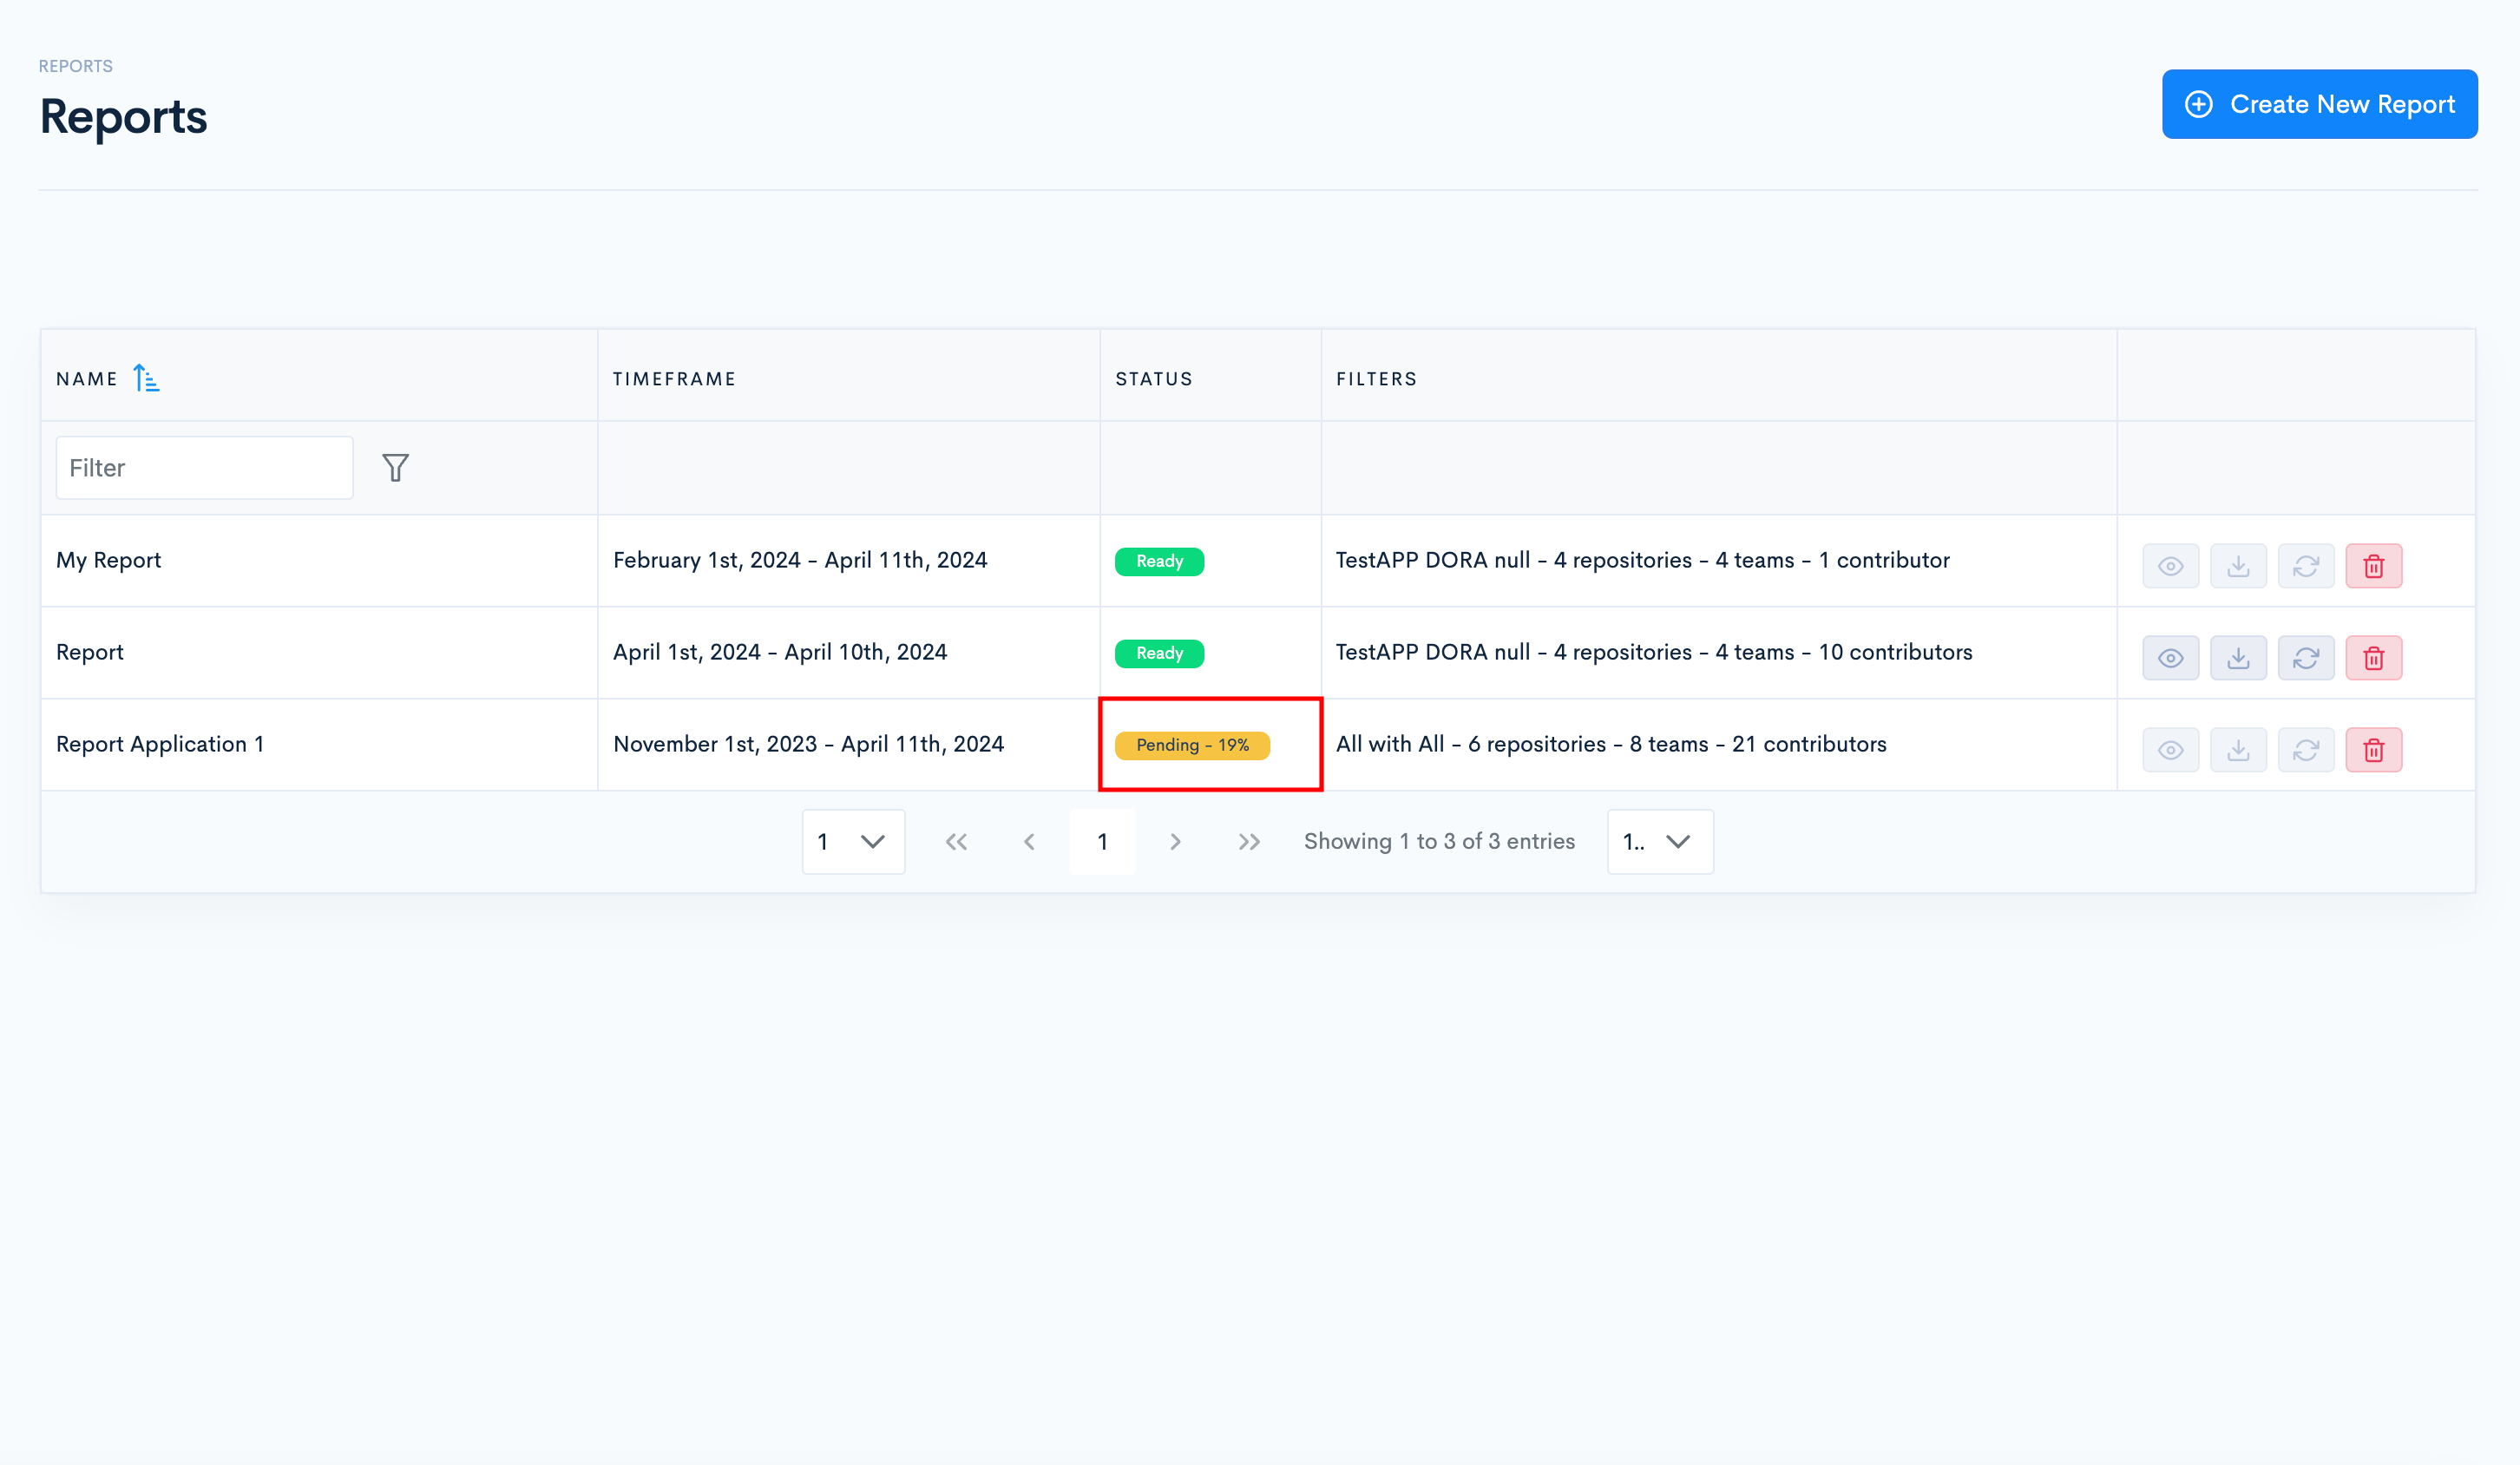
Once it says "Ready", you can see the report, download it, resync it, or delete it.
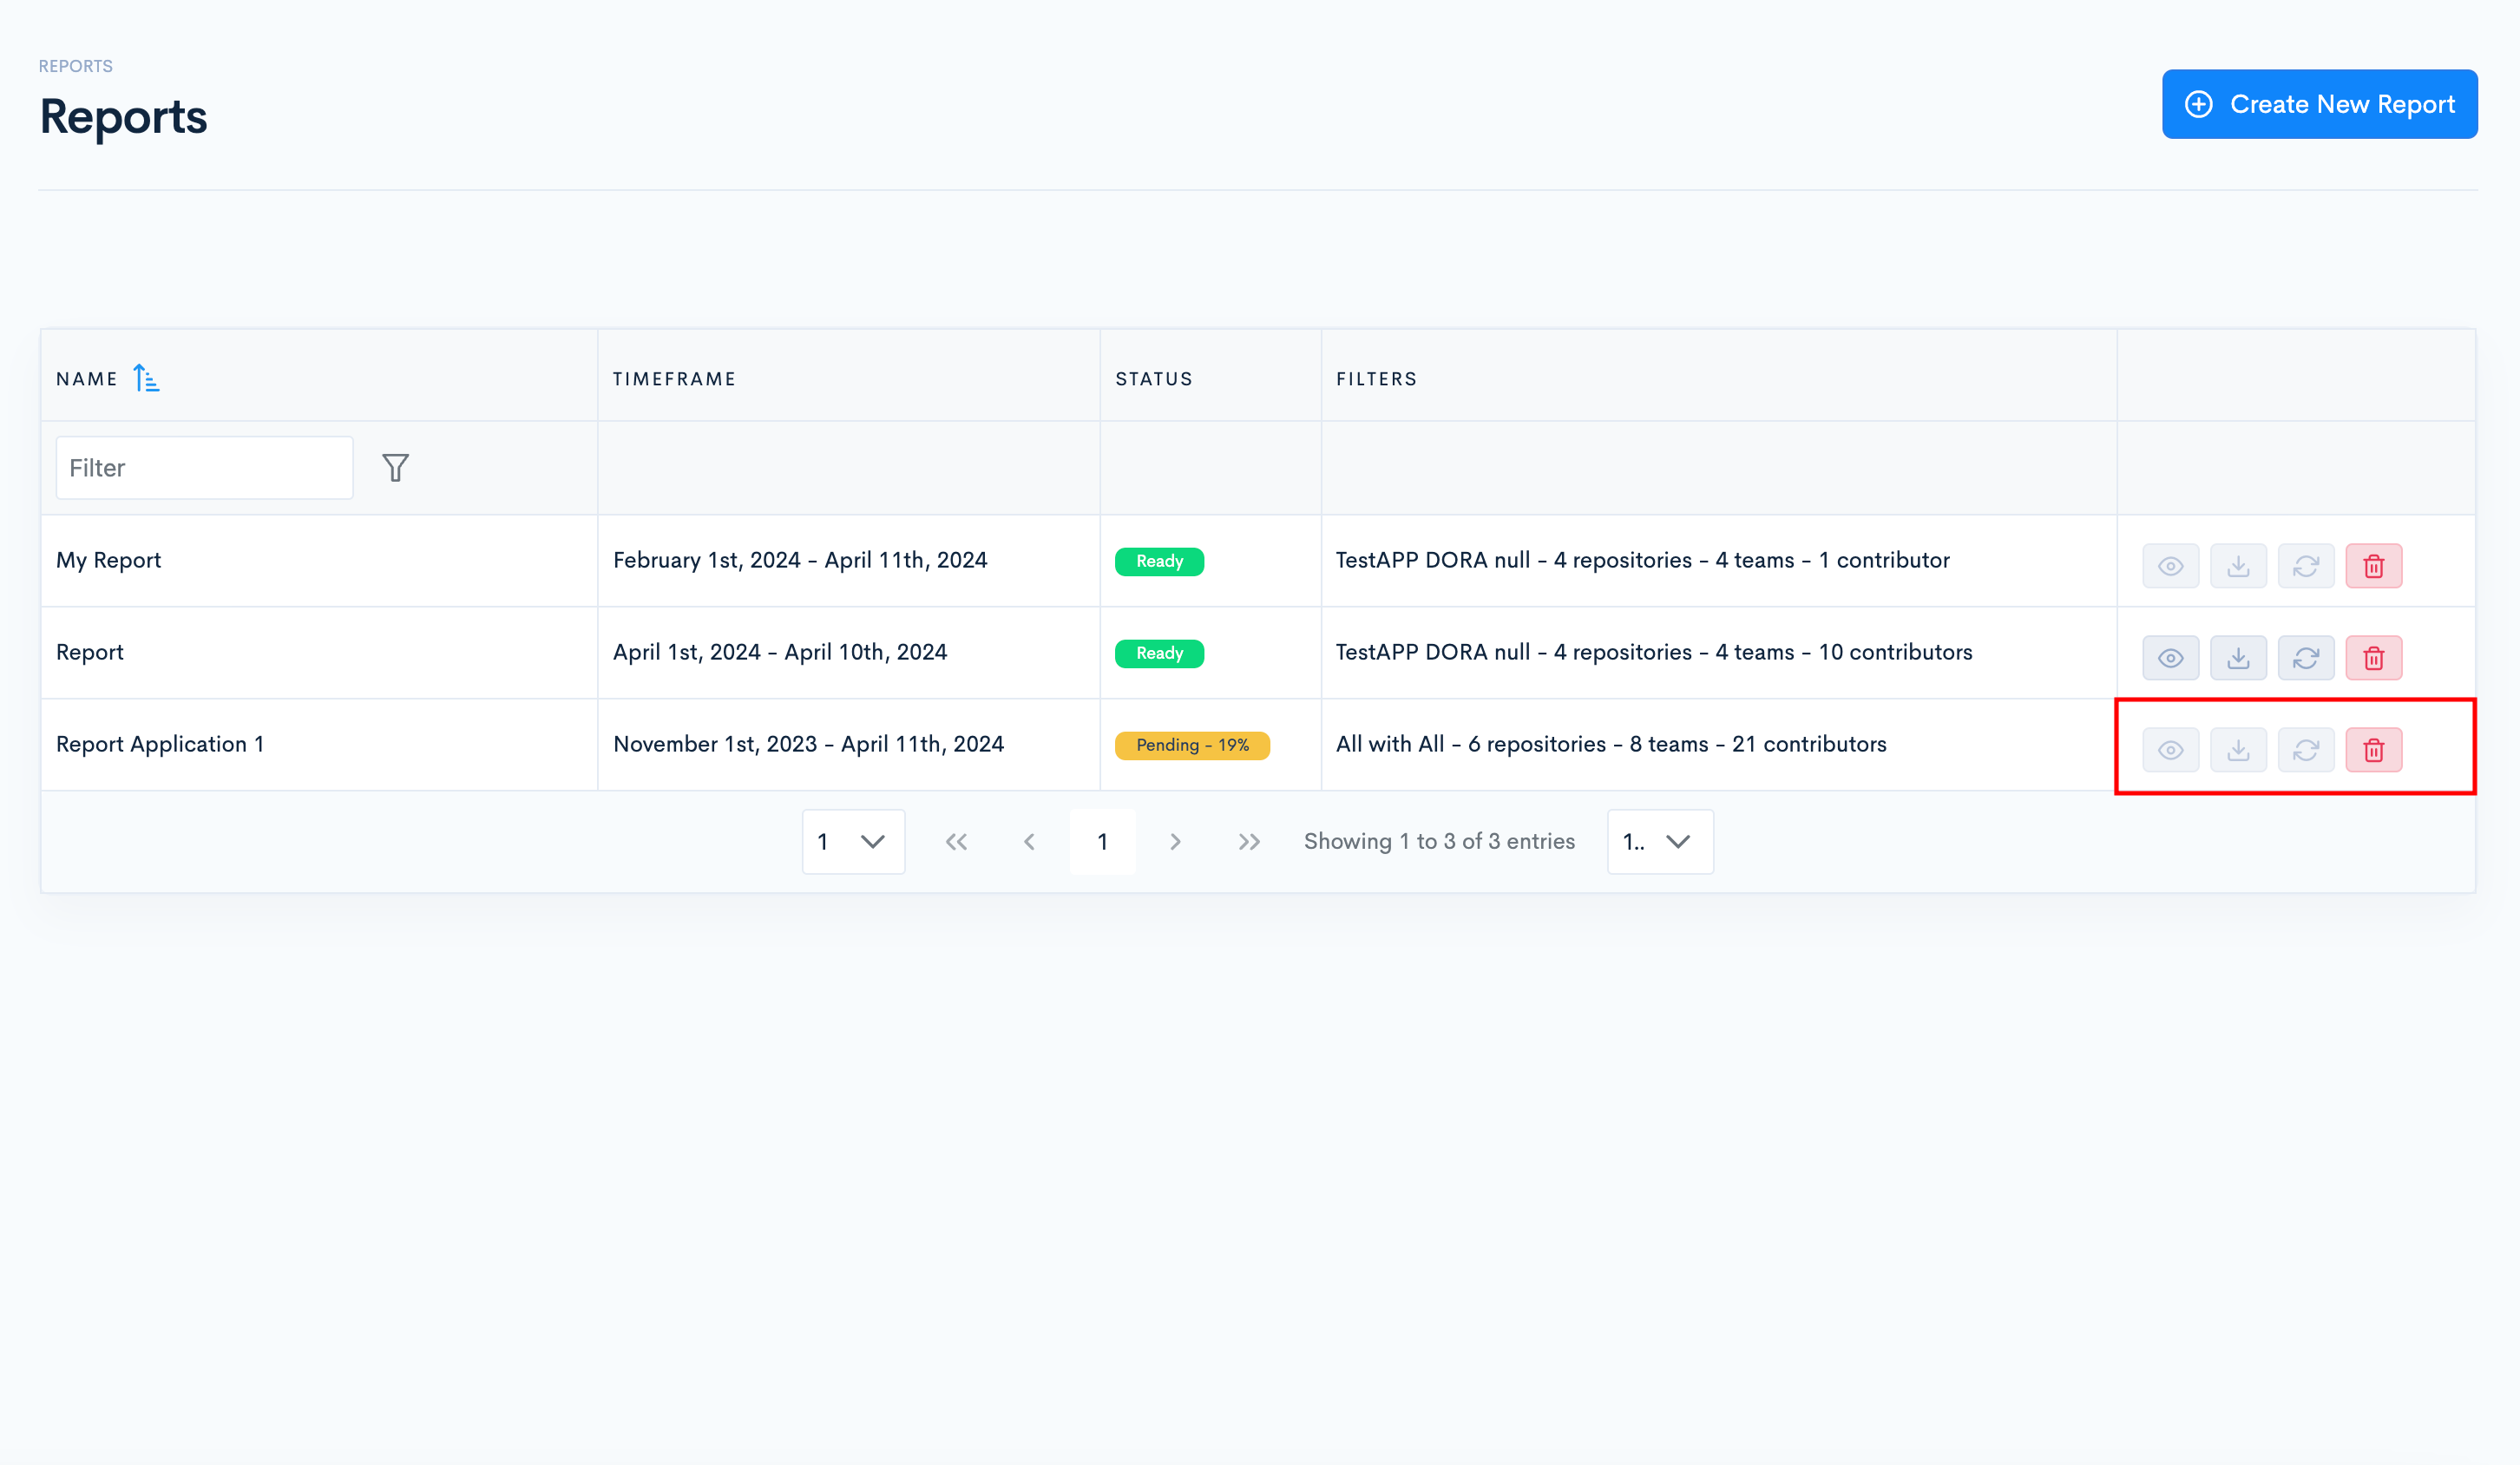
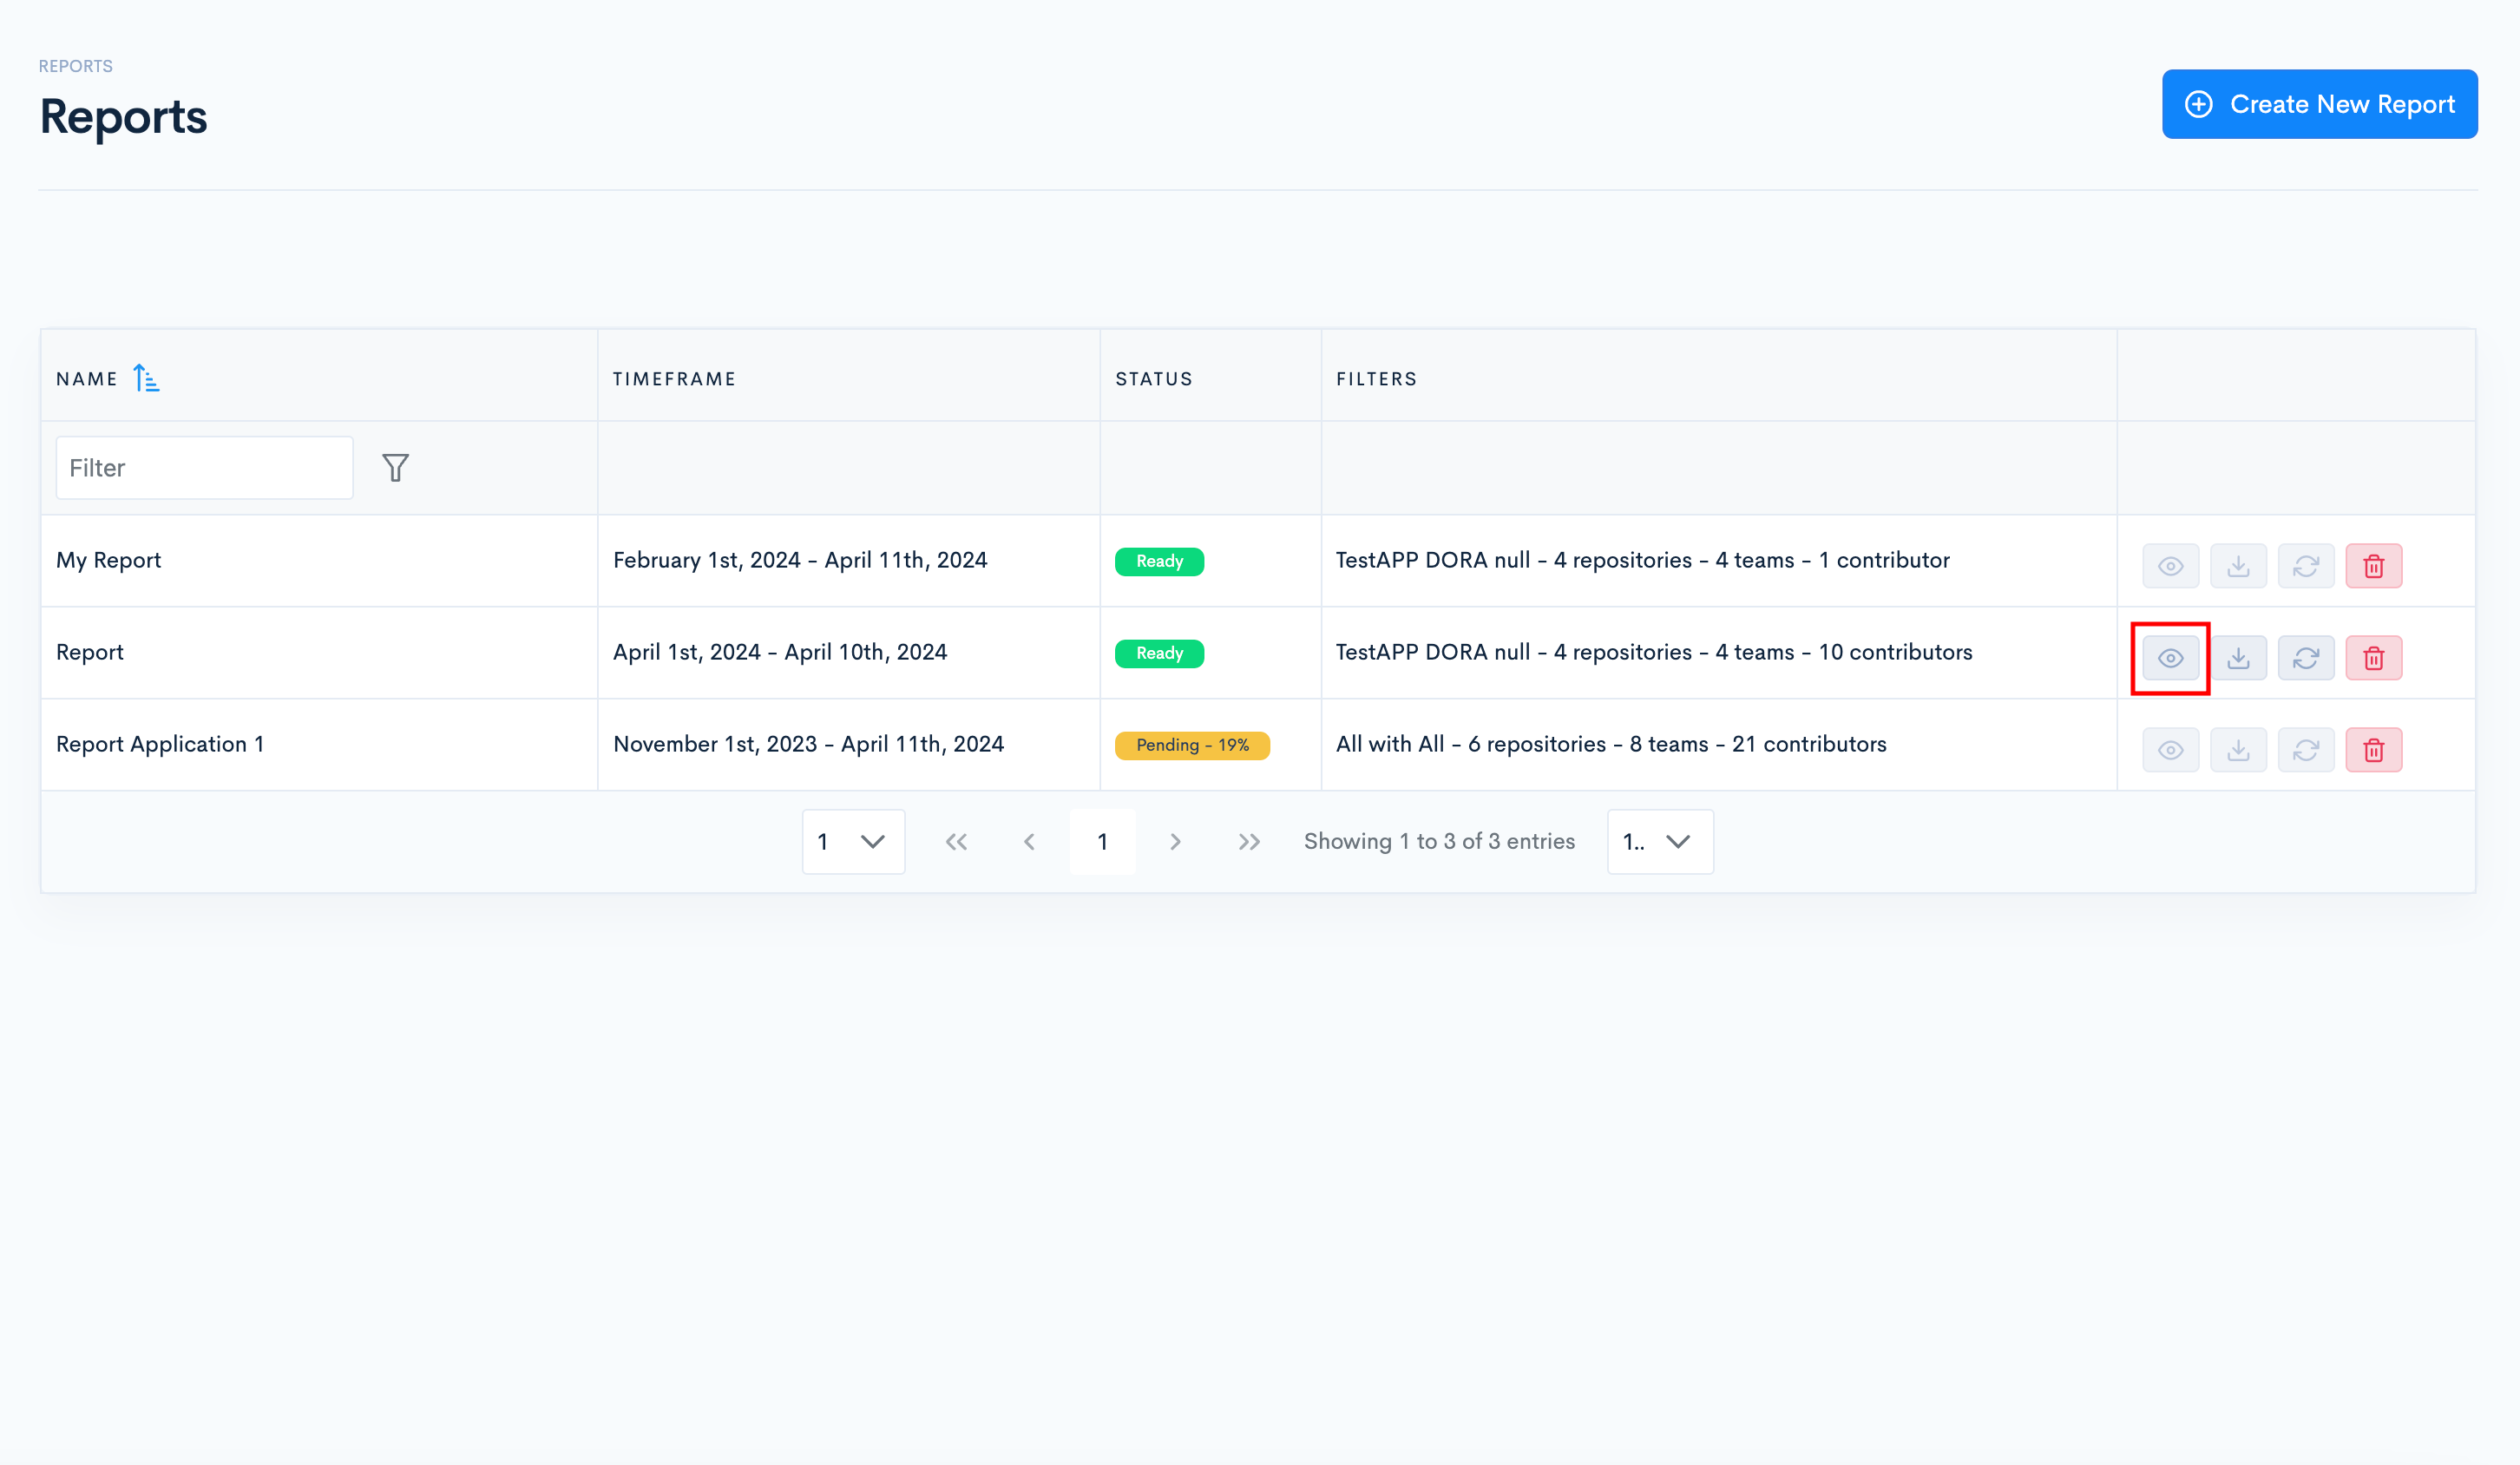
To view the report, click the "View report" button.
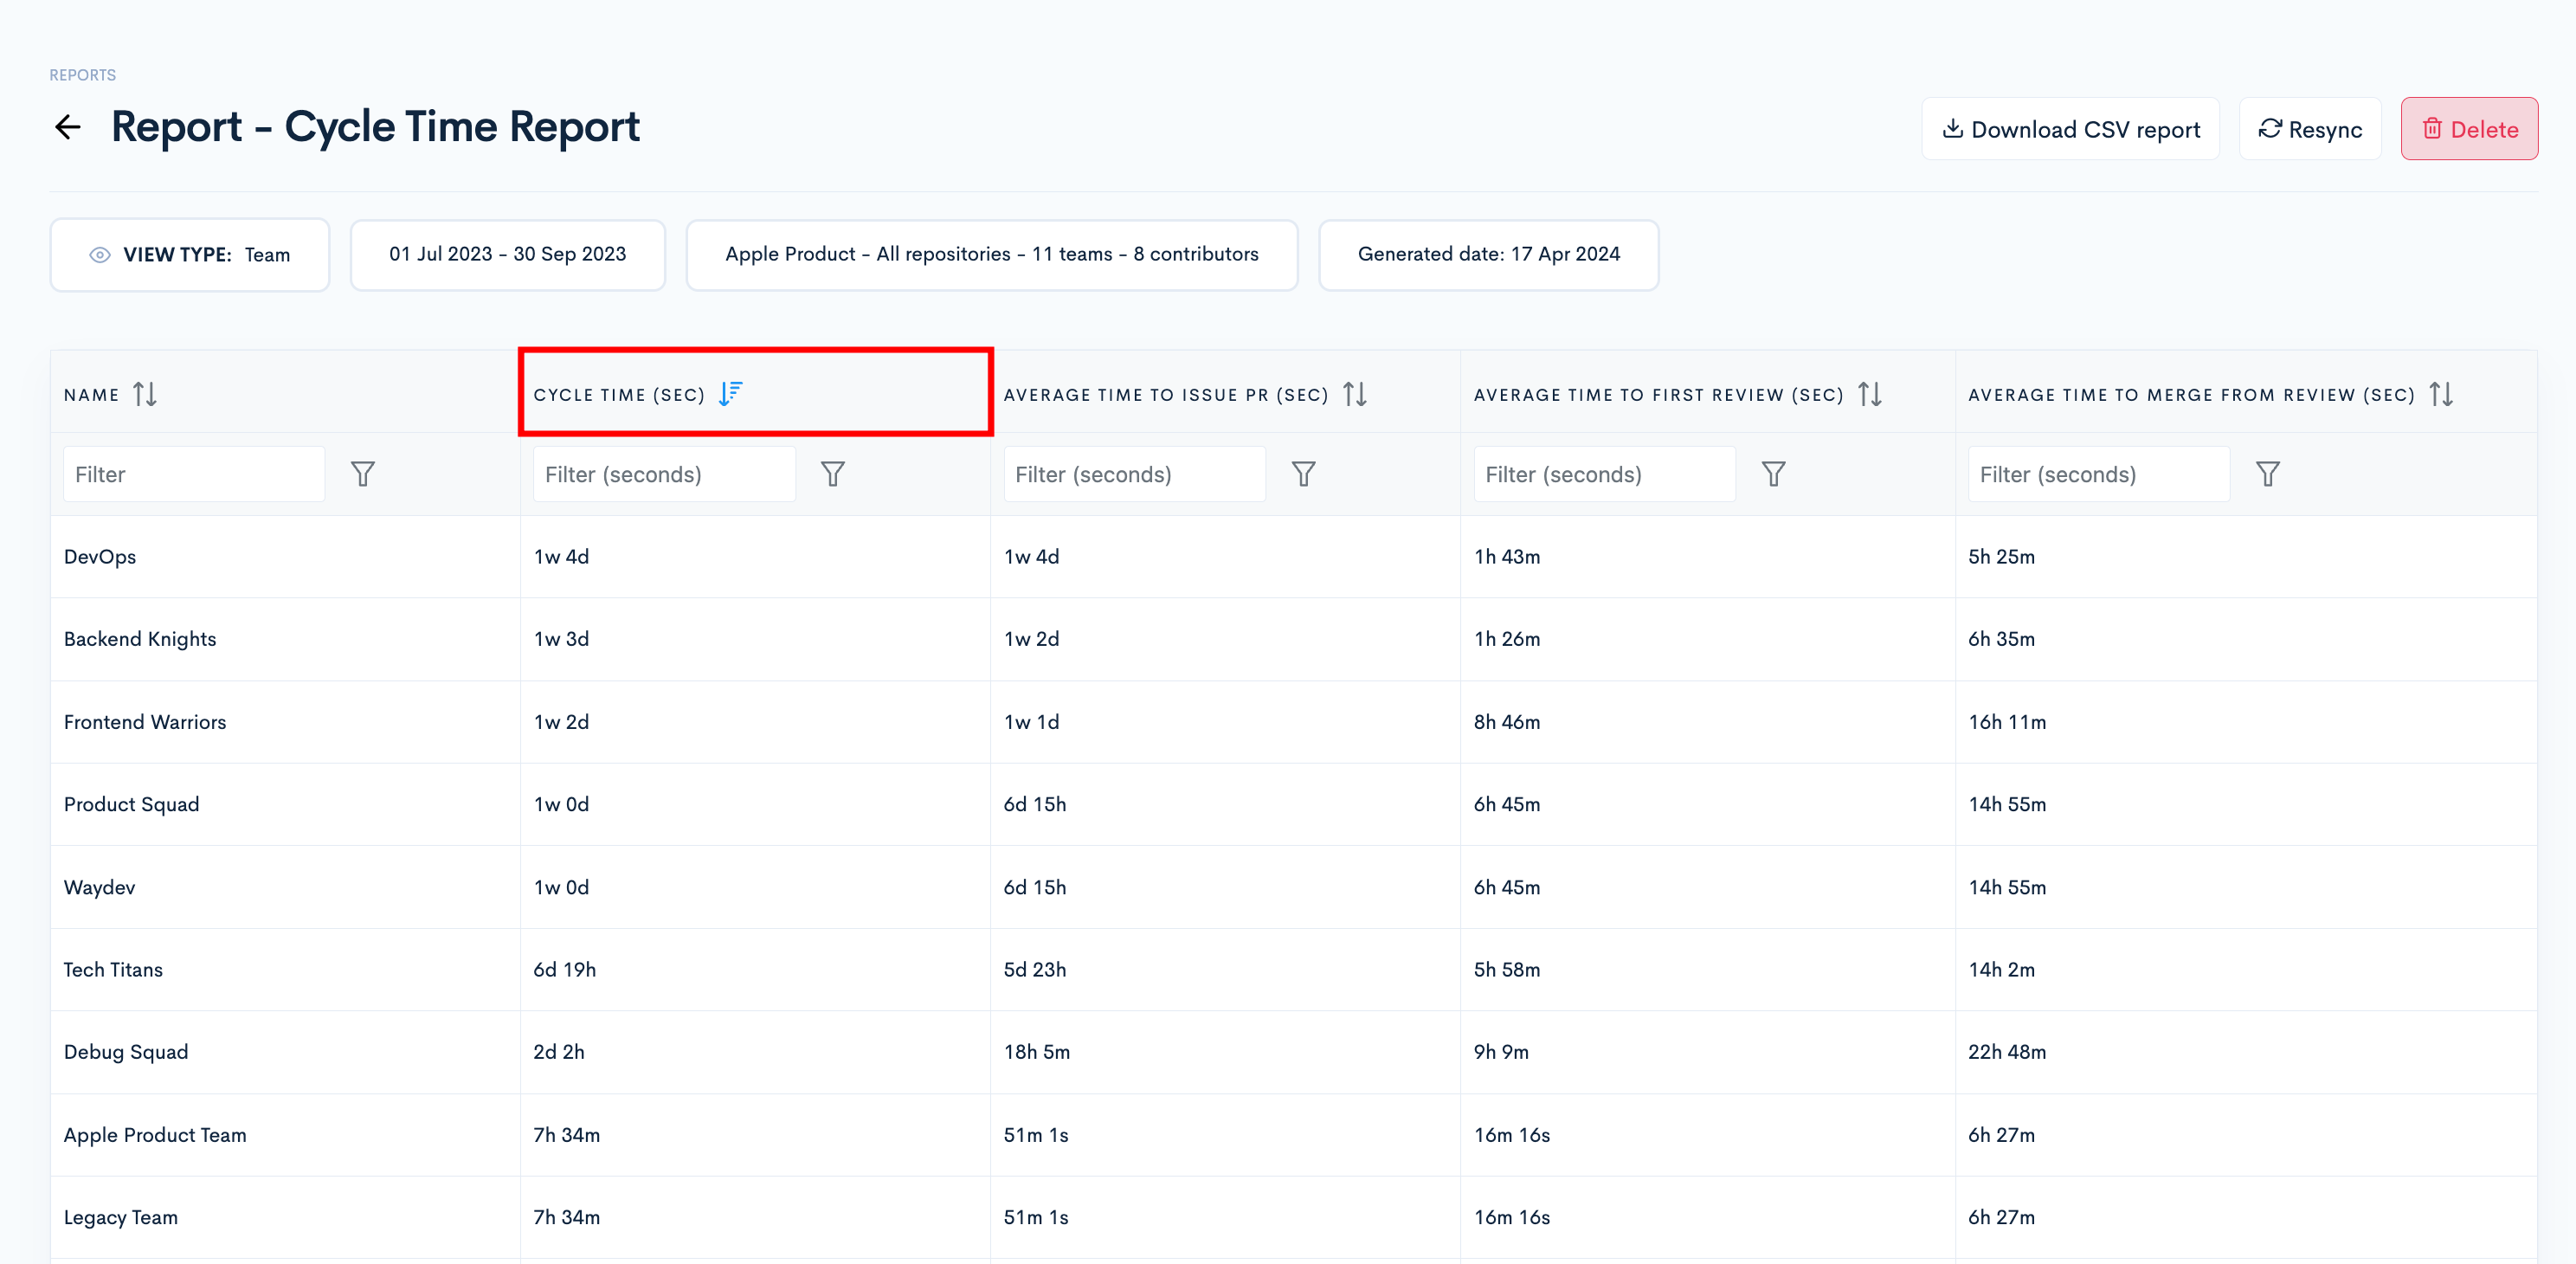
Once the report opens, you can select the view type:
- Application;
- Repository;
- Team;
- Contributor.
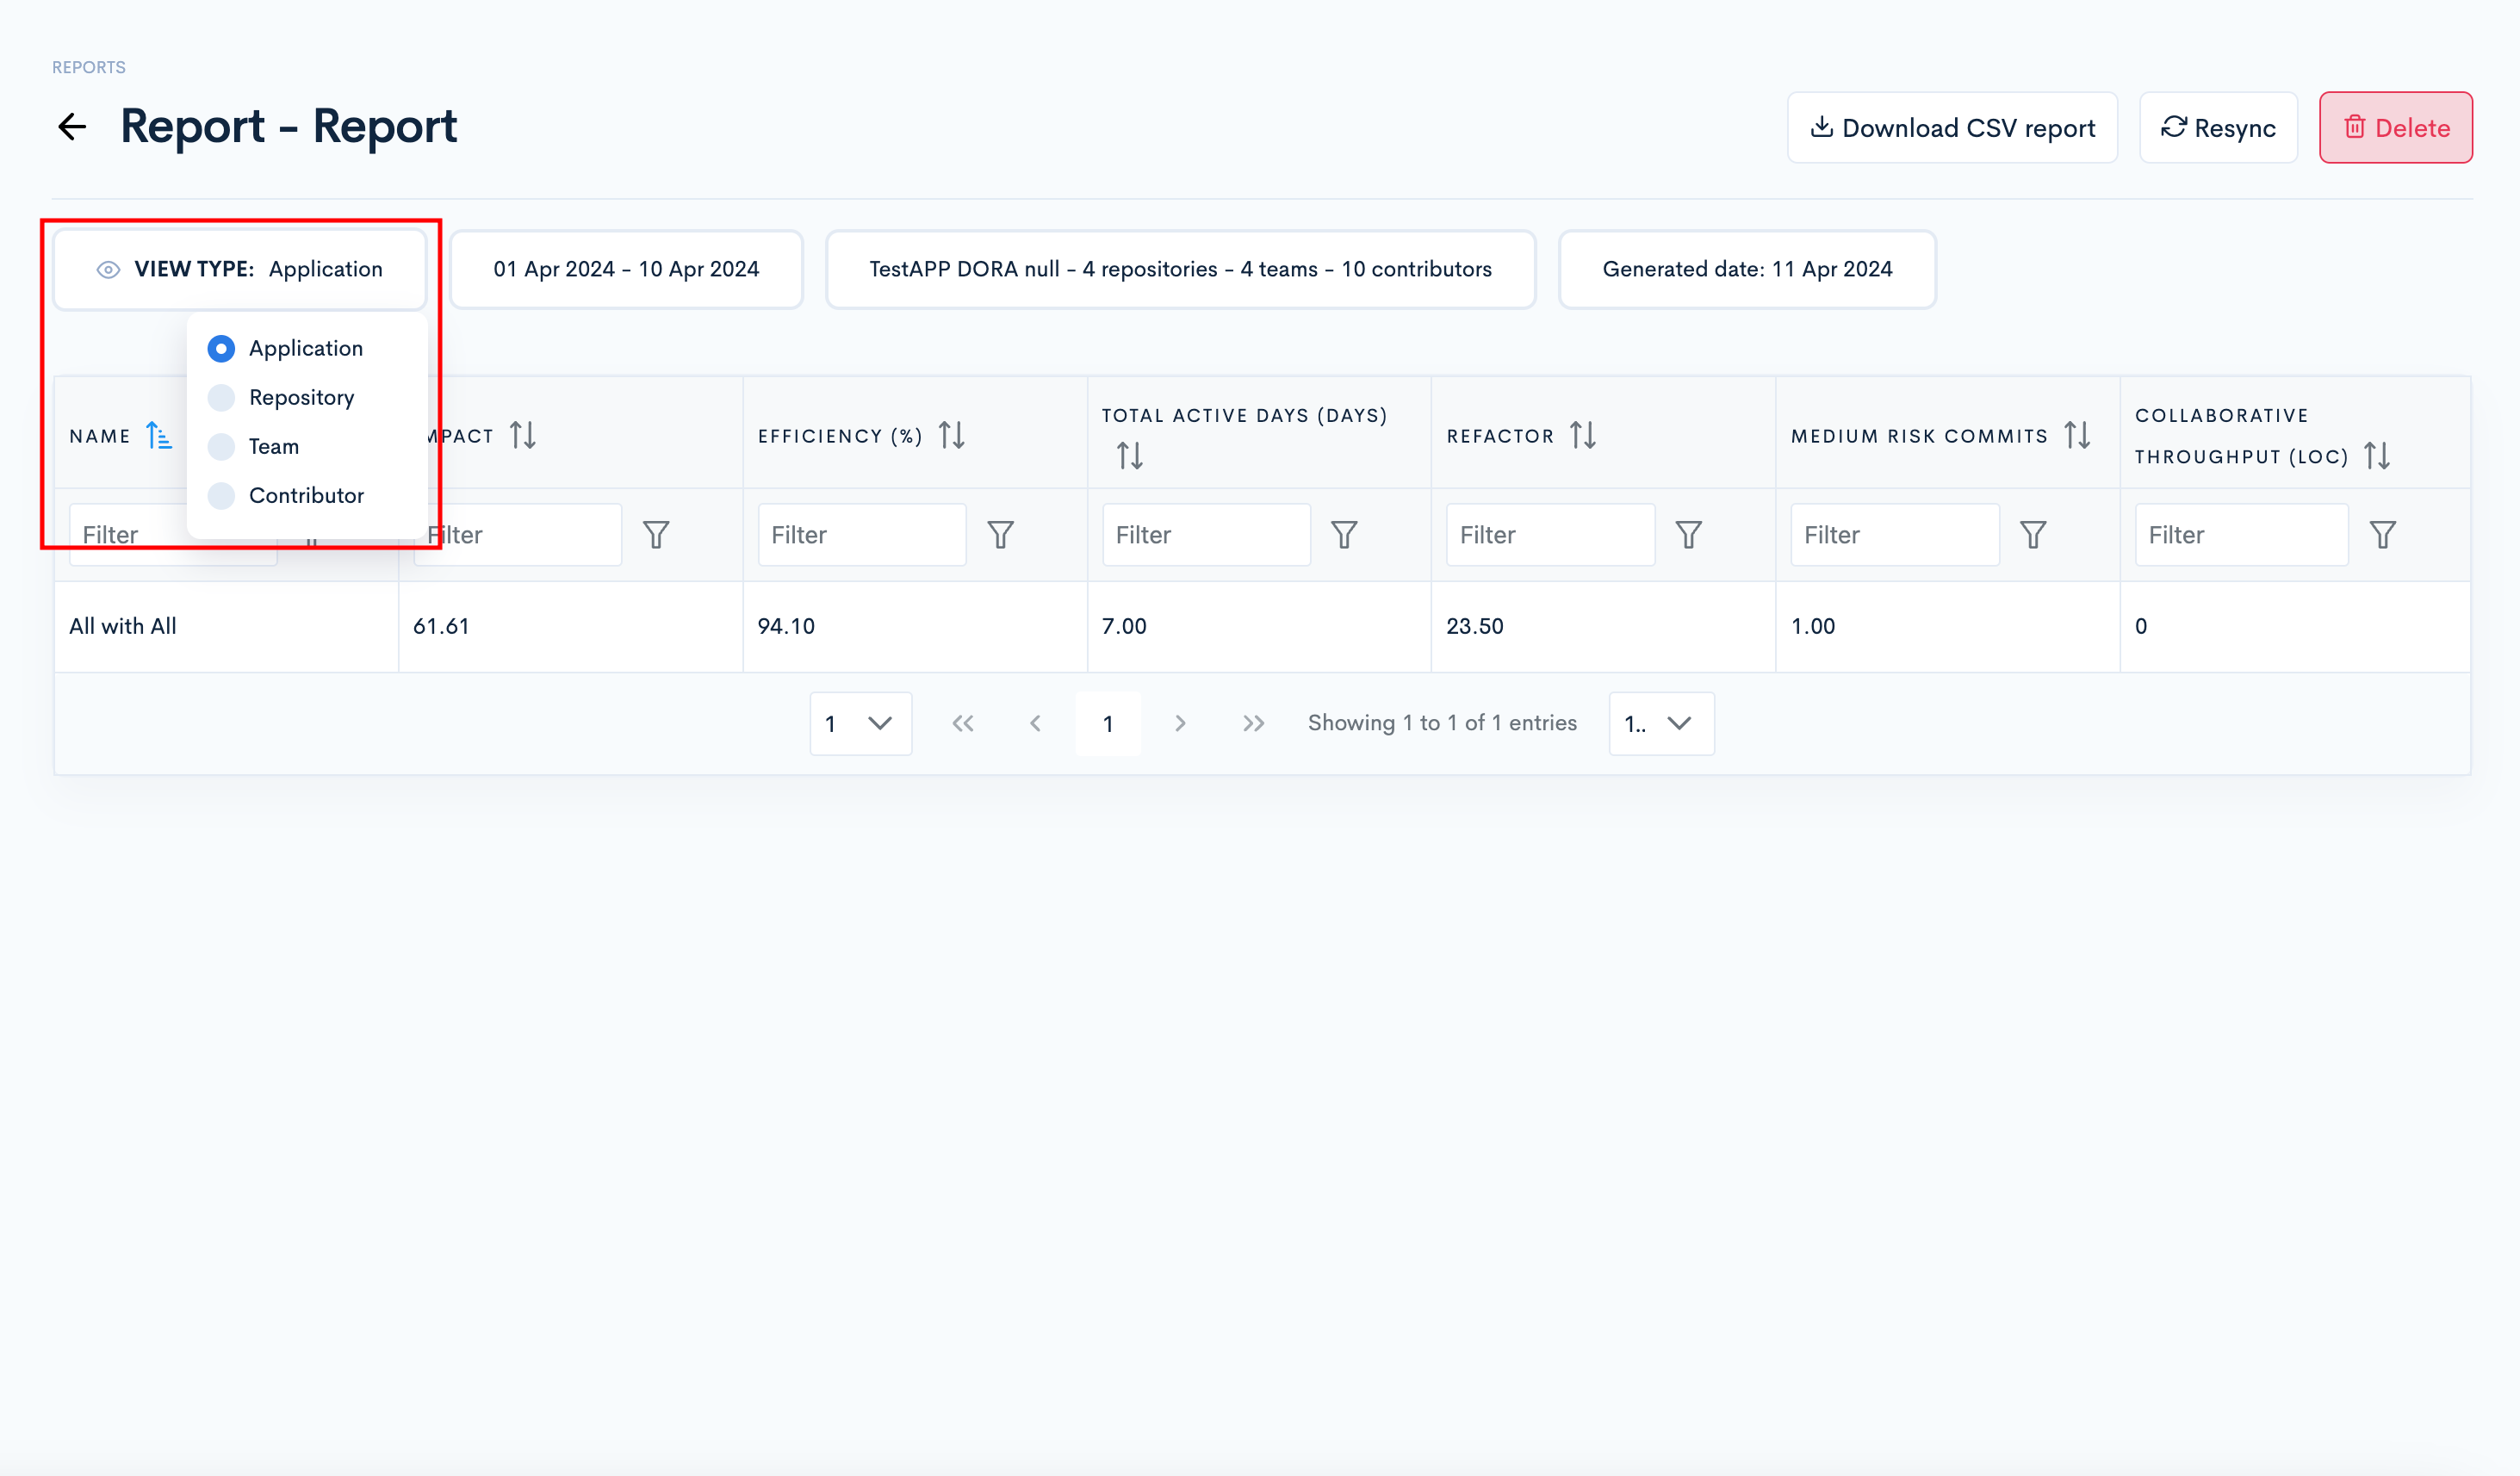
Once generated, the report's time frame, applications, teams, repositories, and contributors cannot be modified; only the view type can be changed.
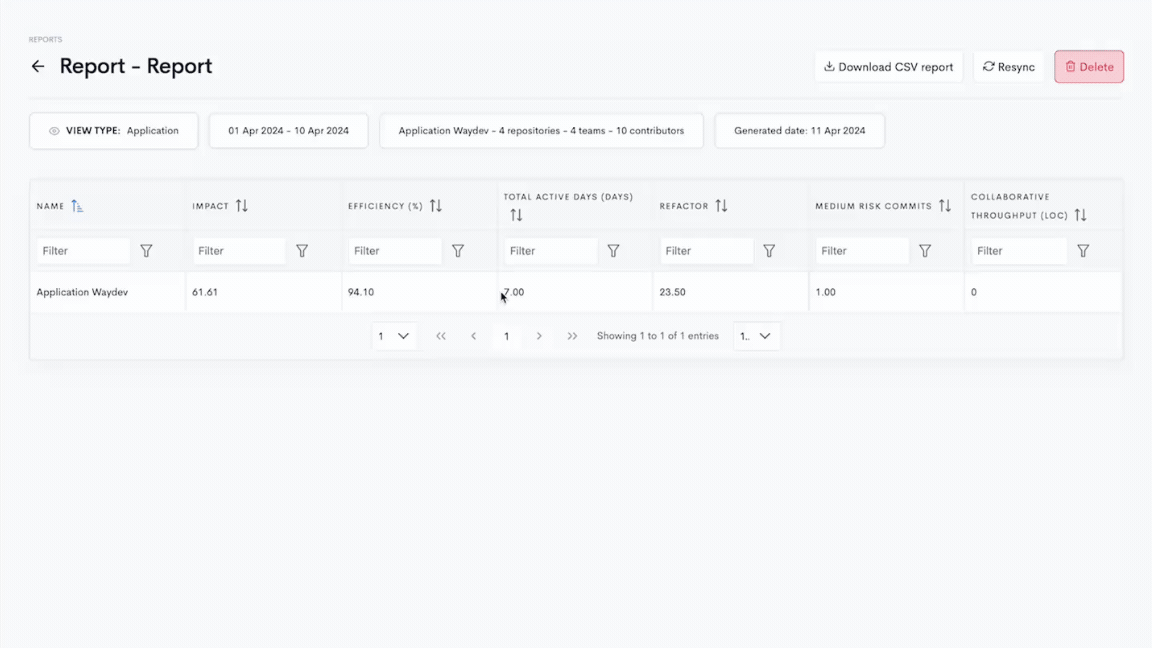
Click on a metric once to sort the values in ascending order (lowest to highest), and click twice to sort them in descending order (highest to lowest).
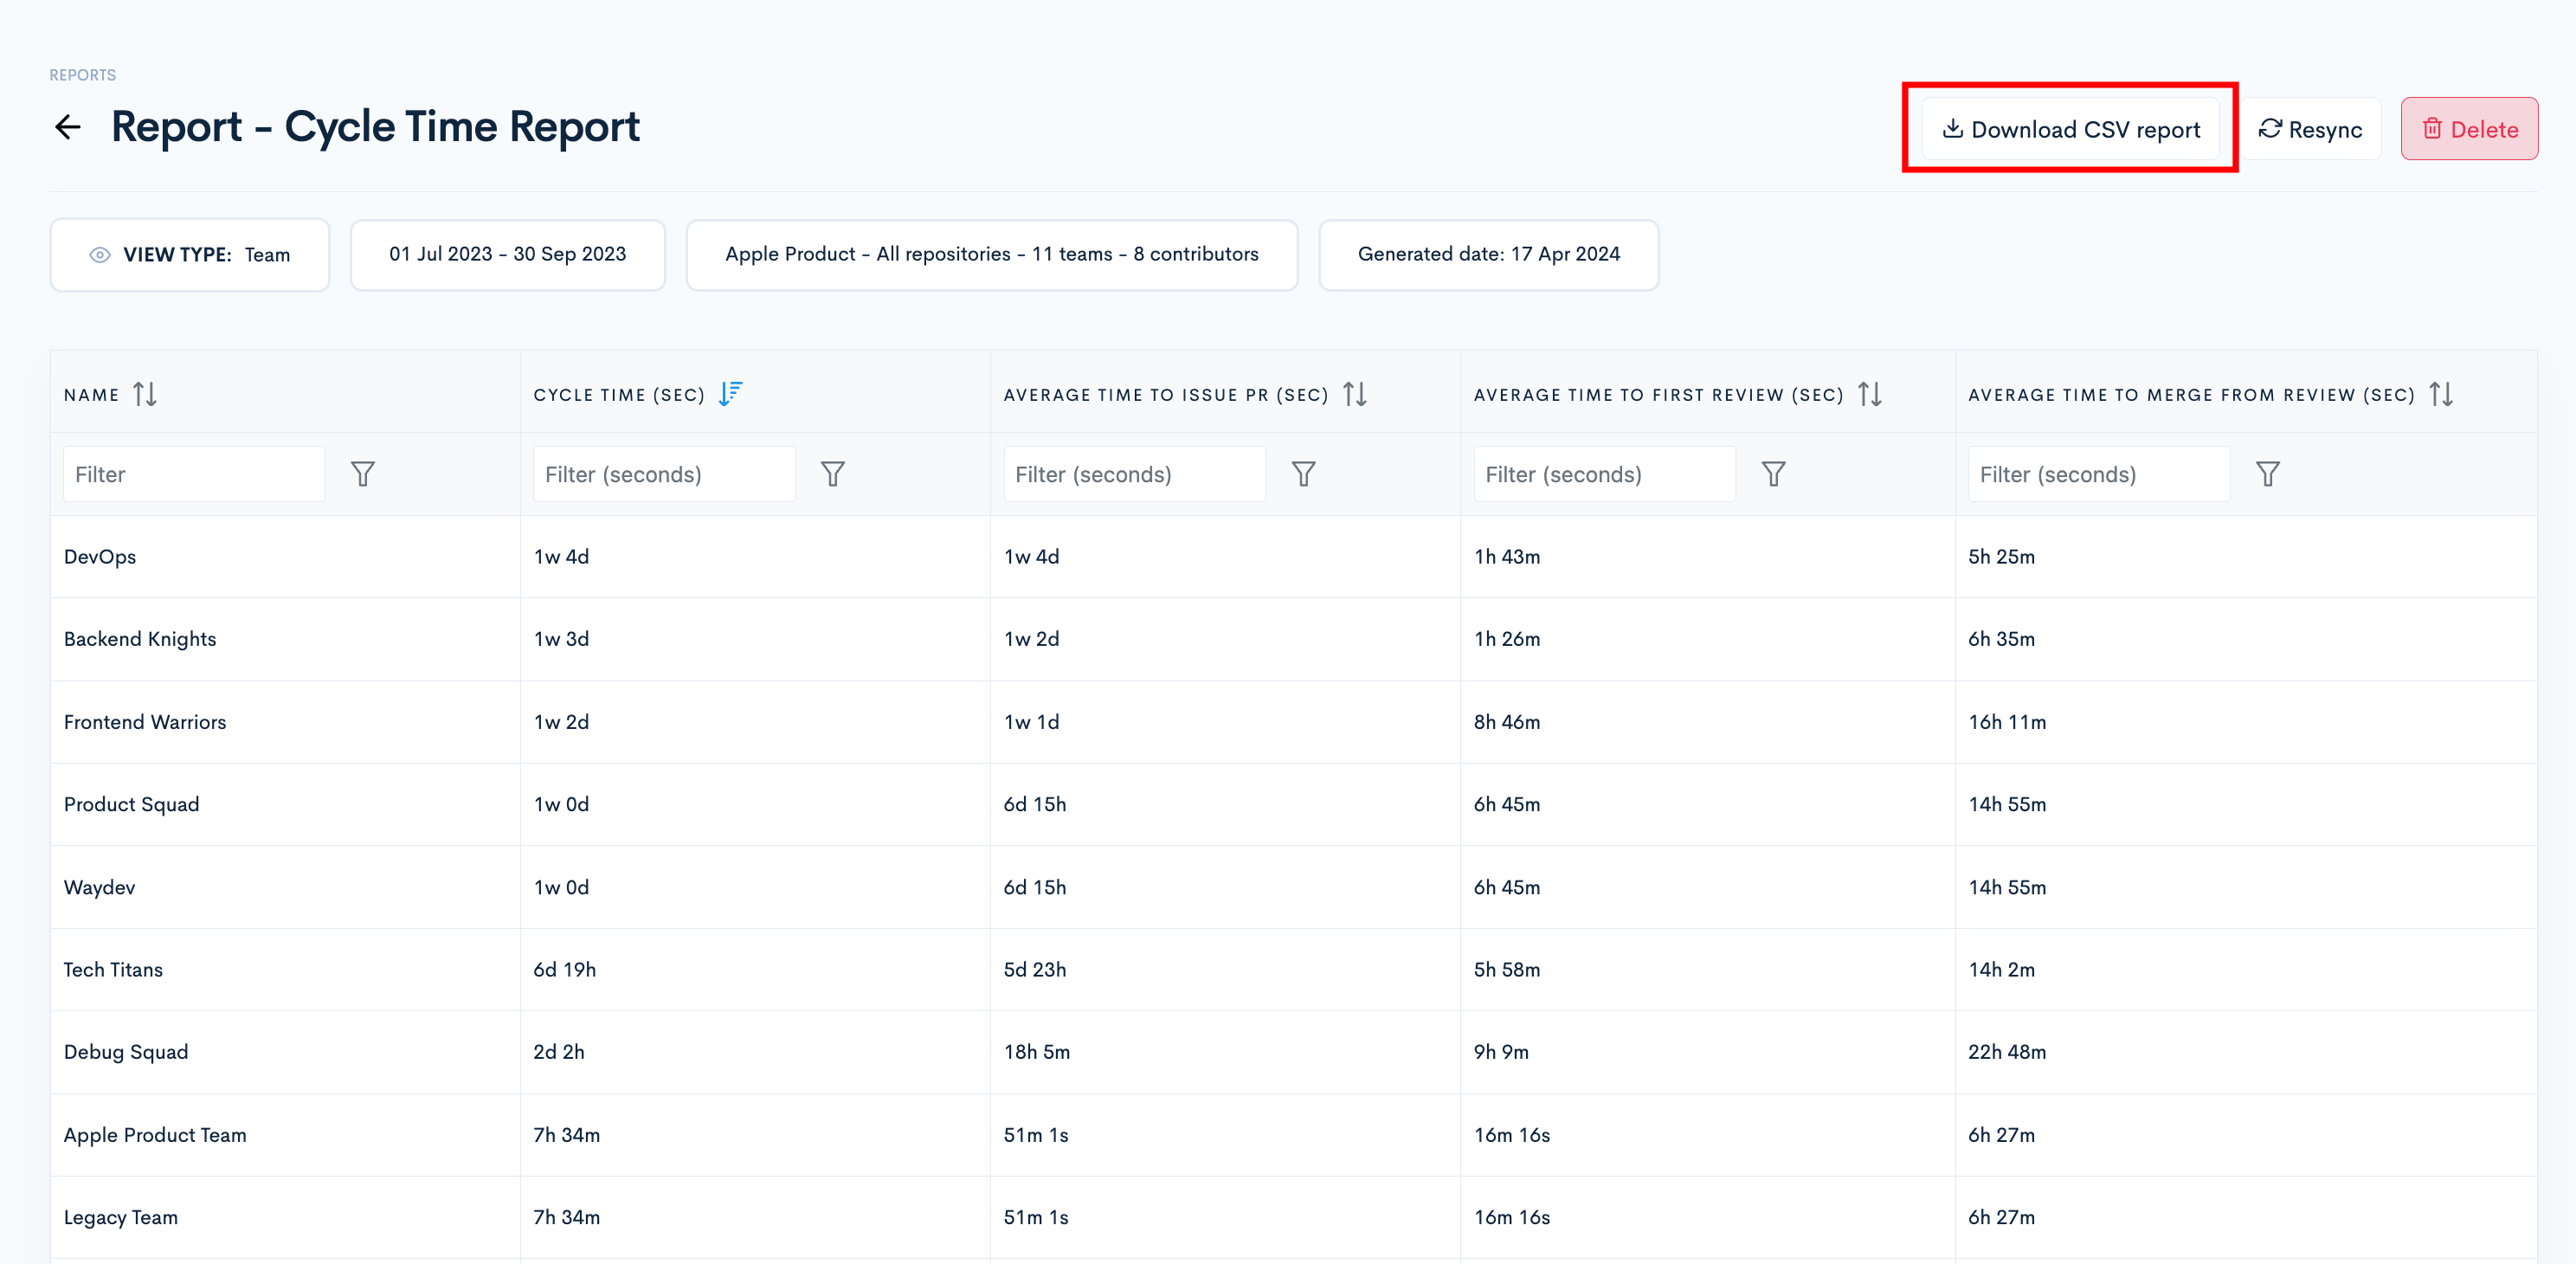
To download the report in a CSV format, click the Download CSV report button from the upper right corner of the page.
Reports created are currently only accessible to the creator. To share a report with team members or colleagues, please export it as a CSV file.
Updated 10 months ago