

Team Insights
The "Team Insights" dashboard provides a comprehensive summary of your teams' recent activities, enabling you to better understand their contributions and progress.
To see this report, navigate to Team Insights in the Health section.
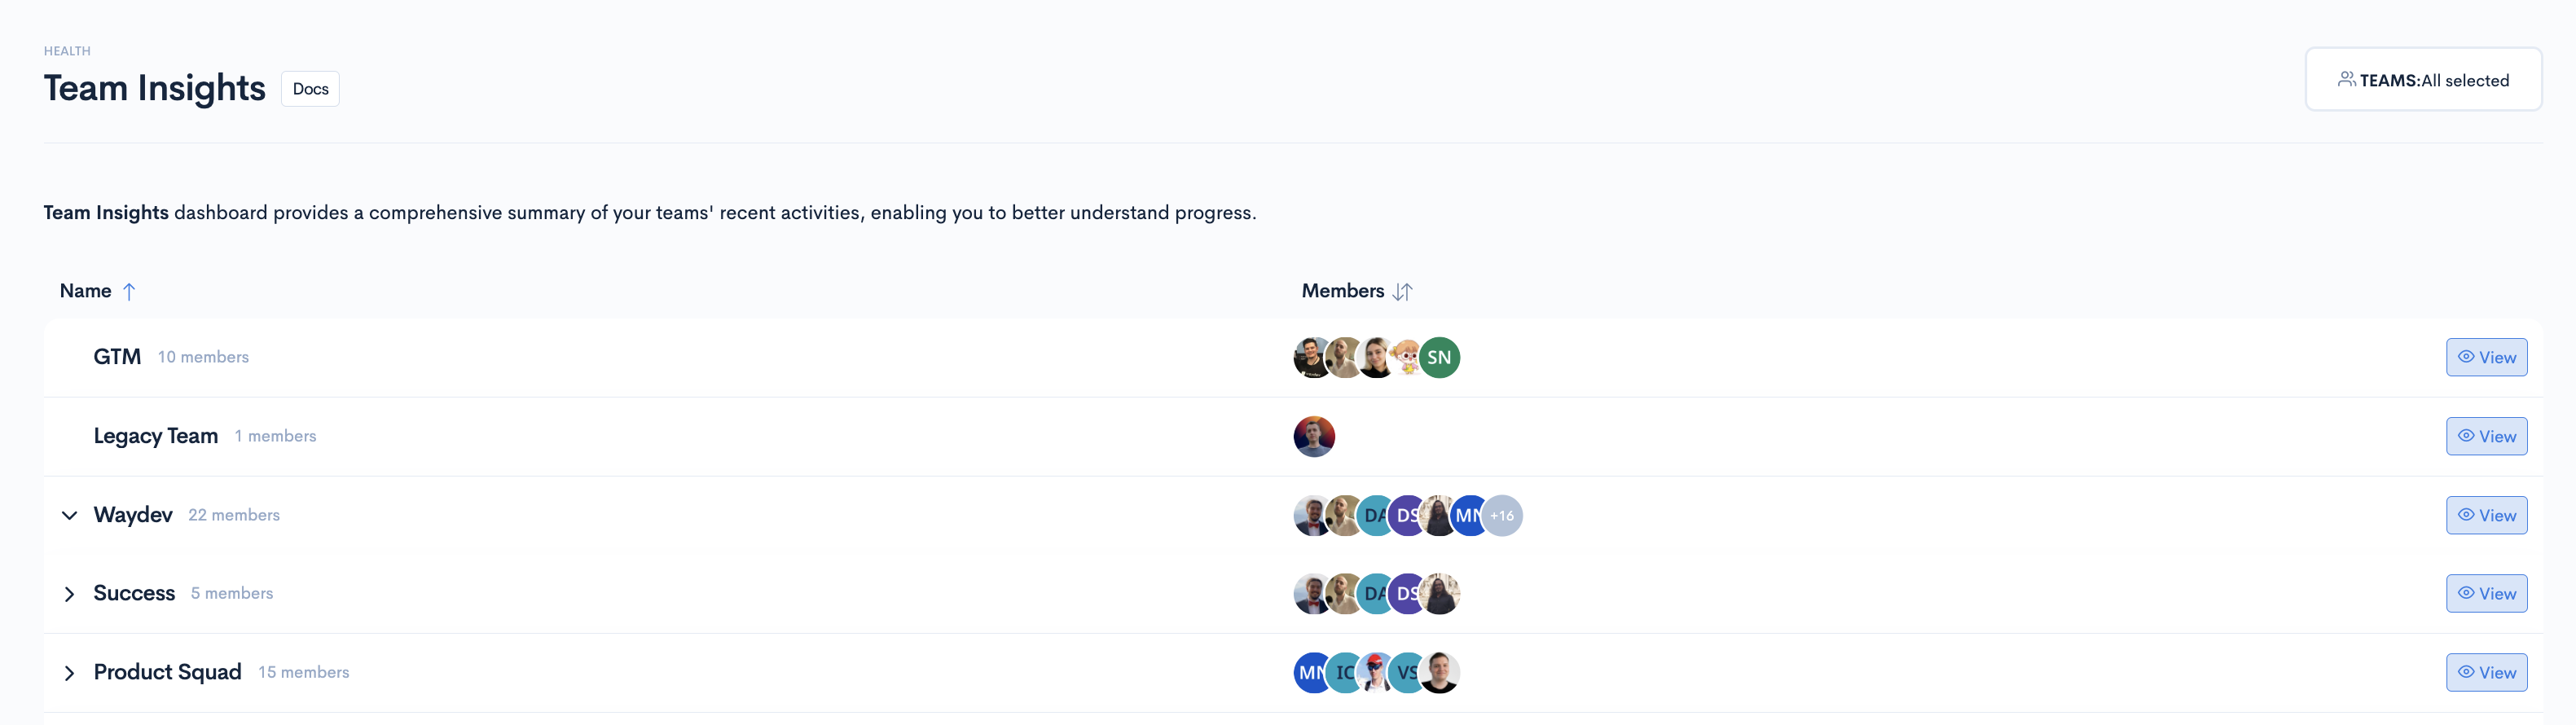
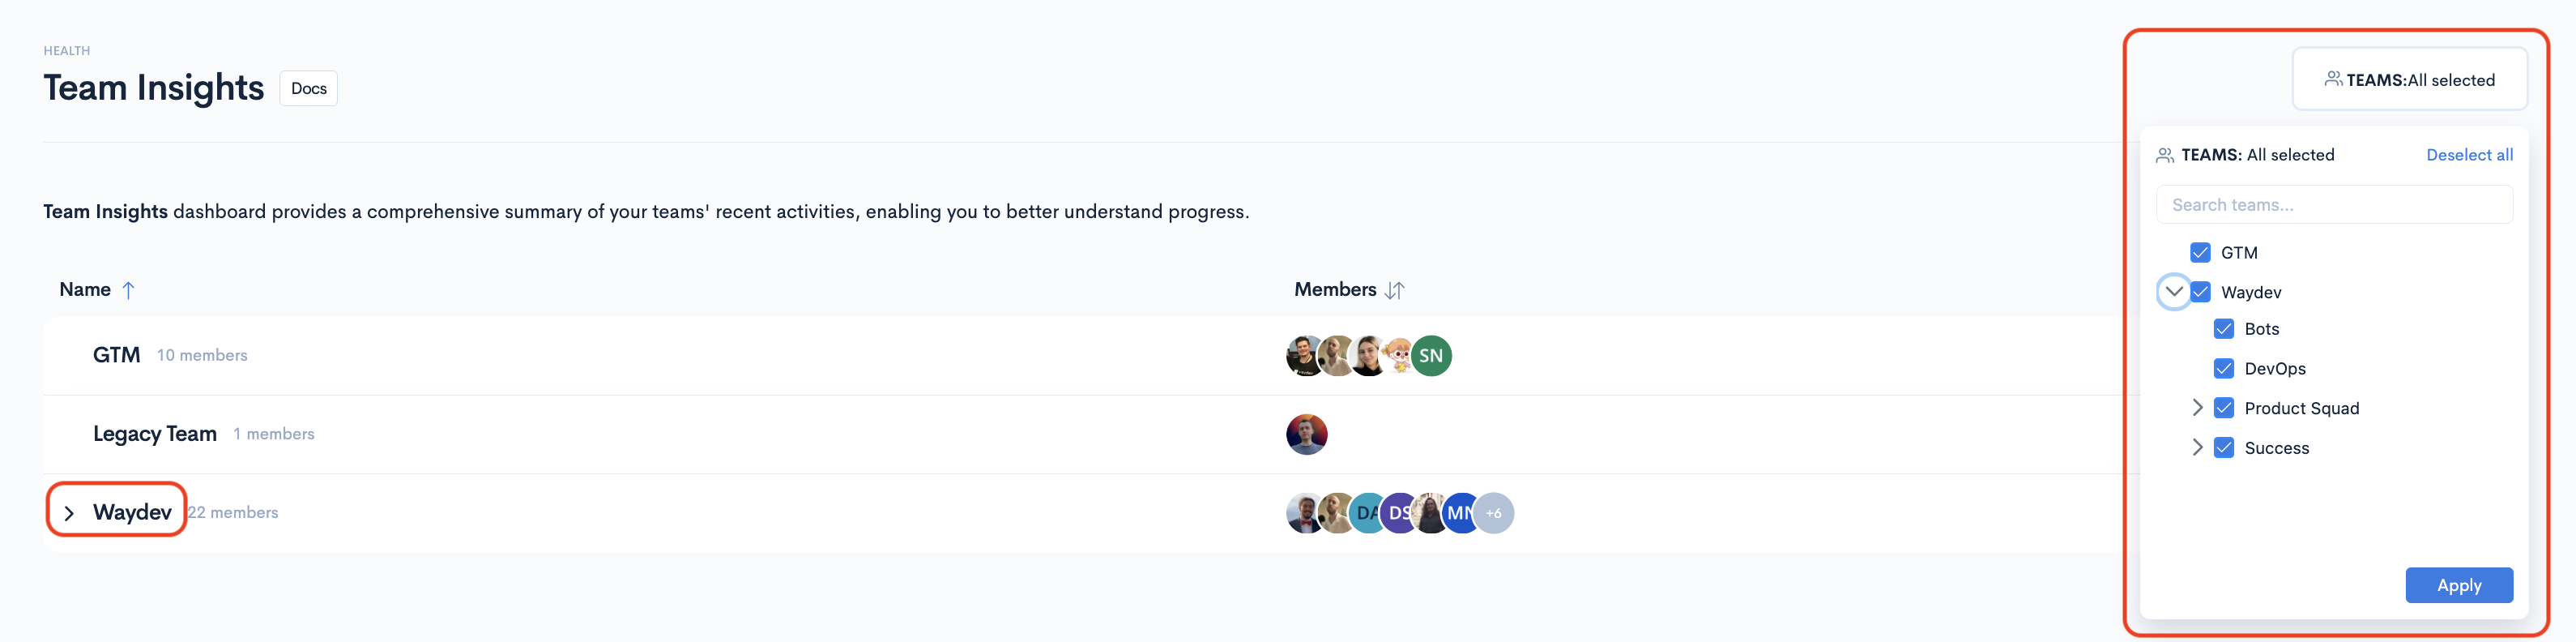
Select the team you want to see insights for from the drop down in the upper-right corner of the screen or from the "All Teams" list.
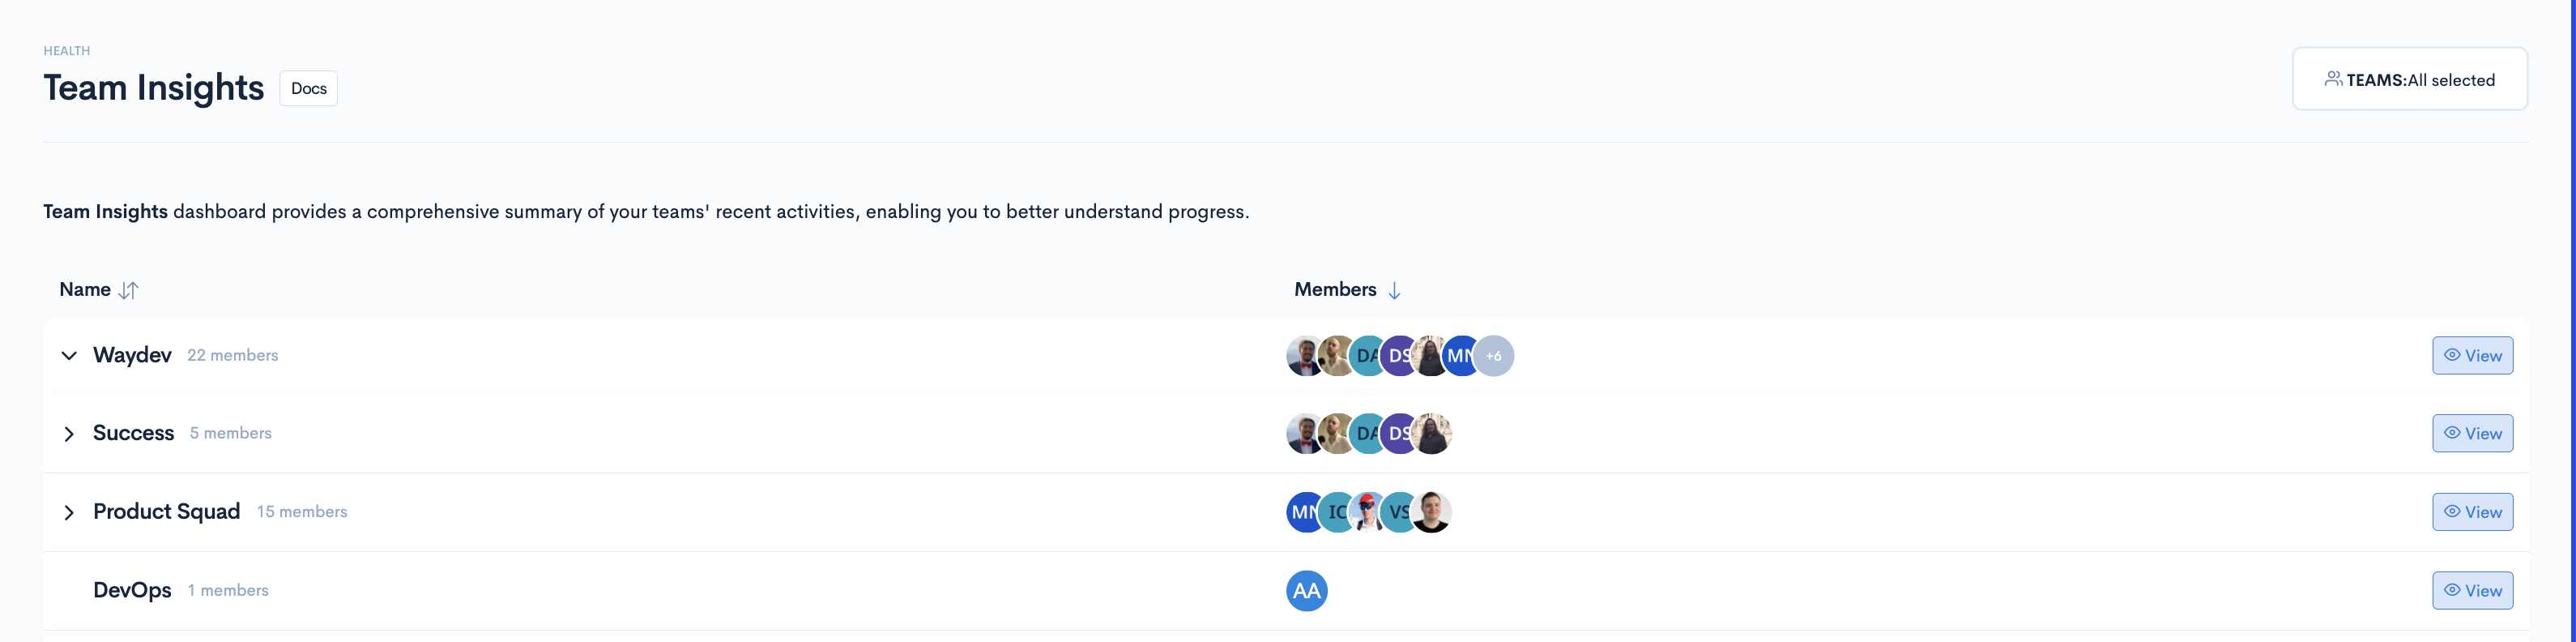
By clicking "Members" your list will be ordered by the number of contributors in the team
Select any team by clicking on its name. This will take you to the team's "Team Insights" dashboard.
Snapshot
This includes data from the last 4 weeks.
In the snapshot section of the "Team Insights Page" you will see:
- The selected team's Cycle Time
- The selected team's Work Heatmap
- The selected team's total number of commits
- The selected team's Pull Request Activity
- The selected team's Most Active Pull Requests
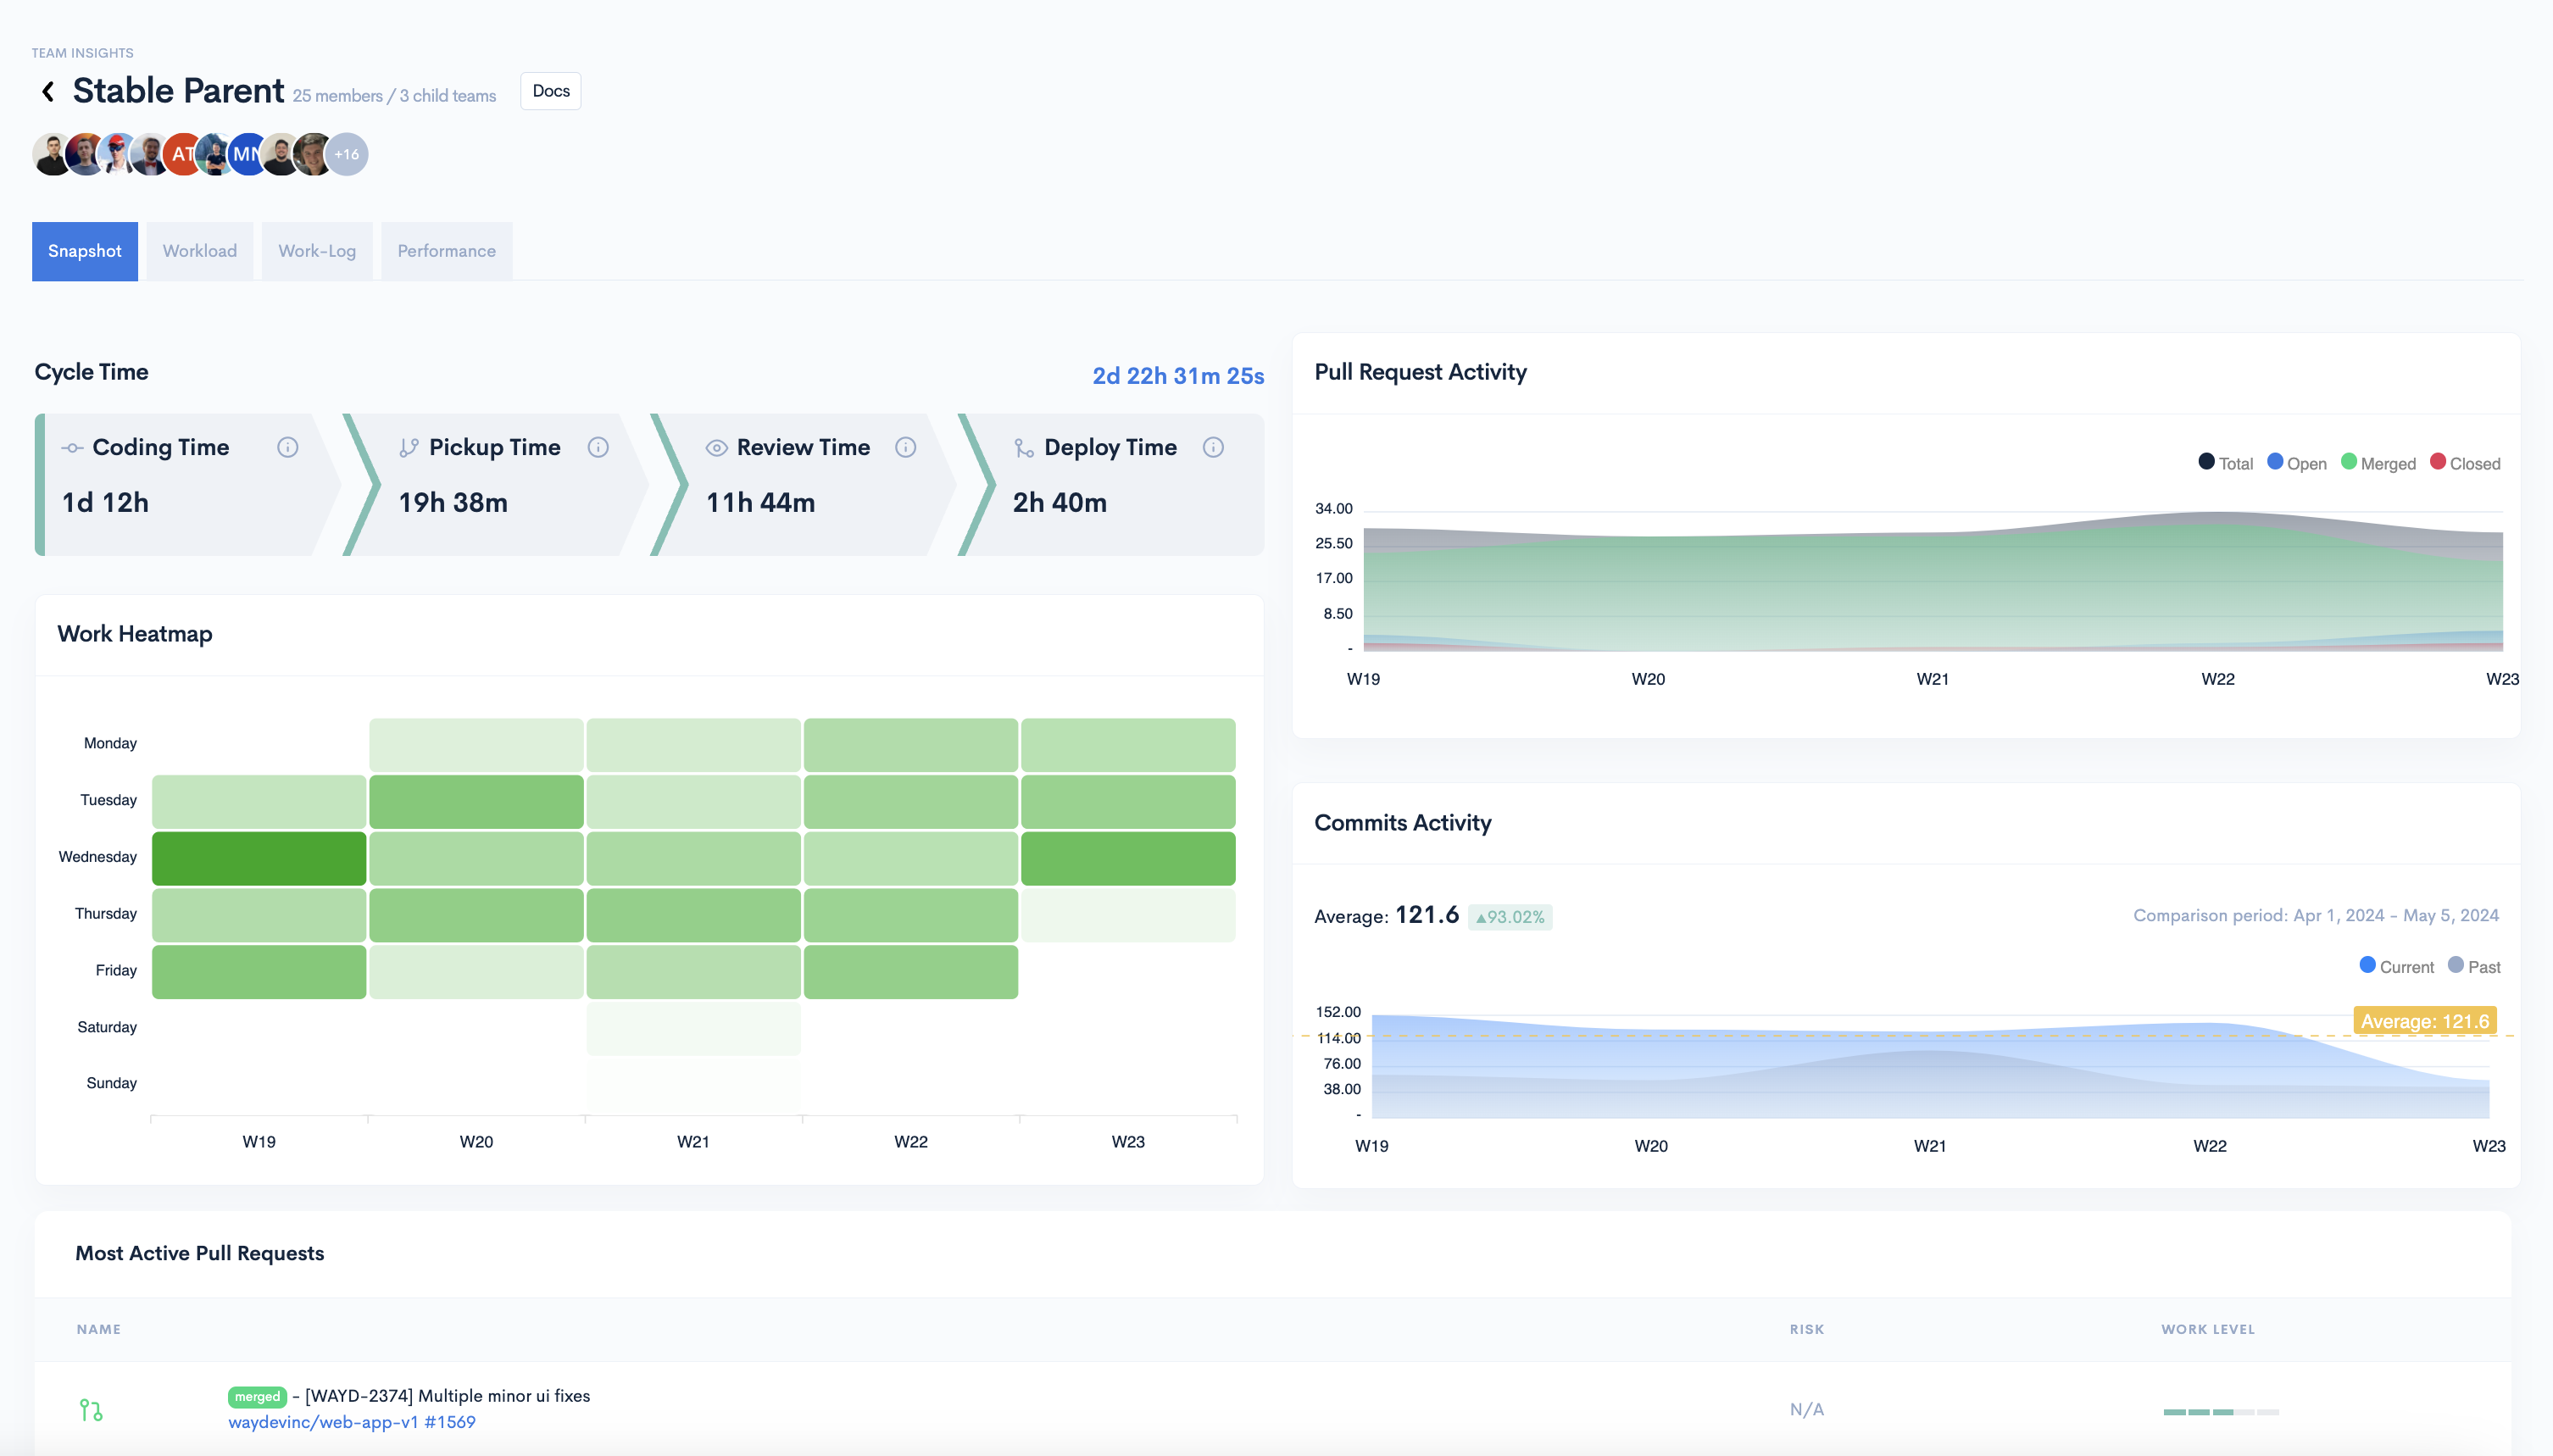
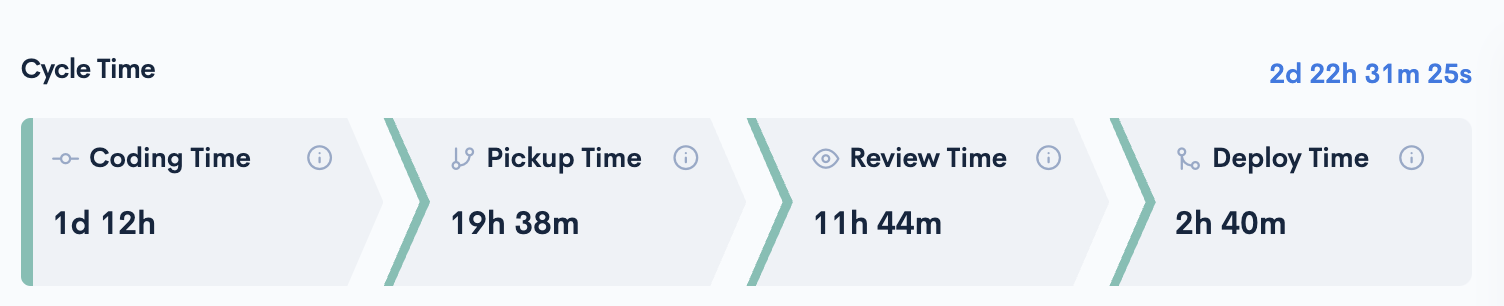
Cycle Time
The Cycle Time indicates an team's development velocity. The Cycle Time is the sum of four metrics, each of these metrics corresponding to a stage in the software development process:
CODING - Time to Issue PR from First Commit. This metric corresponds to the coding time and is the time elapsed from the first commit to creating a PR.
PICKUP - Time to First Review. This metric indicates how fast reviewers pick up their peers' PRs for review and is the time between when a PR is opened and the first time an engineer reviews that PR.
REVIEW - Time to Merge from First Review. This metric signifies how fast do submitters incorporate feedback from their peers in code review and is the time from a PR's first review to that PR being merged.
DEPLOY - Time to Deploy from Merge. This metric is an indicator of how fast code gets deployed into production and is the time between when a PR is merged to when it gets released into production.
What does each color indicate?
- For CODING:
Green: Less than 48 hours
Yellow: Between 48 and 72 hours
Red: More than 72 hours
- For PICKUP:
Green: Less than 24 hours
Yellow: Between 24 and 72 hours
Red: More than 72 hours
- For REVIEW:
Green: Less than 24 hours
Yellow: Between 24 and 72 hours
Red: More than 72 hours
- For DEPLOY:
Green: Less than 10 hours
Yellow: Between 10 and 24 hours
Red: More than 24 hours
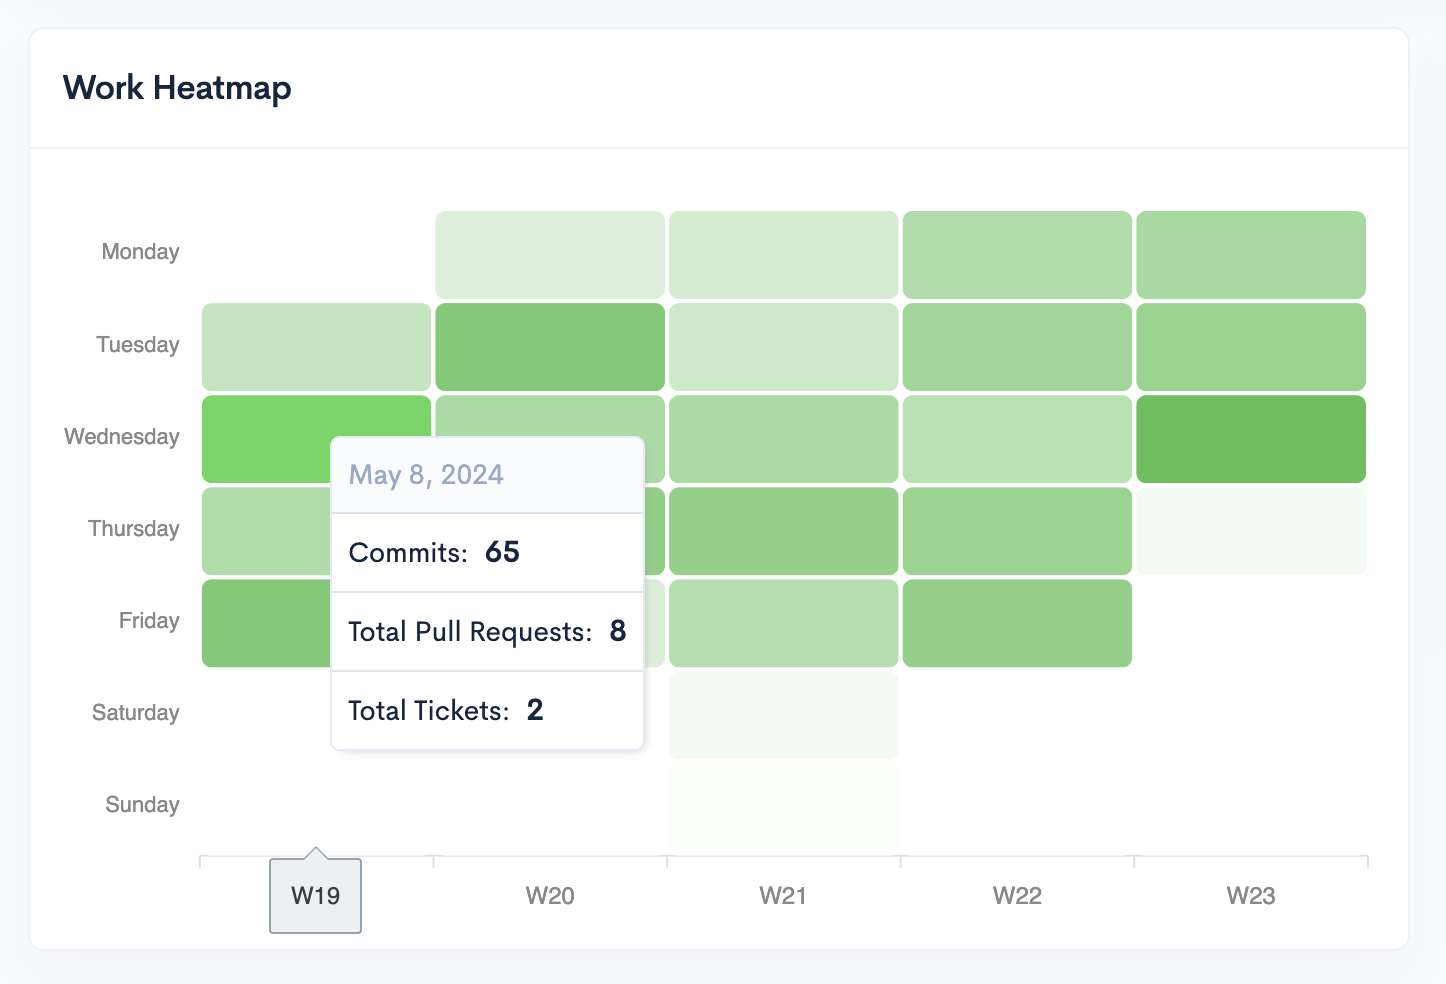
Work Heatmap
The Work Heatmap offers more clarity on the days a team has been active based on commits, PRs, and tickets.
Each column represents a week, and you can see all activity from the past 5 weeks.
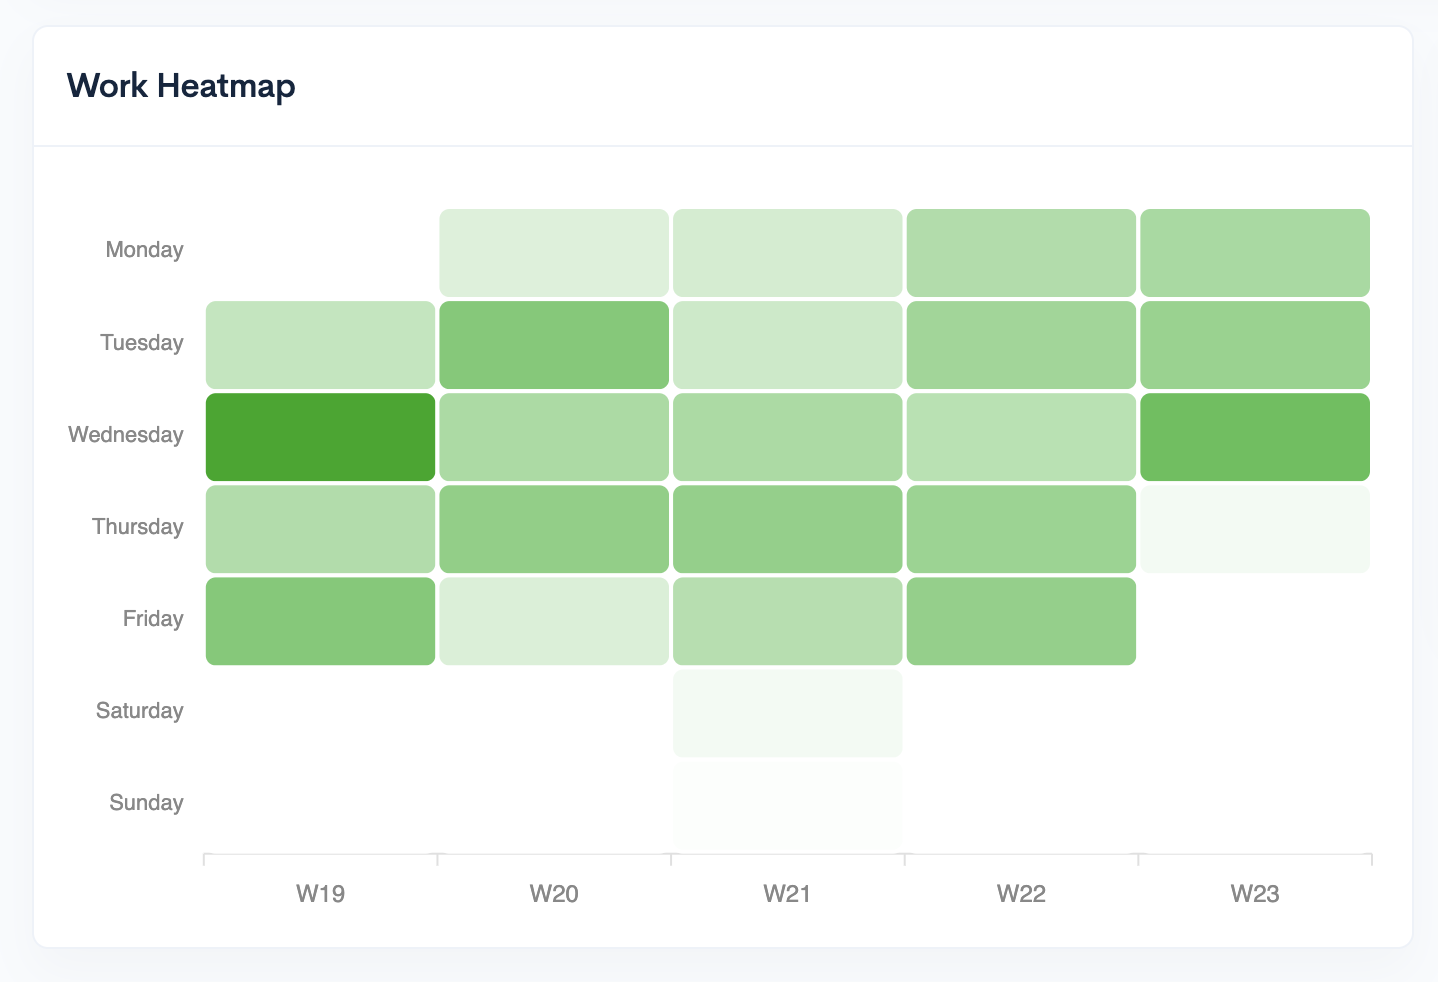
By hovering over any figure, you'll see the activity for that specific day (number of commits, Pull Requests and Tickets) (the brighter the green, the higher the work involvement.)
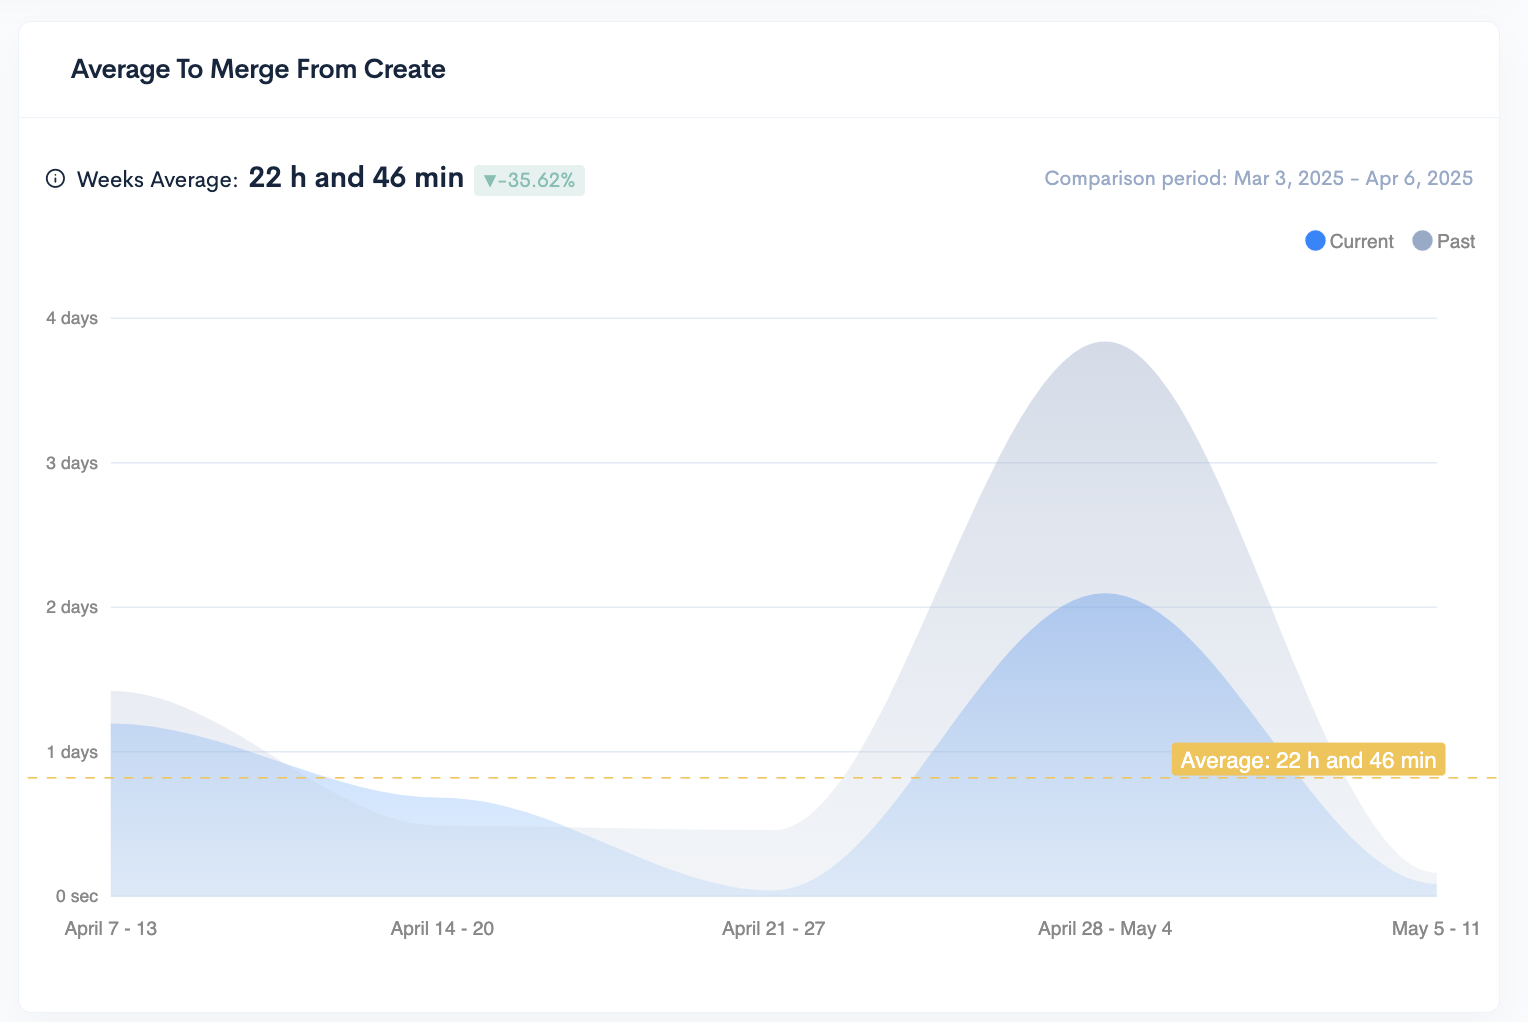
Average To Merge From Create
Measures the average time it takes for a pull request (PR) to be merged from the moment it is created.
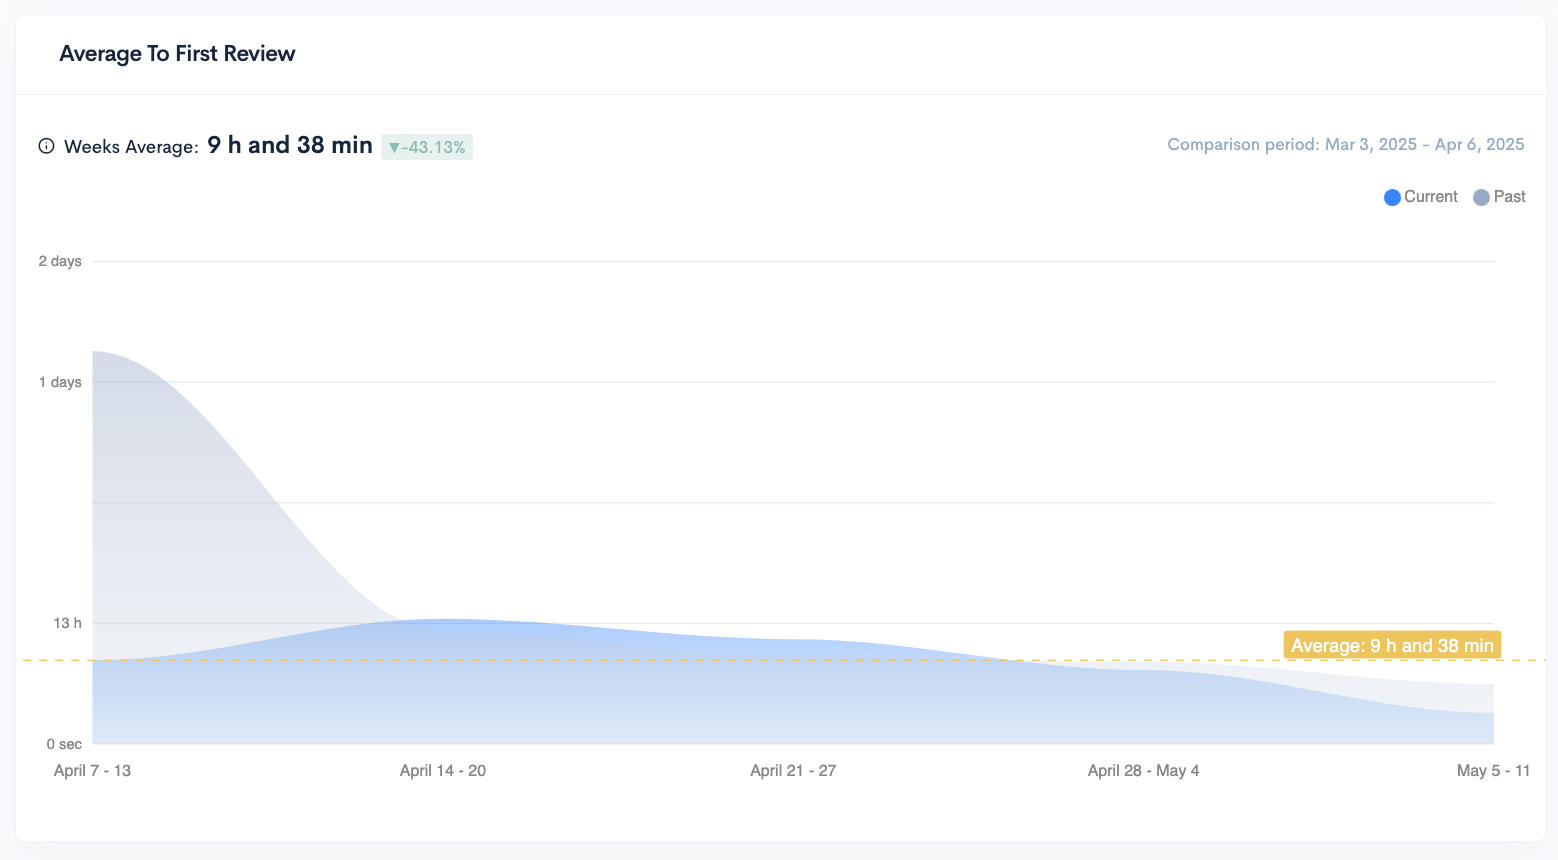
Average To First Review
The average time it takes for the first review to be made on a Pull Request.
Knowledge Sharing Index
The Sharing Index is a metric designed to assess how well your team collaborates on code reviews. It quantifies the distribution of reviews across your team members and considers factors that promote fair and active participation. A higher Sharing Index indicates a more collaborative environment.

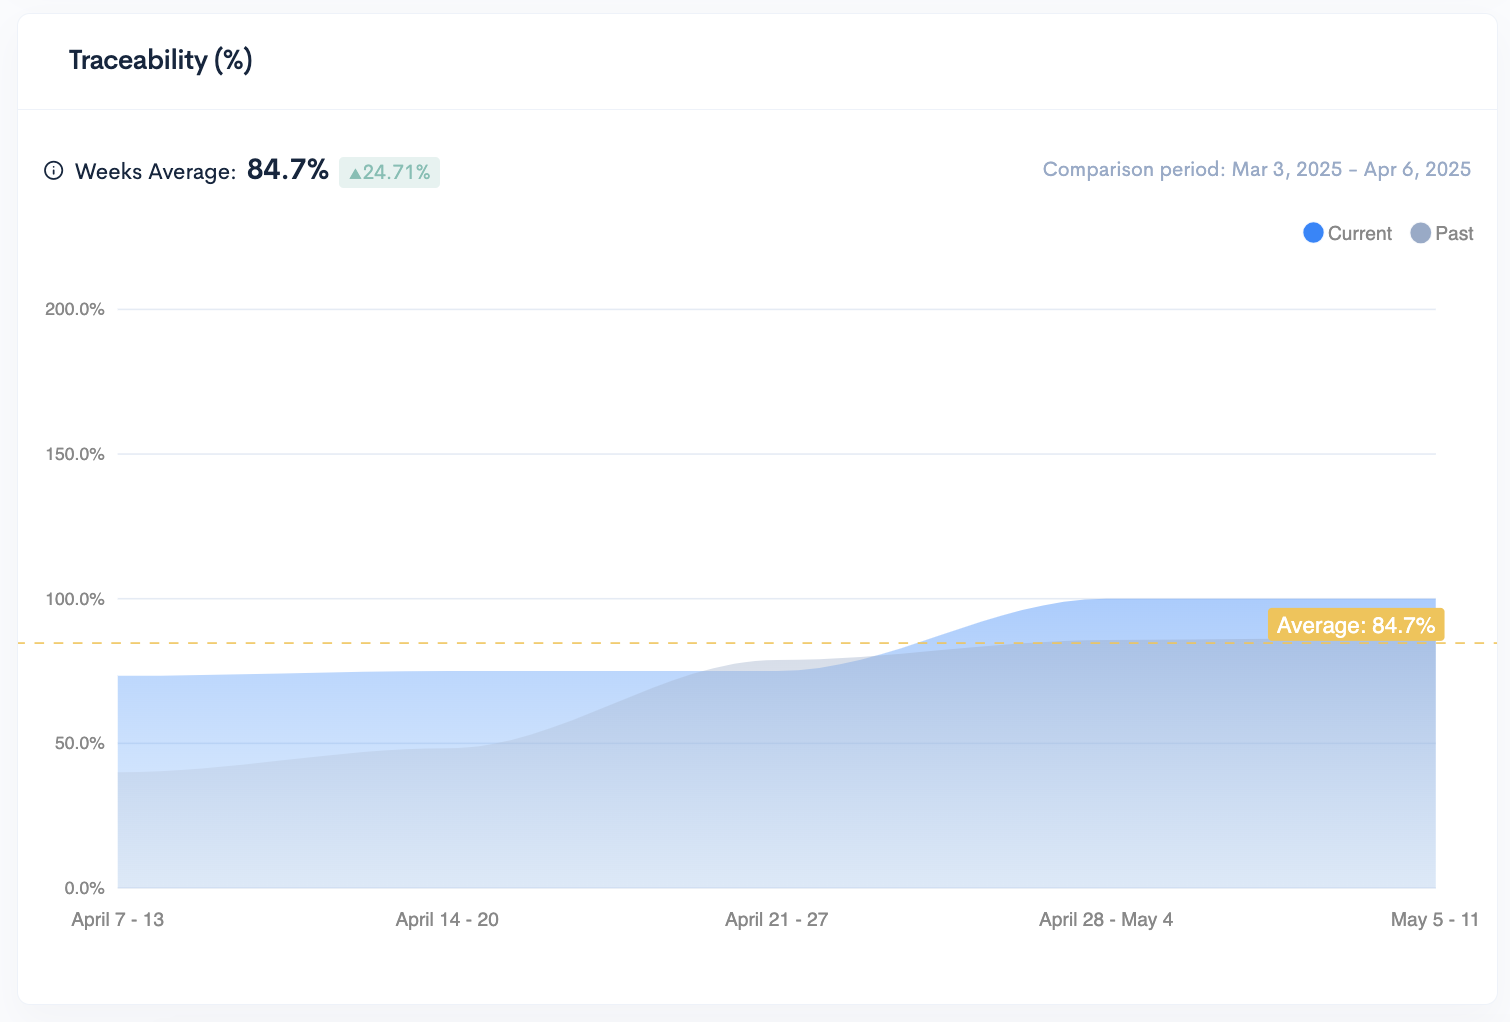
Traceability
Indicates the percentage of commits that are linked to at least one ticket.
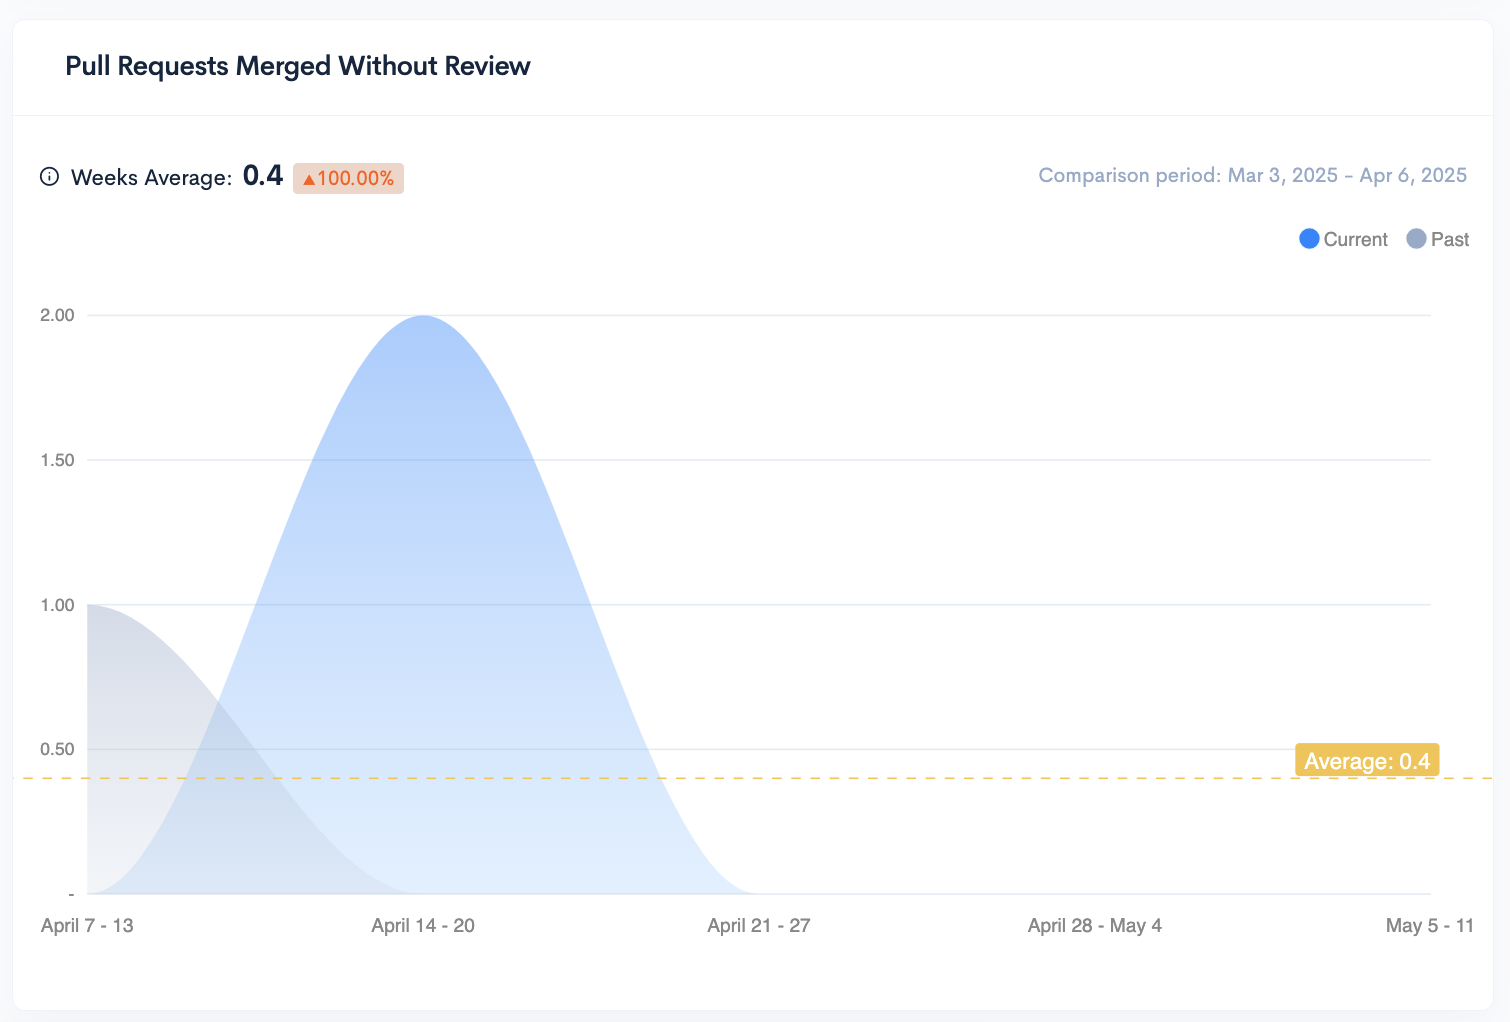
Pull Requests Merged Without Review
Tracks the number of pull requests that were merged into the codebase without undergoing a standard review process.
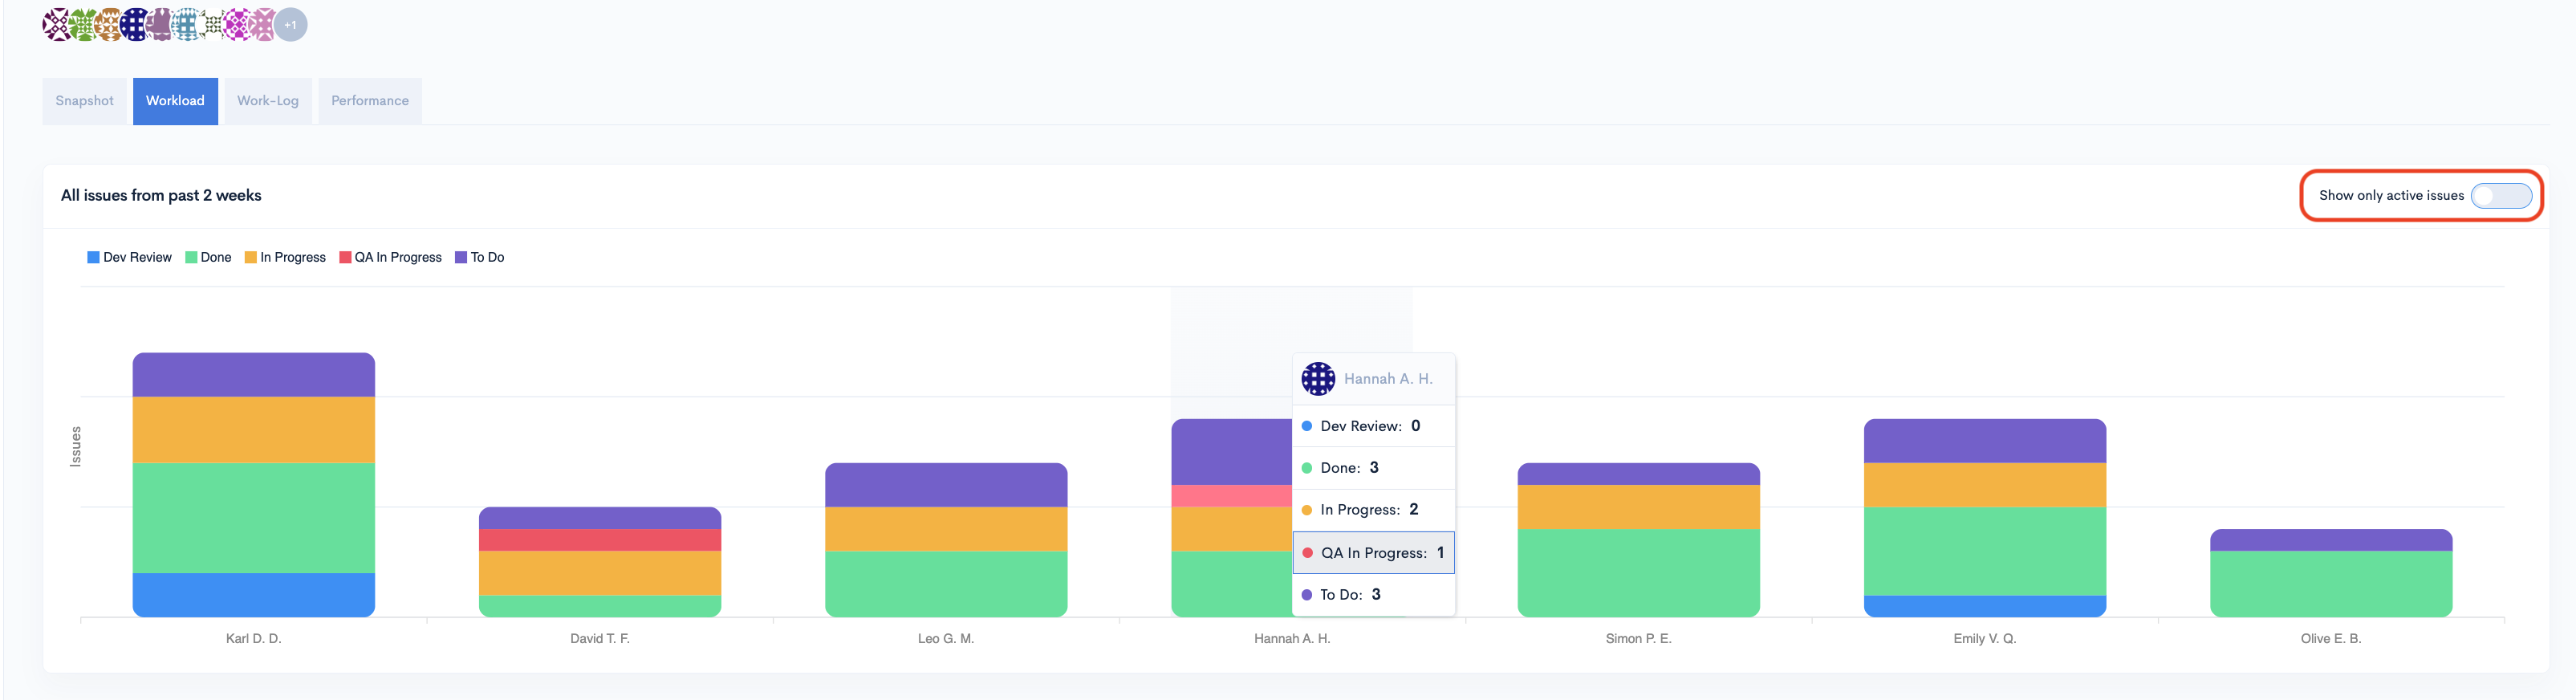
Workload
The workload displays all issues from the past 2 weeks. If you hover over any bar in the graph you'll see a more detailed report for the contributor the bar corresponds to.
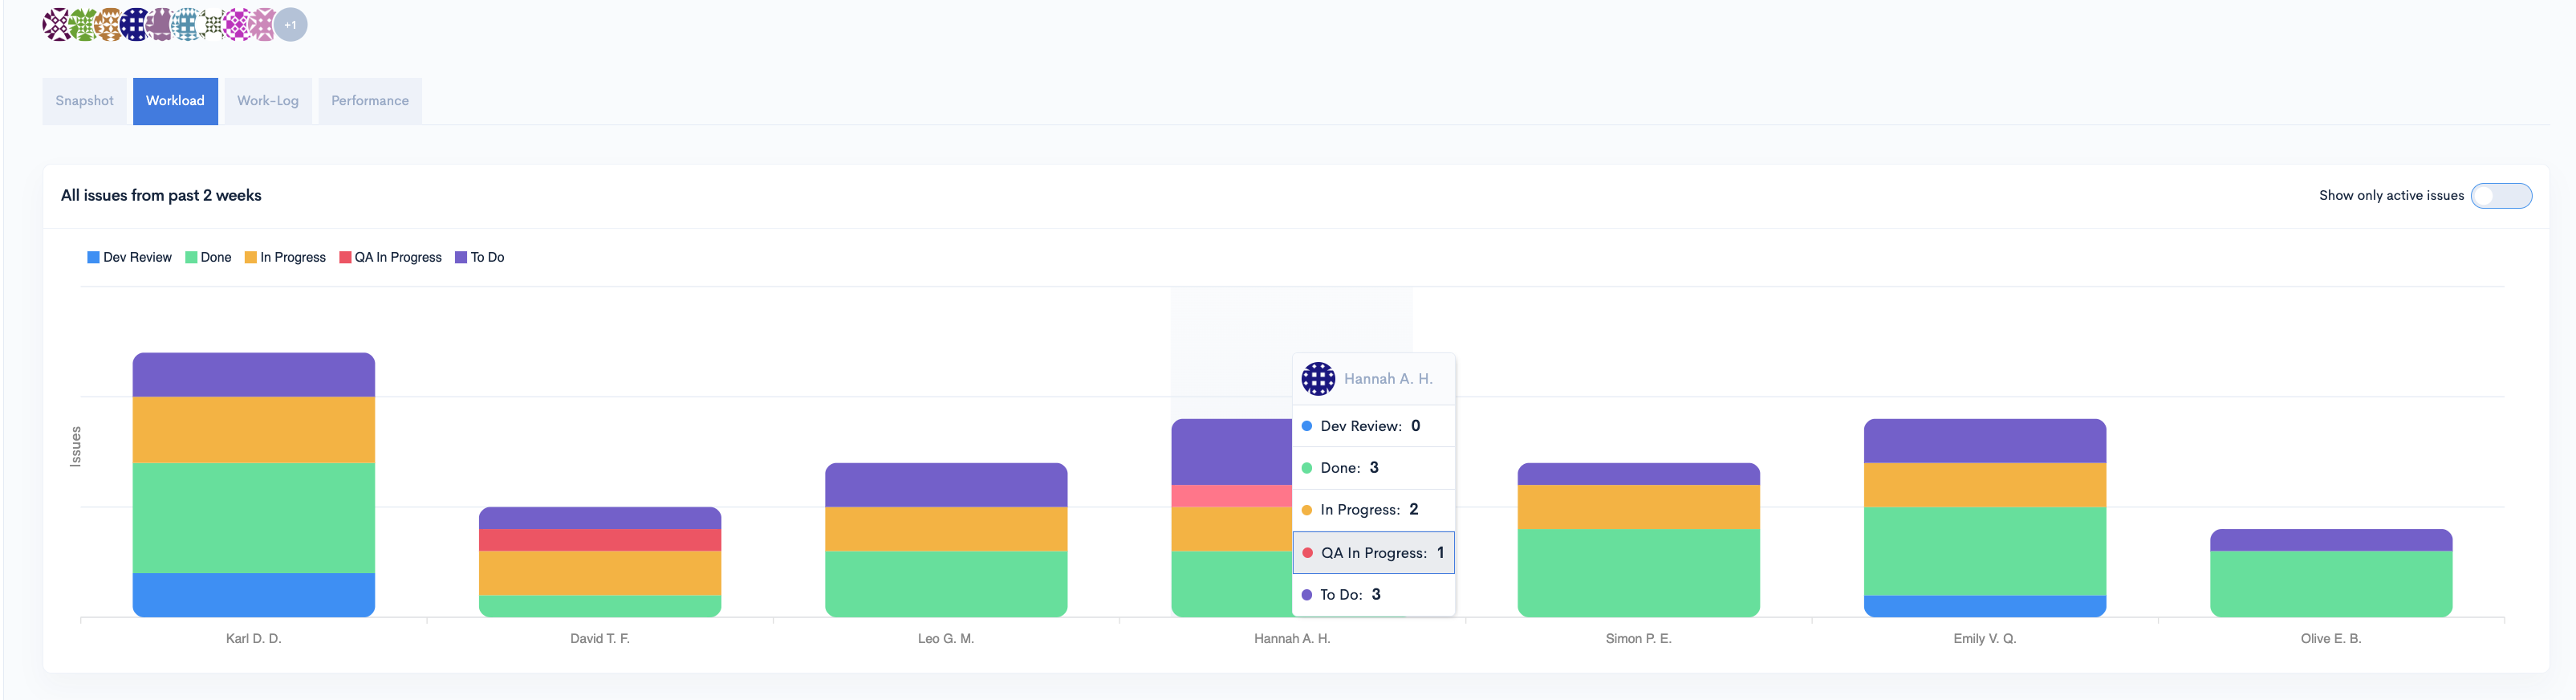
You can view only active issues by switching on the toggle from the upper-right corner of the widget.
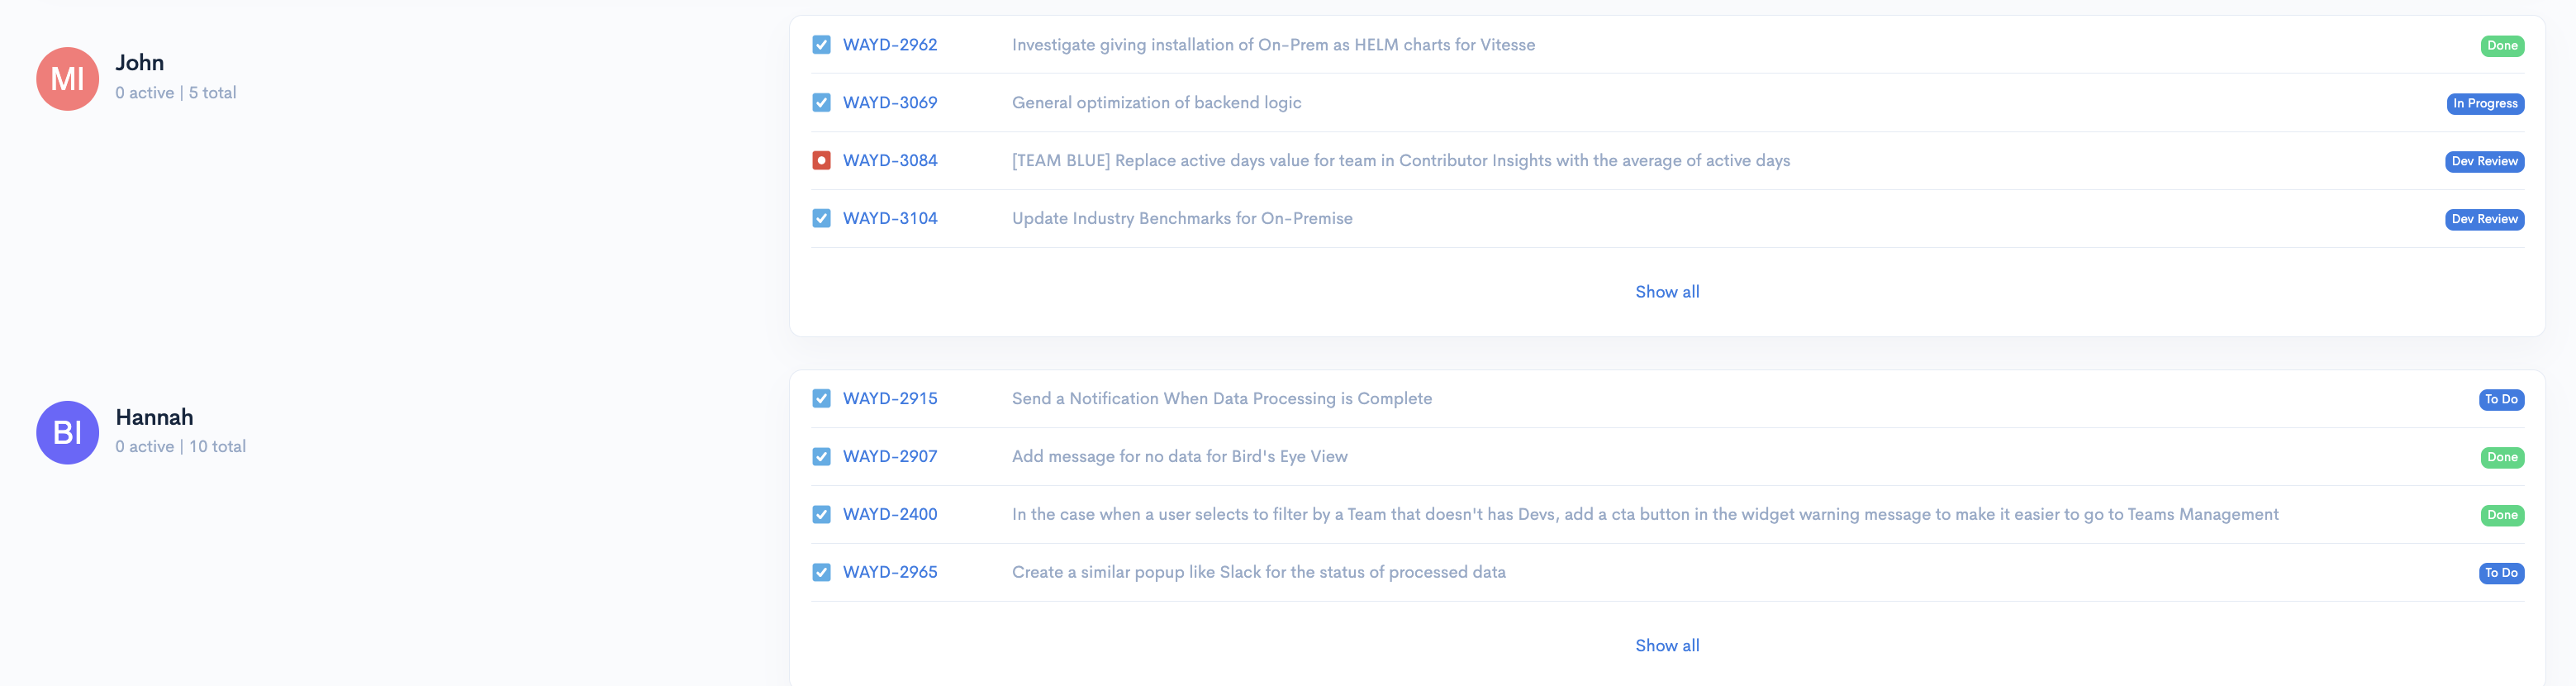
Scrolling down, you will see a breakdown of all issues assigned to each contributor in the selected team.
Work-Log
In the Work-Log section you'll find the Work-Log for the team you selected.
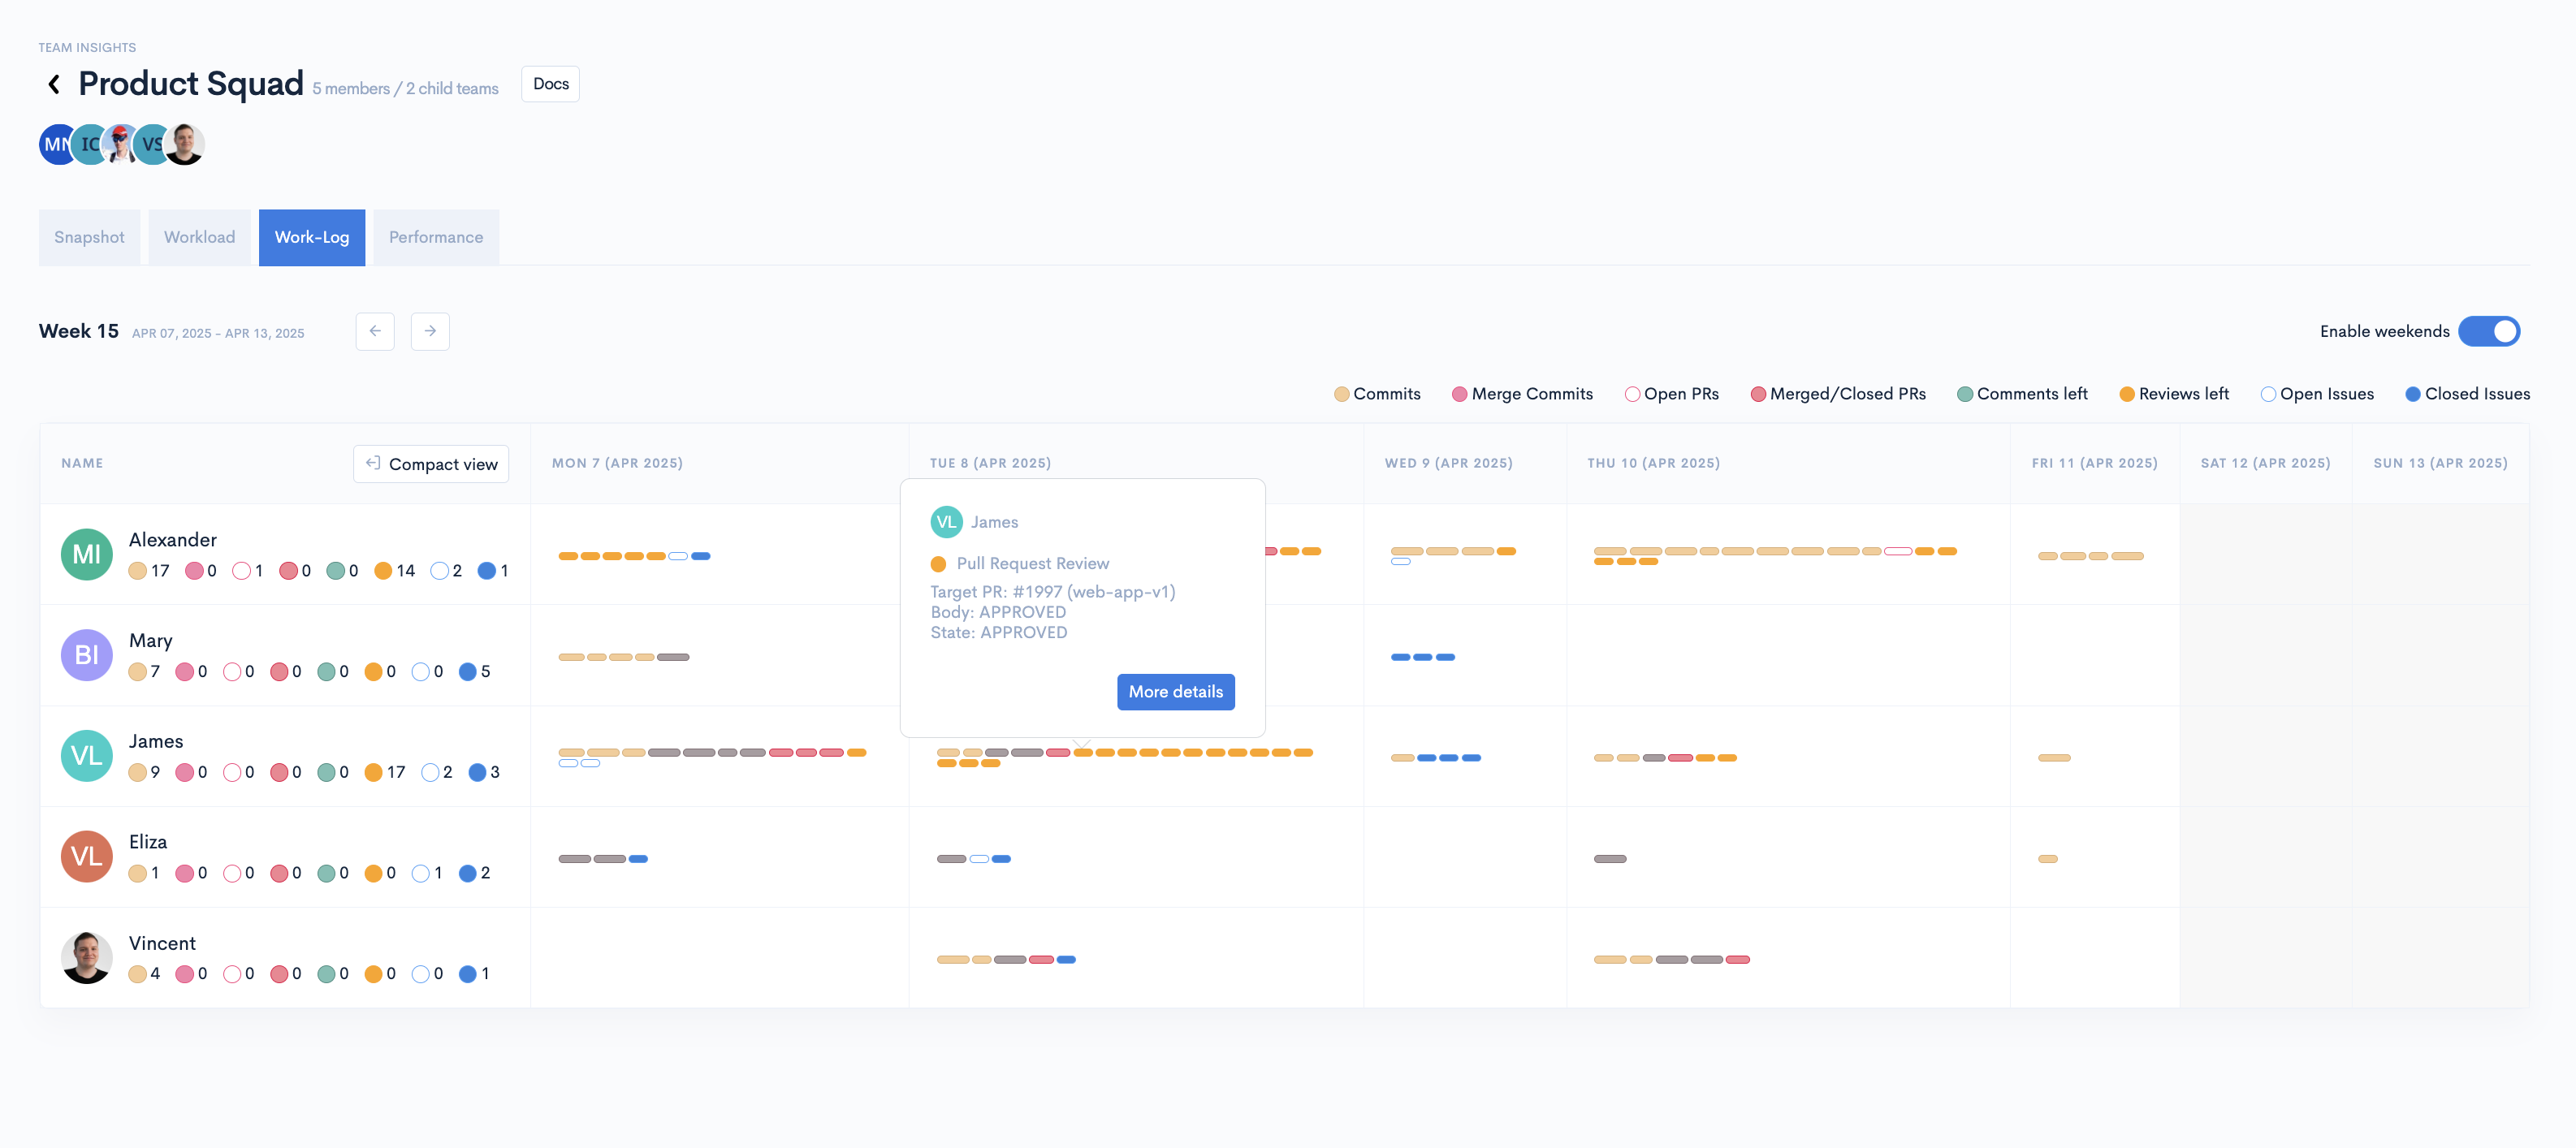
The Work-Log displays several symbols that represent different aspects of your team's work. These symbols include:
- Code Commits
- Merge Commits
- Open PRs
- Merged PRs
- PR Comments
- PR Reviews
- Open Tickets
- Done Tickets
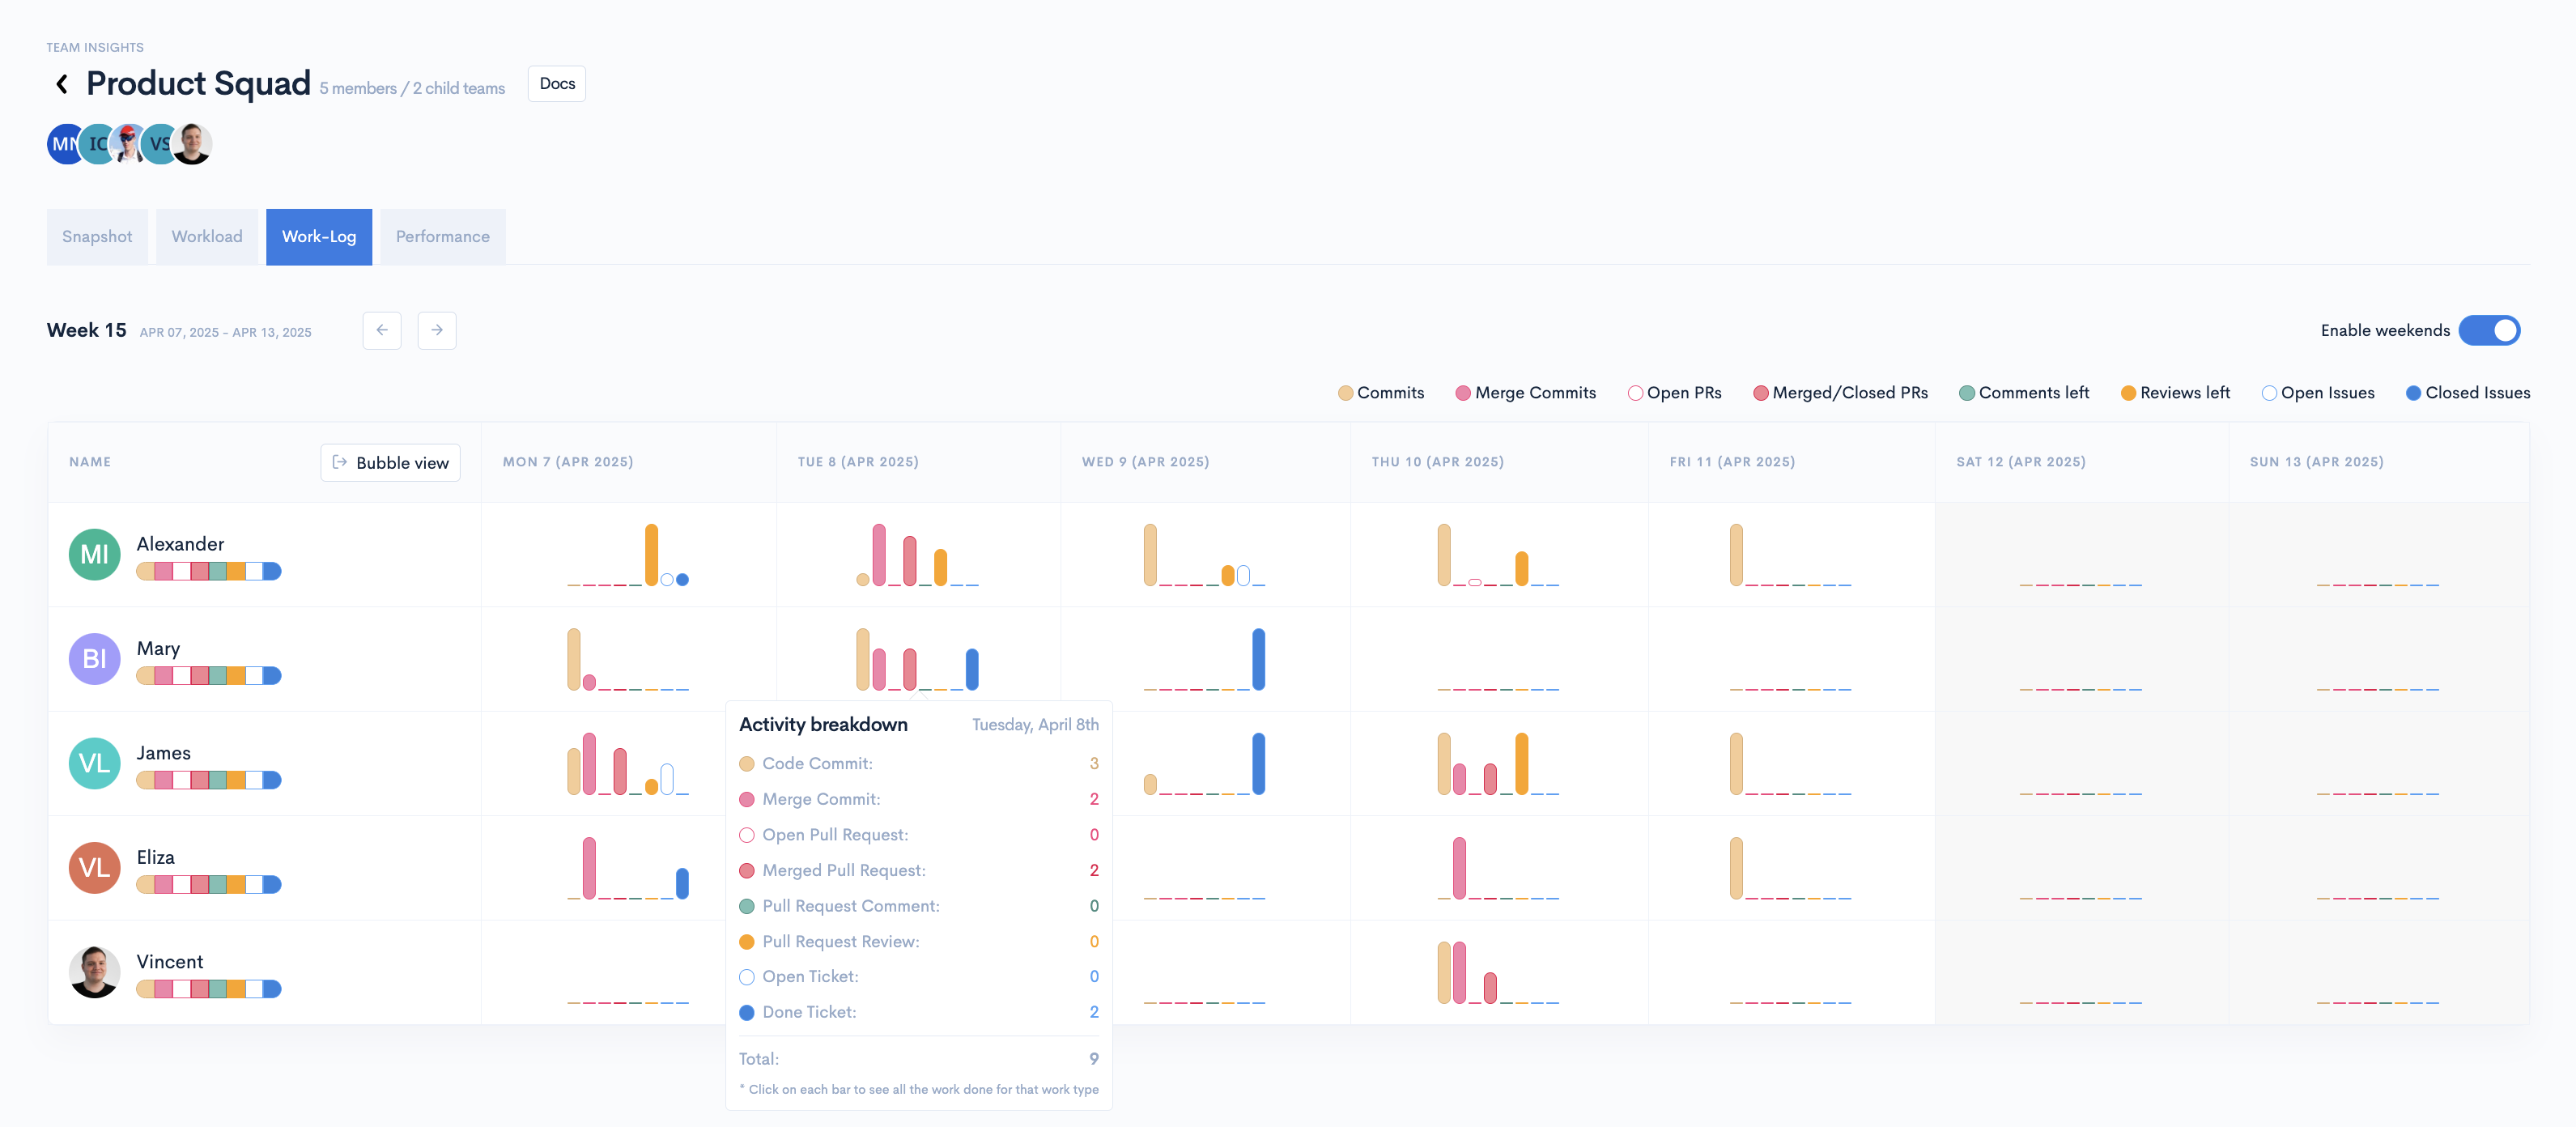
Clicking on any type of activity will open a modal with more details about the work included in it.
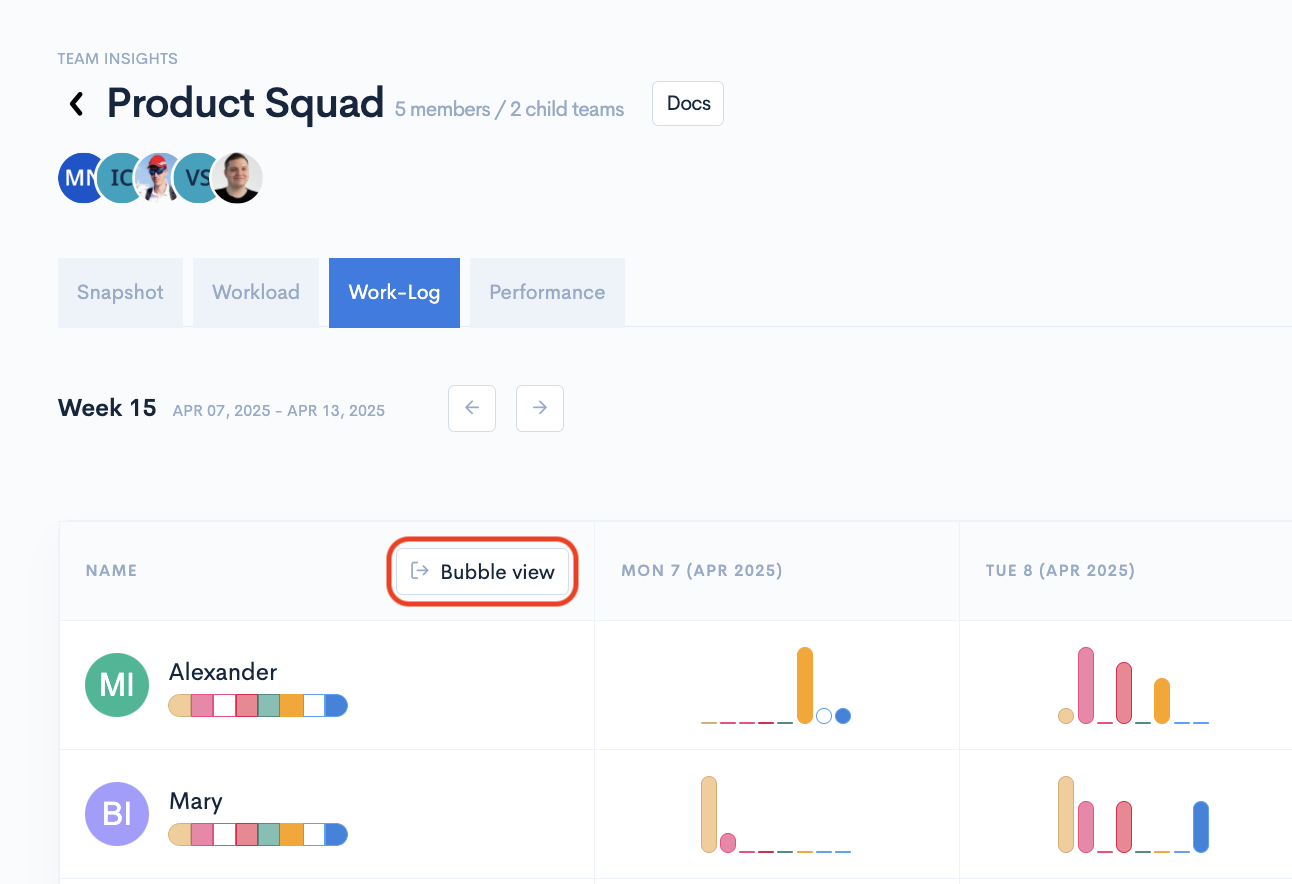
You can switch the view by clicking on the Bubble View. Here you'll be able to hover above each type of work to see more details about it.
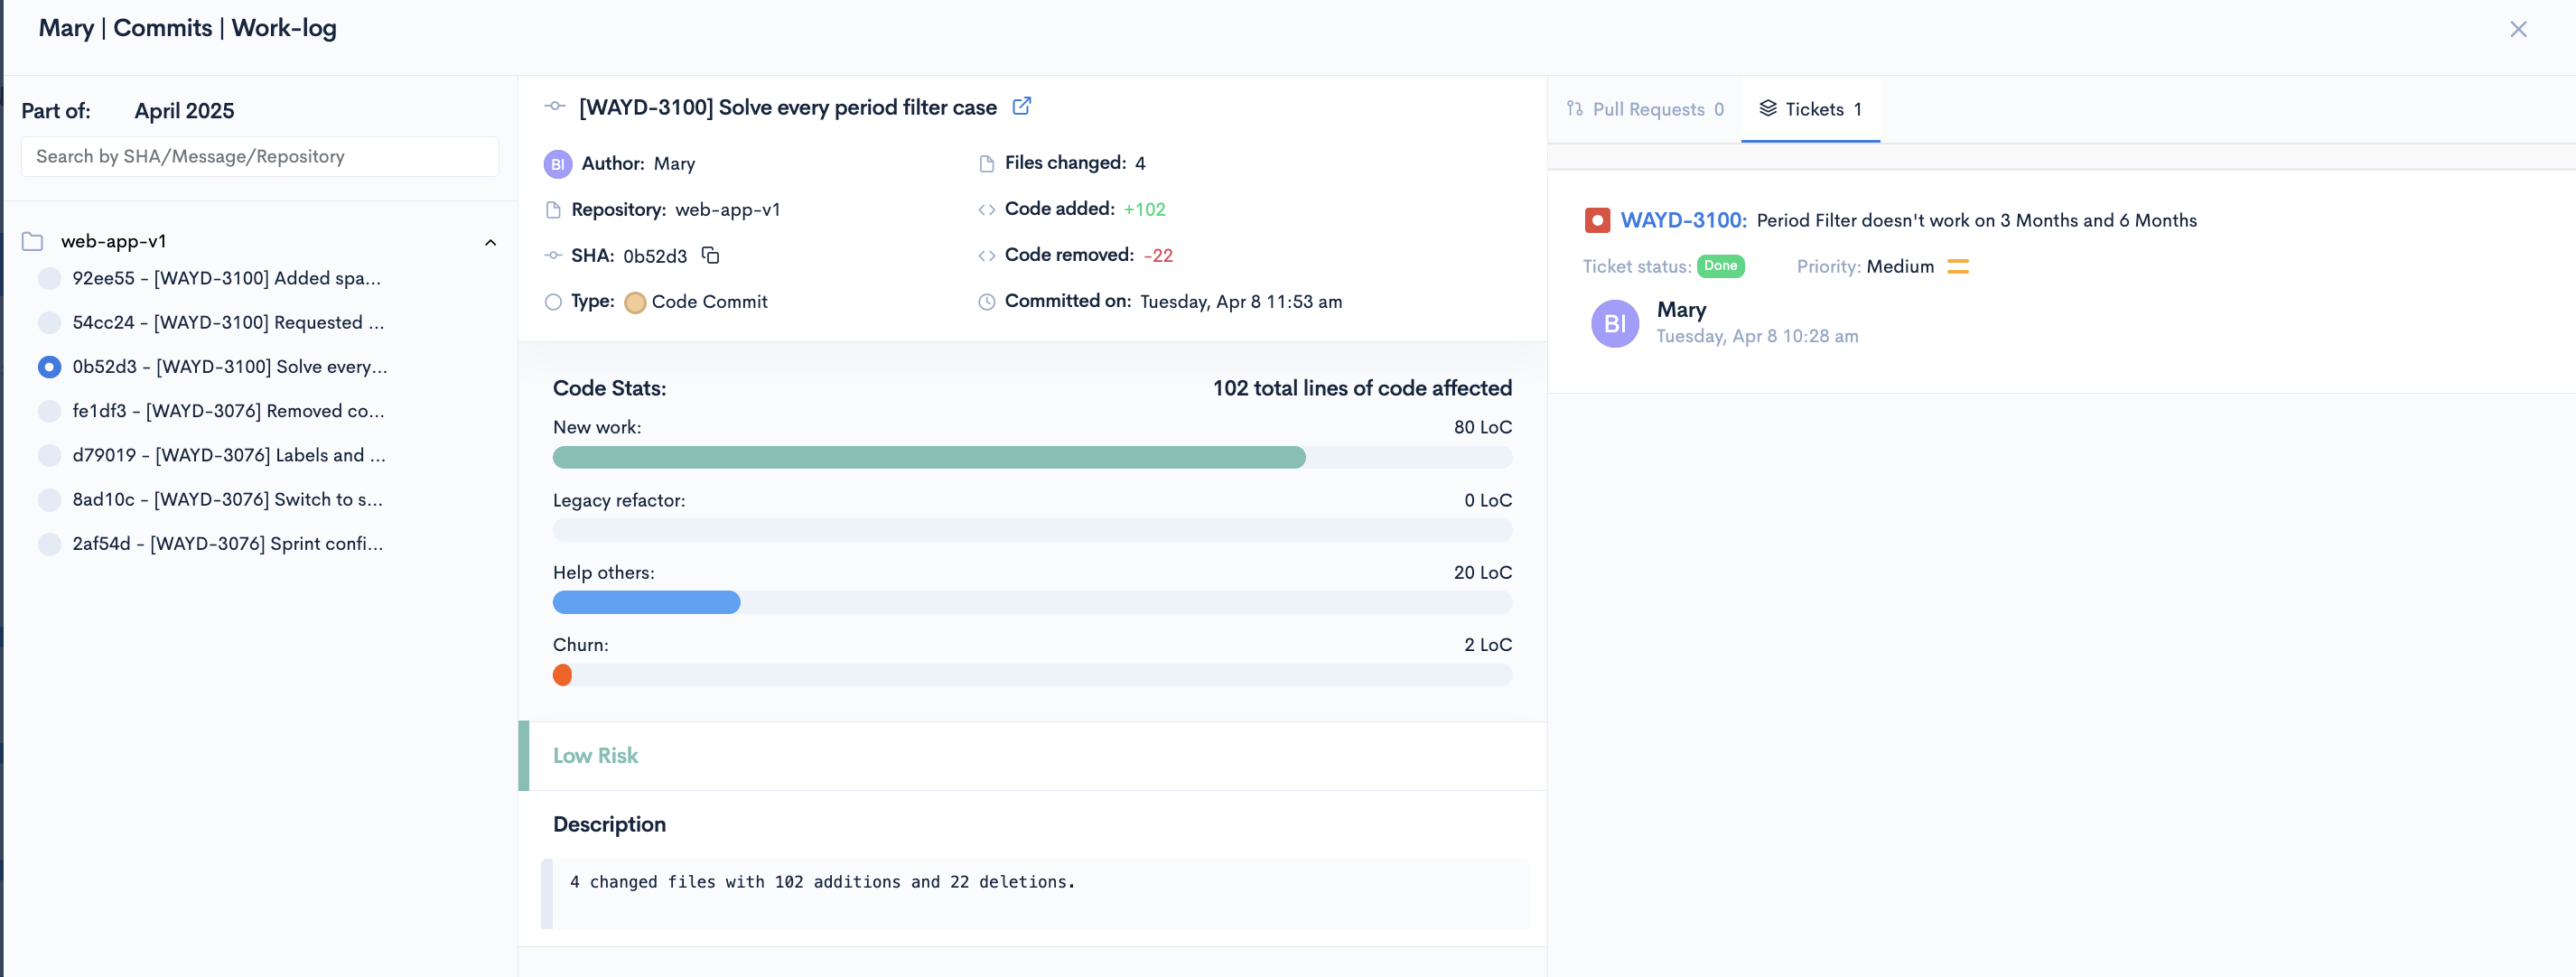
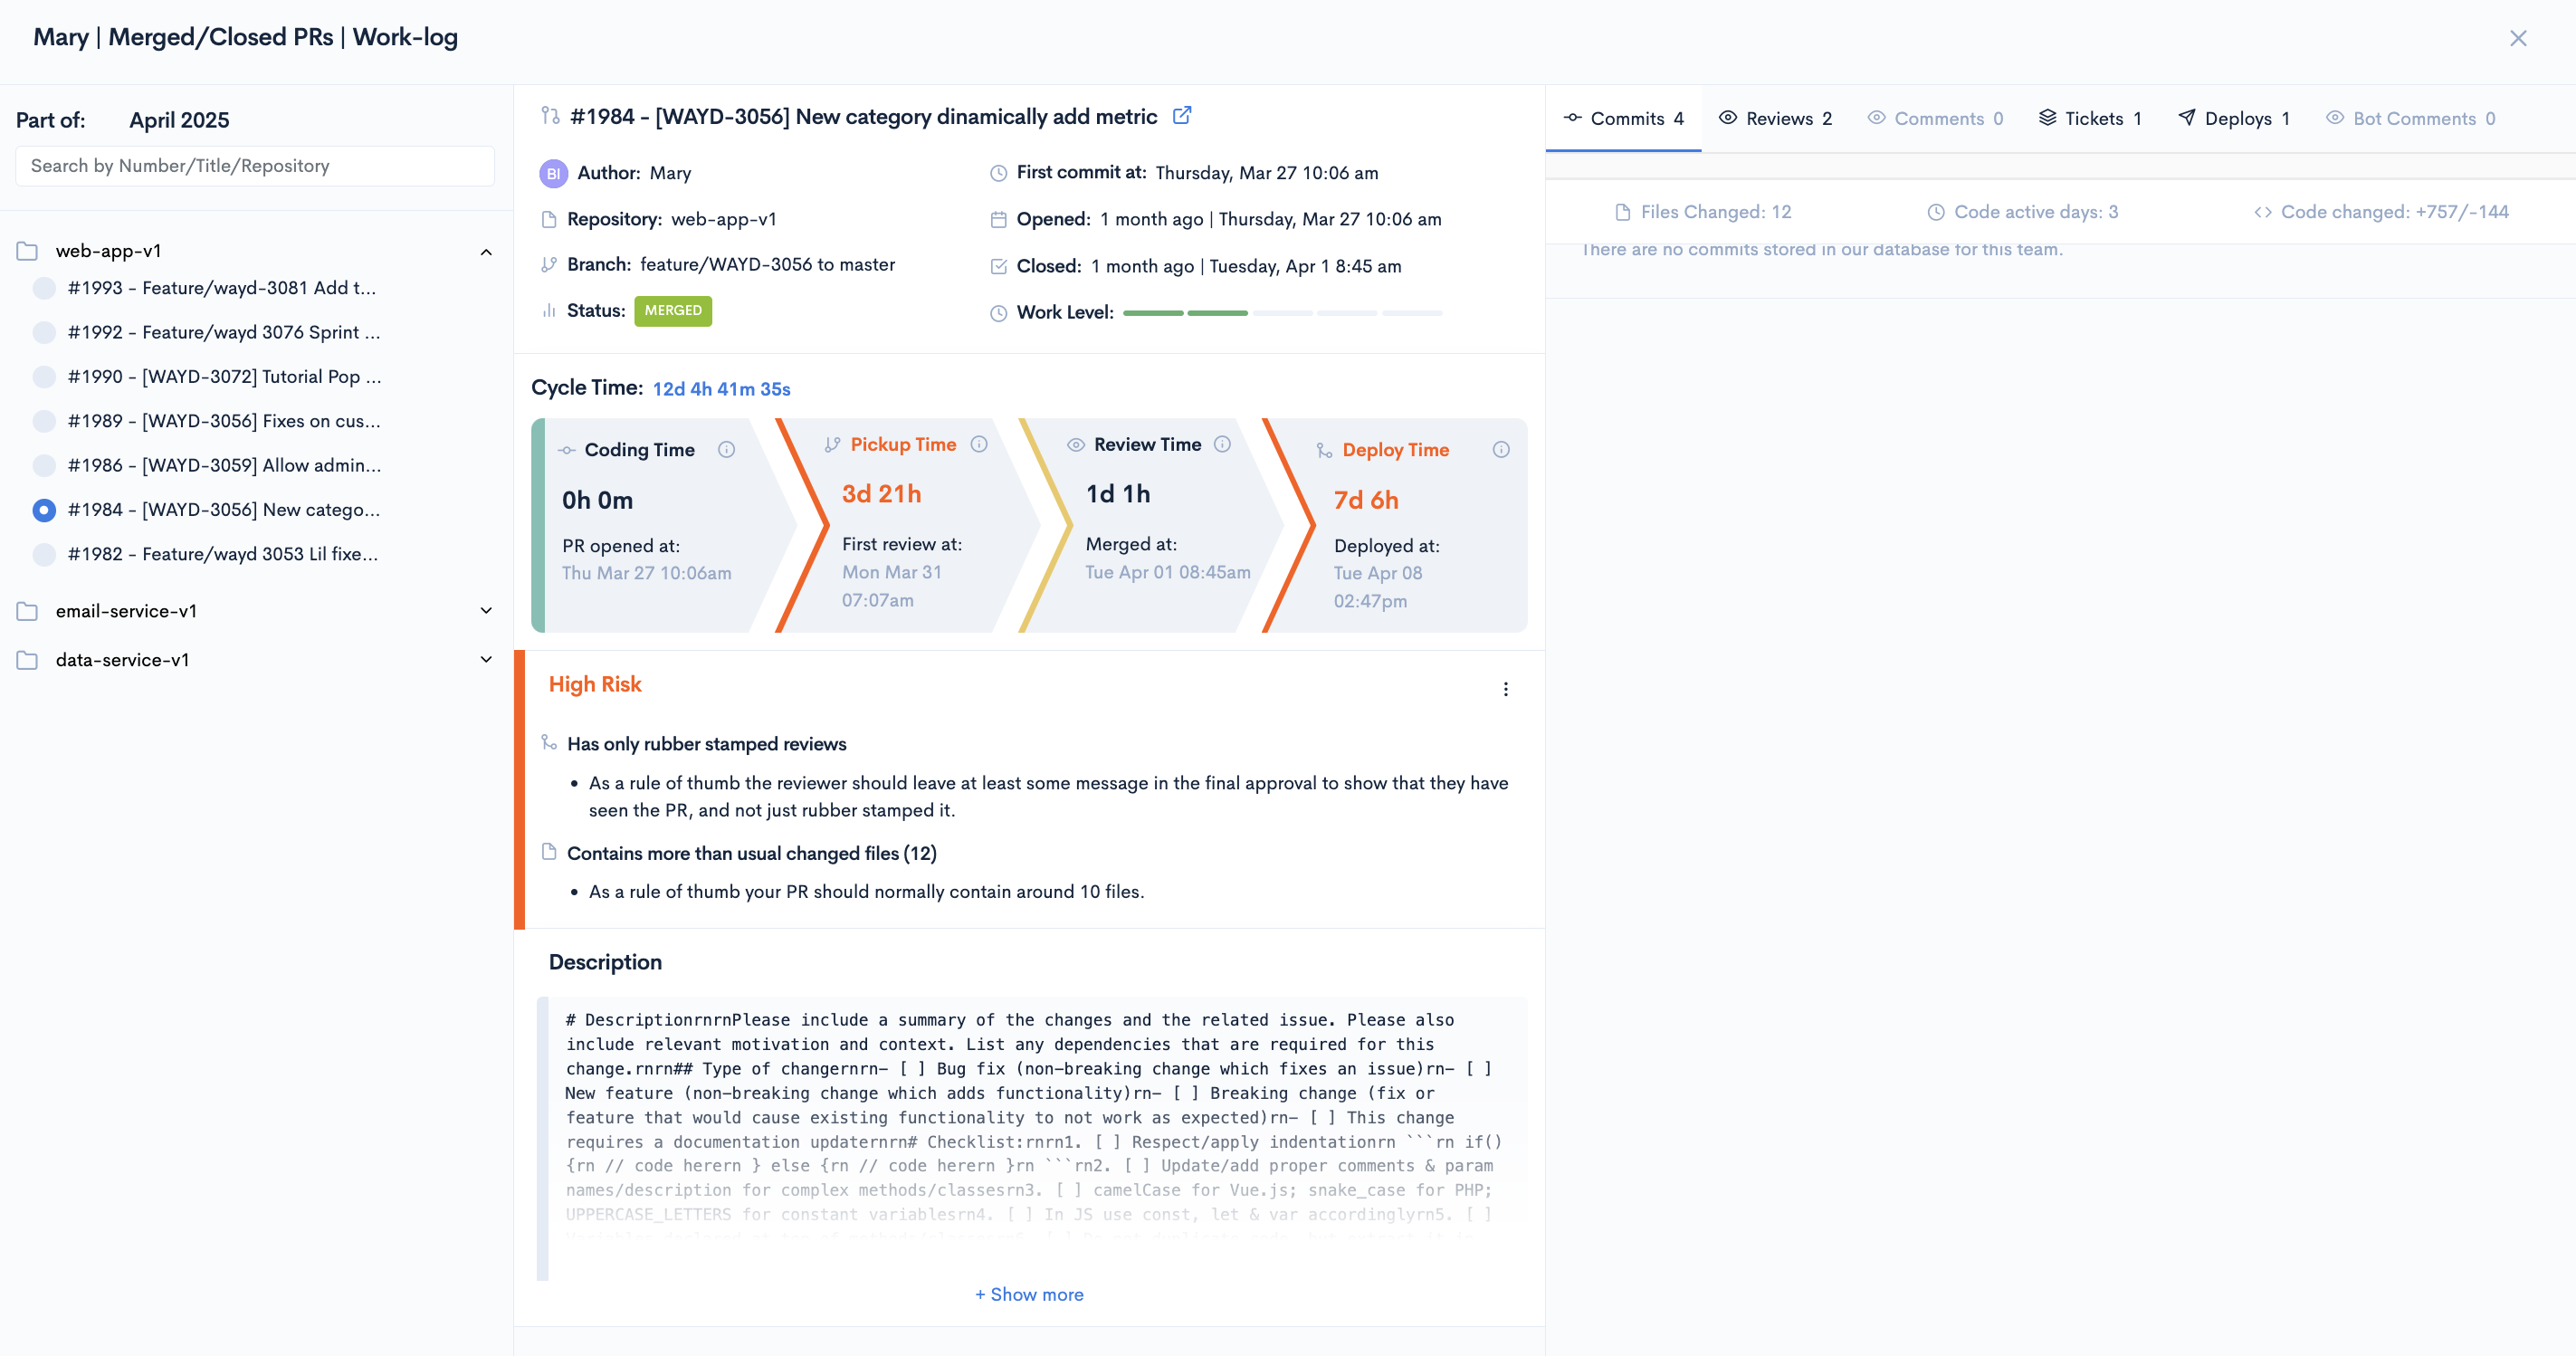
When you click on any symbol in the Work-Log report, you can access detailed information about the work being done. The following information is available:
- The associations of the work item
- Author, Repository, Branch, Status
- Timestamps
- Work Level: showing the degree of difficulty
- Cycle Time
- Risk assessment
- Description
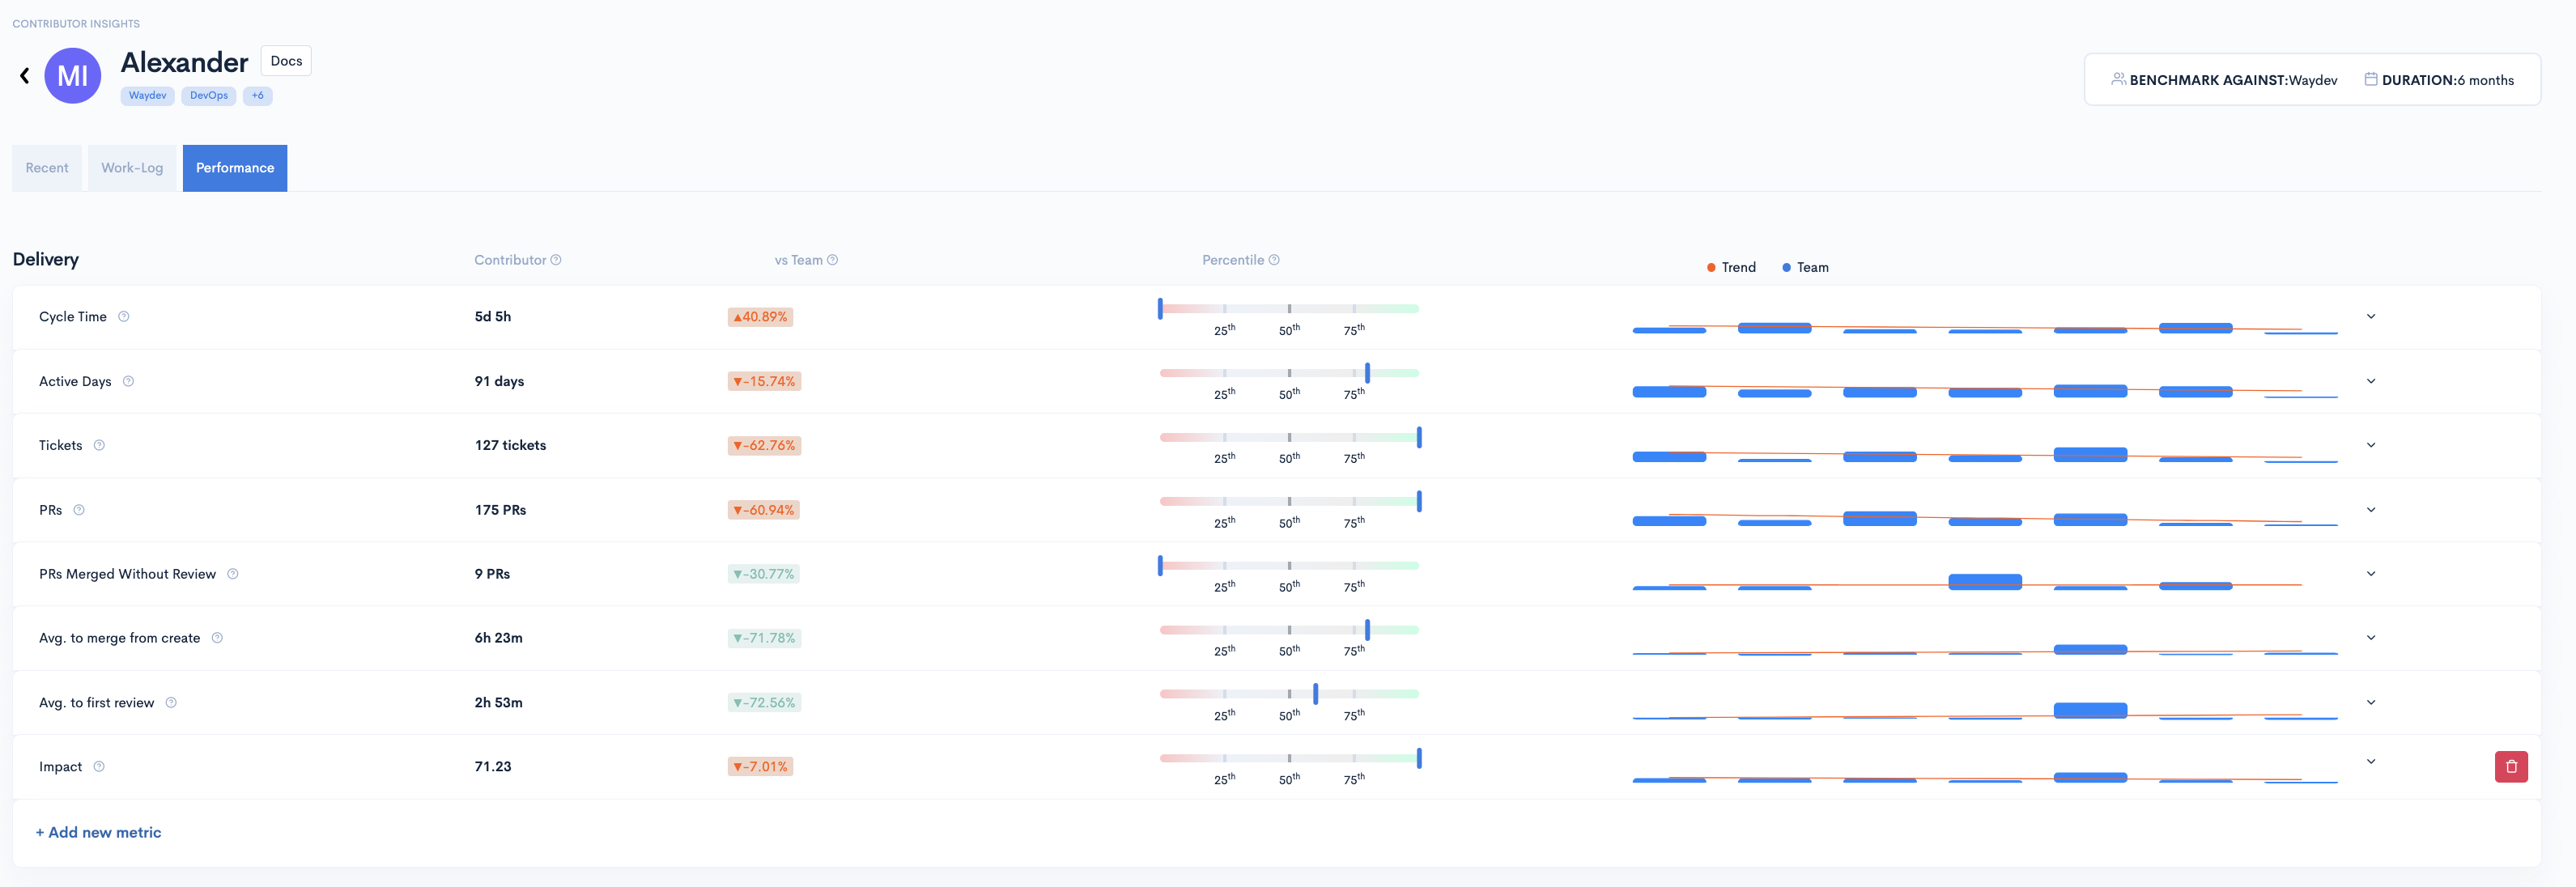
Performance
The performance tab includes an overview of the selected team's performance in a selected time frame compared to the average of all teams in your Waydev account.
The performance tab includes two categories of metrics: Delivery and Health.
For each metric, you can see the value for the selected time frame, the evolution (%) since the previous period, the percentile bar, and an evolution graph.
Once you click on any of the metrics, you'll get a better visualization of the trend line report and what's the 50th percentile.
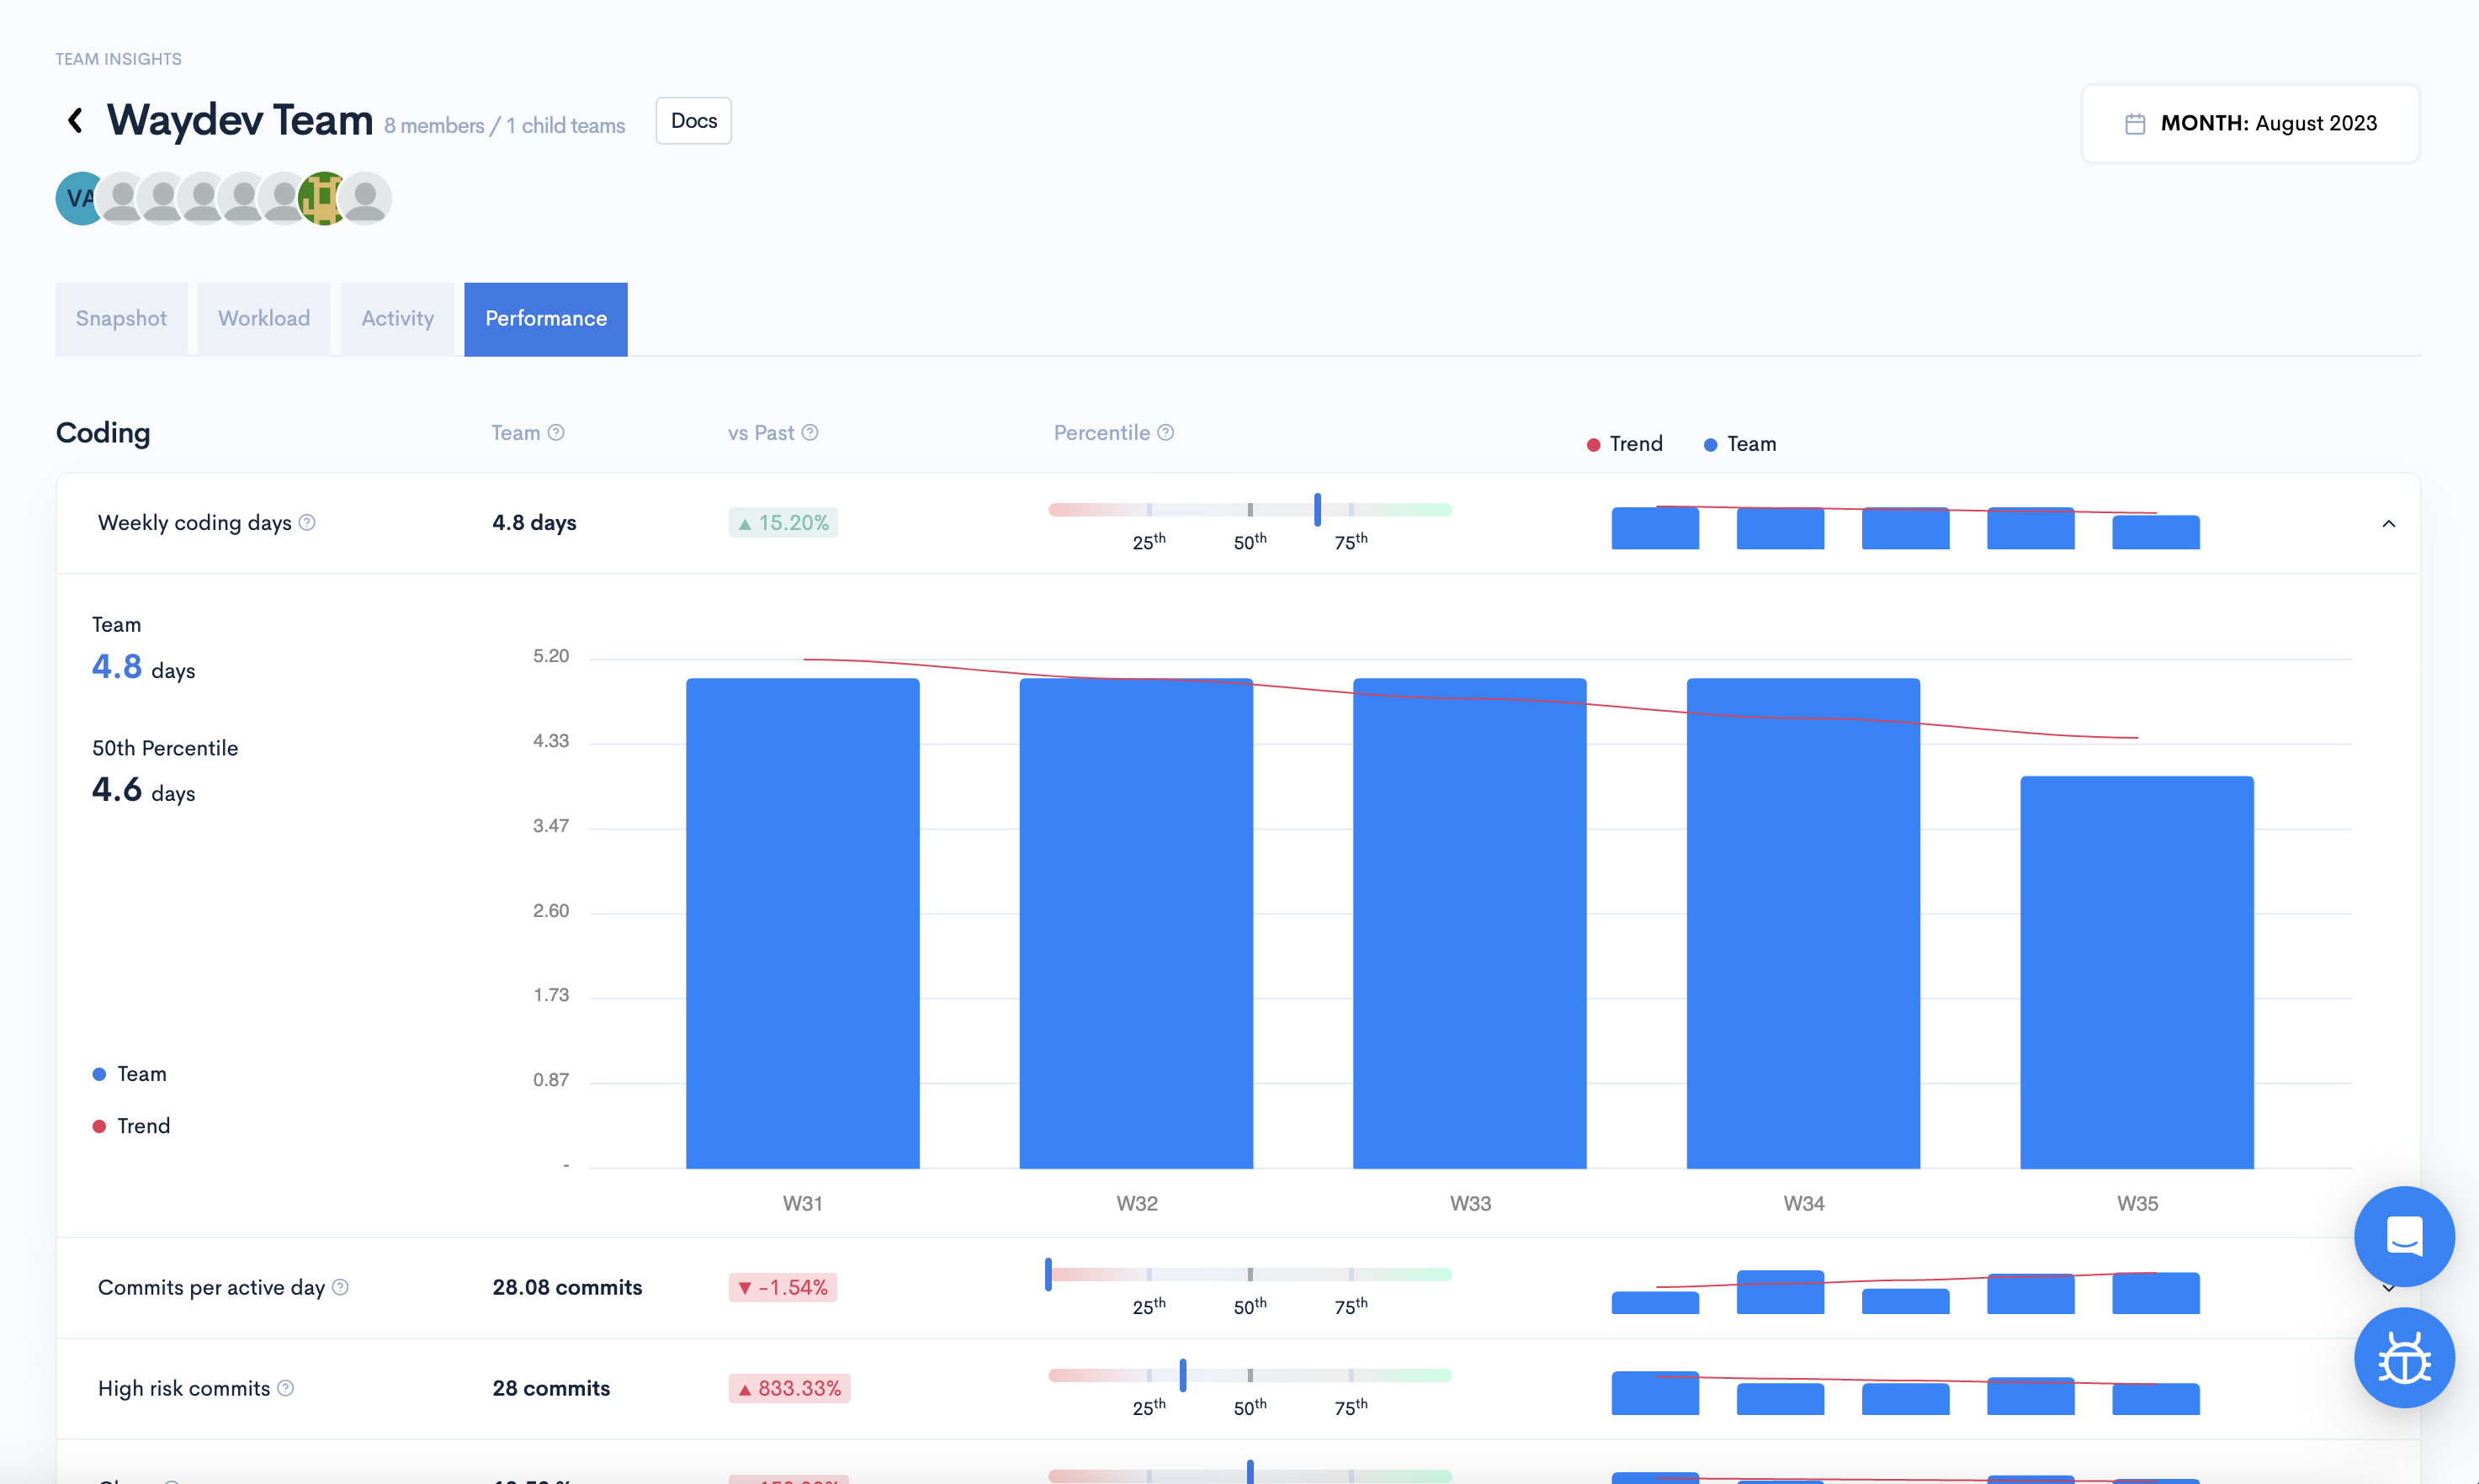
The percentile barThis bar provides a perspective on the current team's relative performance against the other teams. All teams from your Waydev account, including the selected one, are taken into account for comparison (e.g. if the current team falls under the first line, this signifies that their performance is within the bottom 25% of all teams.)
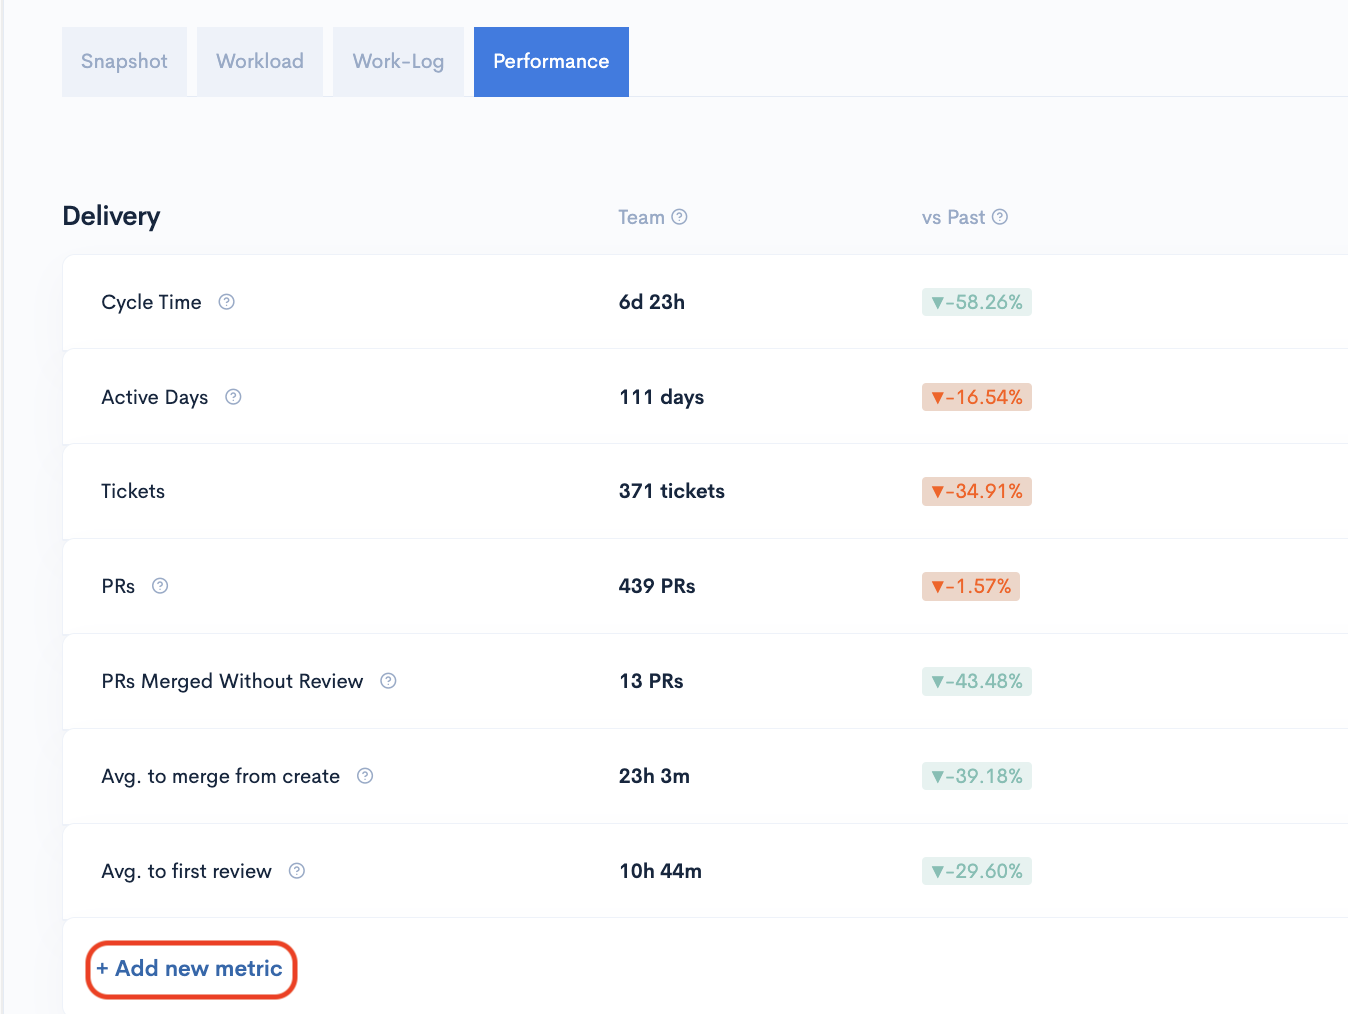
Delivery
Cycle time - the elapsed time from the first commit made to the production release.
Active Days - Active days metric represents the number of days a contributor was active, tracking code commited and pull request activity.
Tickets - total number of tickets
PRs - total PRs for the time frame selected
PRs Merged Without Review - the number of pull requests that were merged into the codebase without undergoing a standard review process.
Average to merge from create - Measures the average time it takes for a pull request (PR) to be merged from the moment it is created.
Average to first review - The average time it takes for the first review to be made on a Pull Request.
Health
KSI - The Sharing Index is a metric designed to assess how well your team collaborates on code reviews. It quantifies the distribution of reviews across your team members and considers factors that promote fair and active participation.
Traceability - Indicates the percentage of commits that are linked to at least one ticket.
PR Failure Rate - Indicates the percentage of Pull Requests declined or closed to total Pull Requests, excluding Pull Requests in progress.
Unreviewed PRs - Tracks the number of pull requests that have been submitted but not yet reviewed.
Unplanned Tickets - the number of unplanned tickets .
High Risk Commits - *Risk is a measure of how likely a commit is to cause problems. It is calculated based on the size of the commit, how the changes are spread across the code base and how serious the changes are.
Churn - Code that has been rewritten or deleted in the first 21 days (this value is adjustable on the Settings page).
Updated 10 months ago