

Bird’s-eye view
Bird’s-eye view provides a quick-to-read visual summary of your group's and team's performance, making complex data comprehensible.
You will find Bird's eye view in the Health section of the sidebar menu.
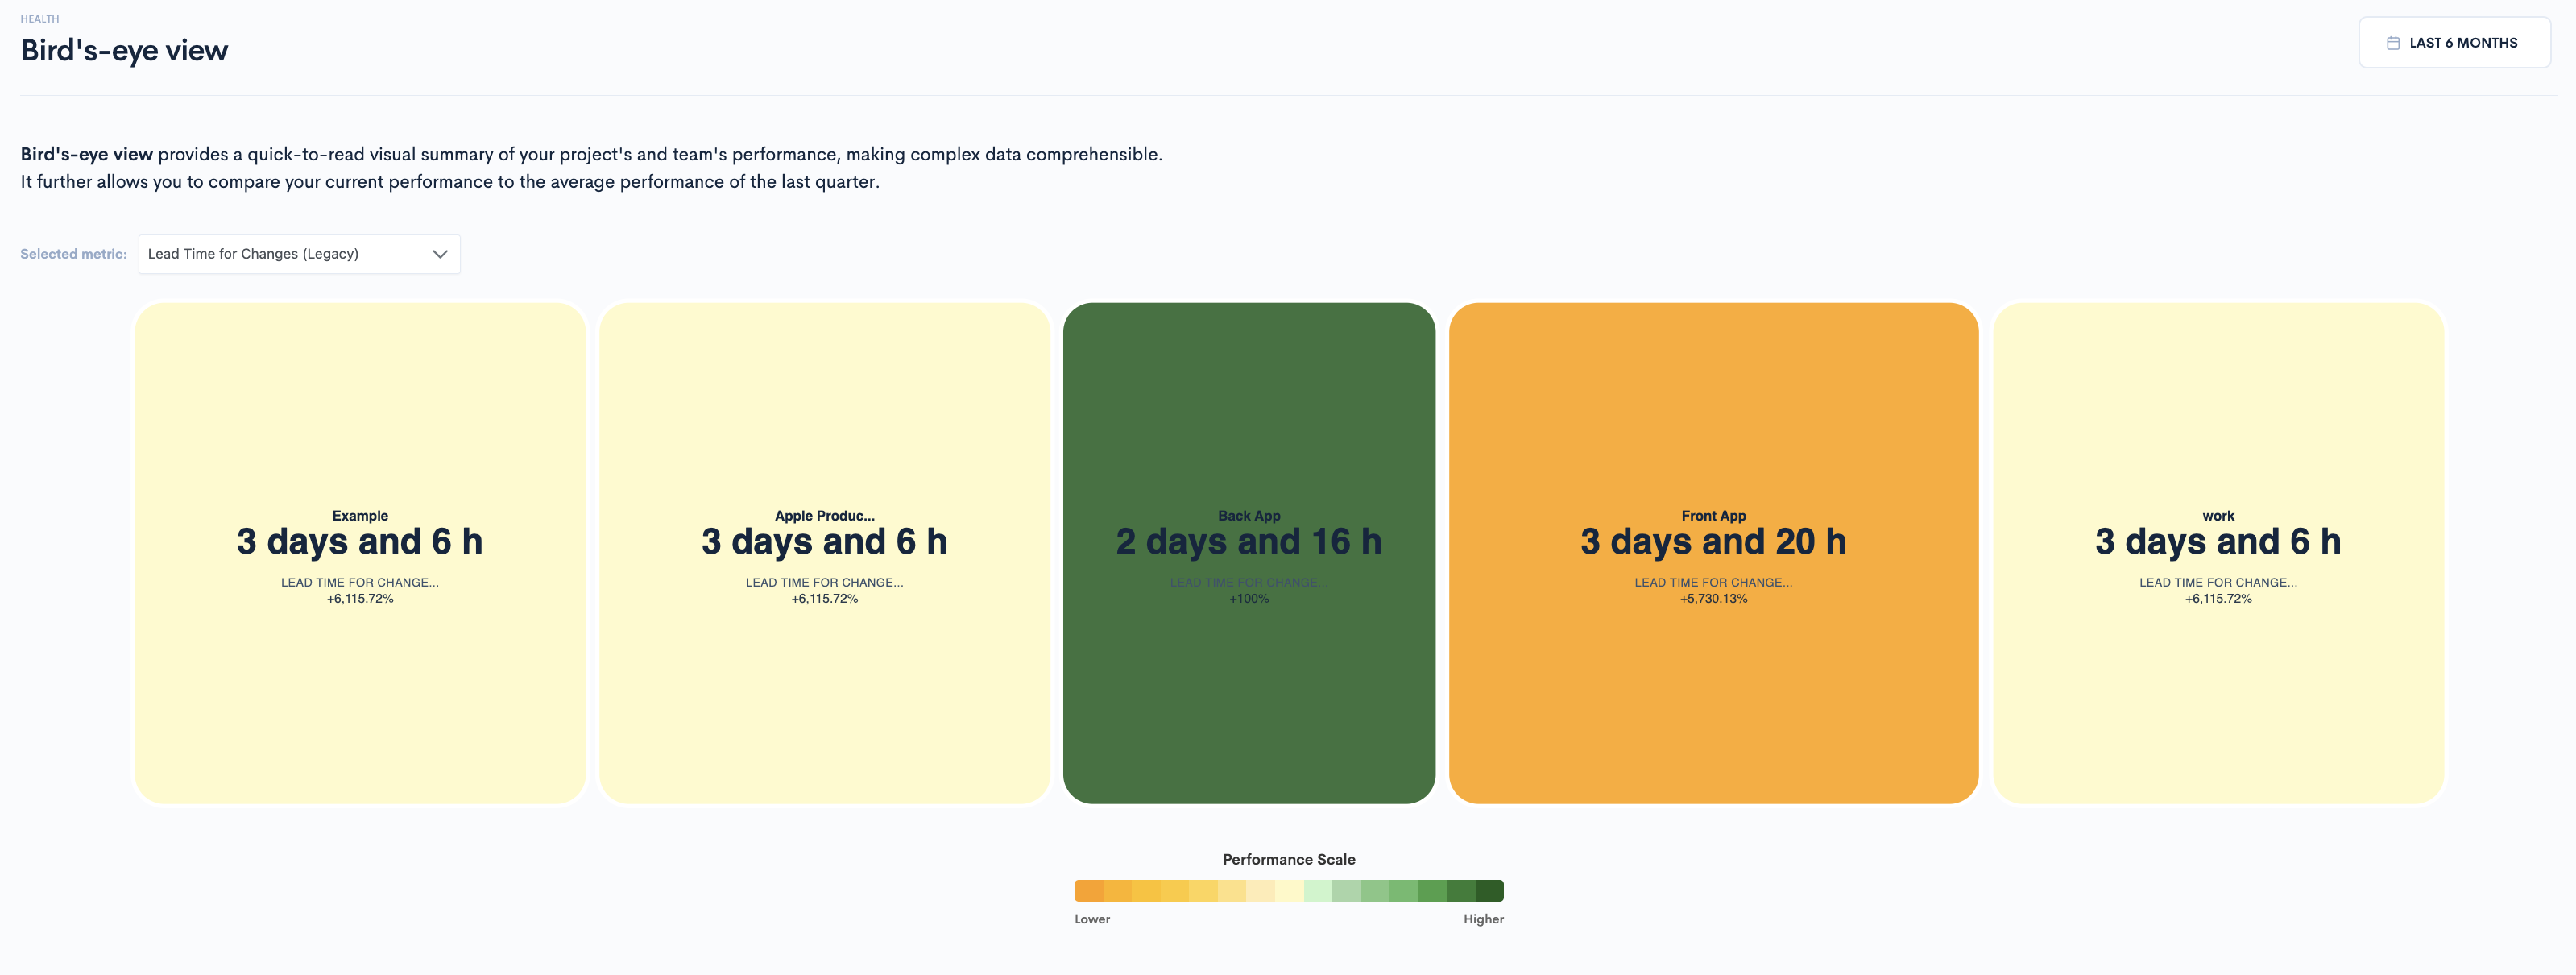
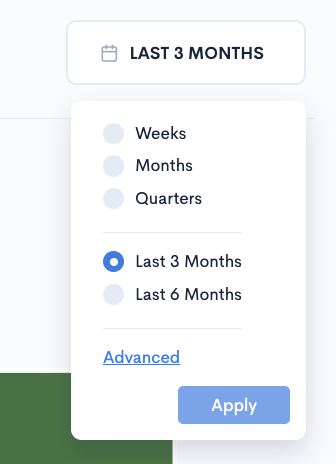
First, select the time frame and the metric you want to focus on for your groups. Select the time frame from the upper right corner and click "Apply."
You can choose any of our metrics from the "Select metric" dropdown, independently for review:
- Lead Time for Changes: Cycle Time is one of the best measures of an engineering organization’s velocity. It measures the elapsed time from the first commit made to production release.
- Active Days: Represents the number of days a contributor was active, tracking code committed and pull request activity.
- Touched Tickets: The total number of tickets (including unplanned).
- KSI: The Sharing Index is a metric designed to assess how well your team collaborates on code reviews. It quantifies the distribution of reviews across your team members and considers factors that promote fair and active participation.
- Unplanned Tickets: Represents the number of tickets that were added to the sprint after the sprint started.
- Planned Tickets: This metric tracks tickets that were planned in advance (part of sprint/iteration planning).
- Created Tickets: This metric tracks tickets based on their state/category in the project management workflow.
- Etc.
After selecting the metric and time frame, you'll see the groups benchmarked against the company average in a color-coded way. Groups displayed in the green range are performing better than the company average, those in the yellow range are average performers, and those in the orange range are performing below average.
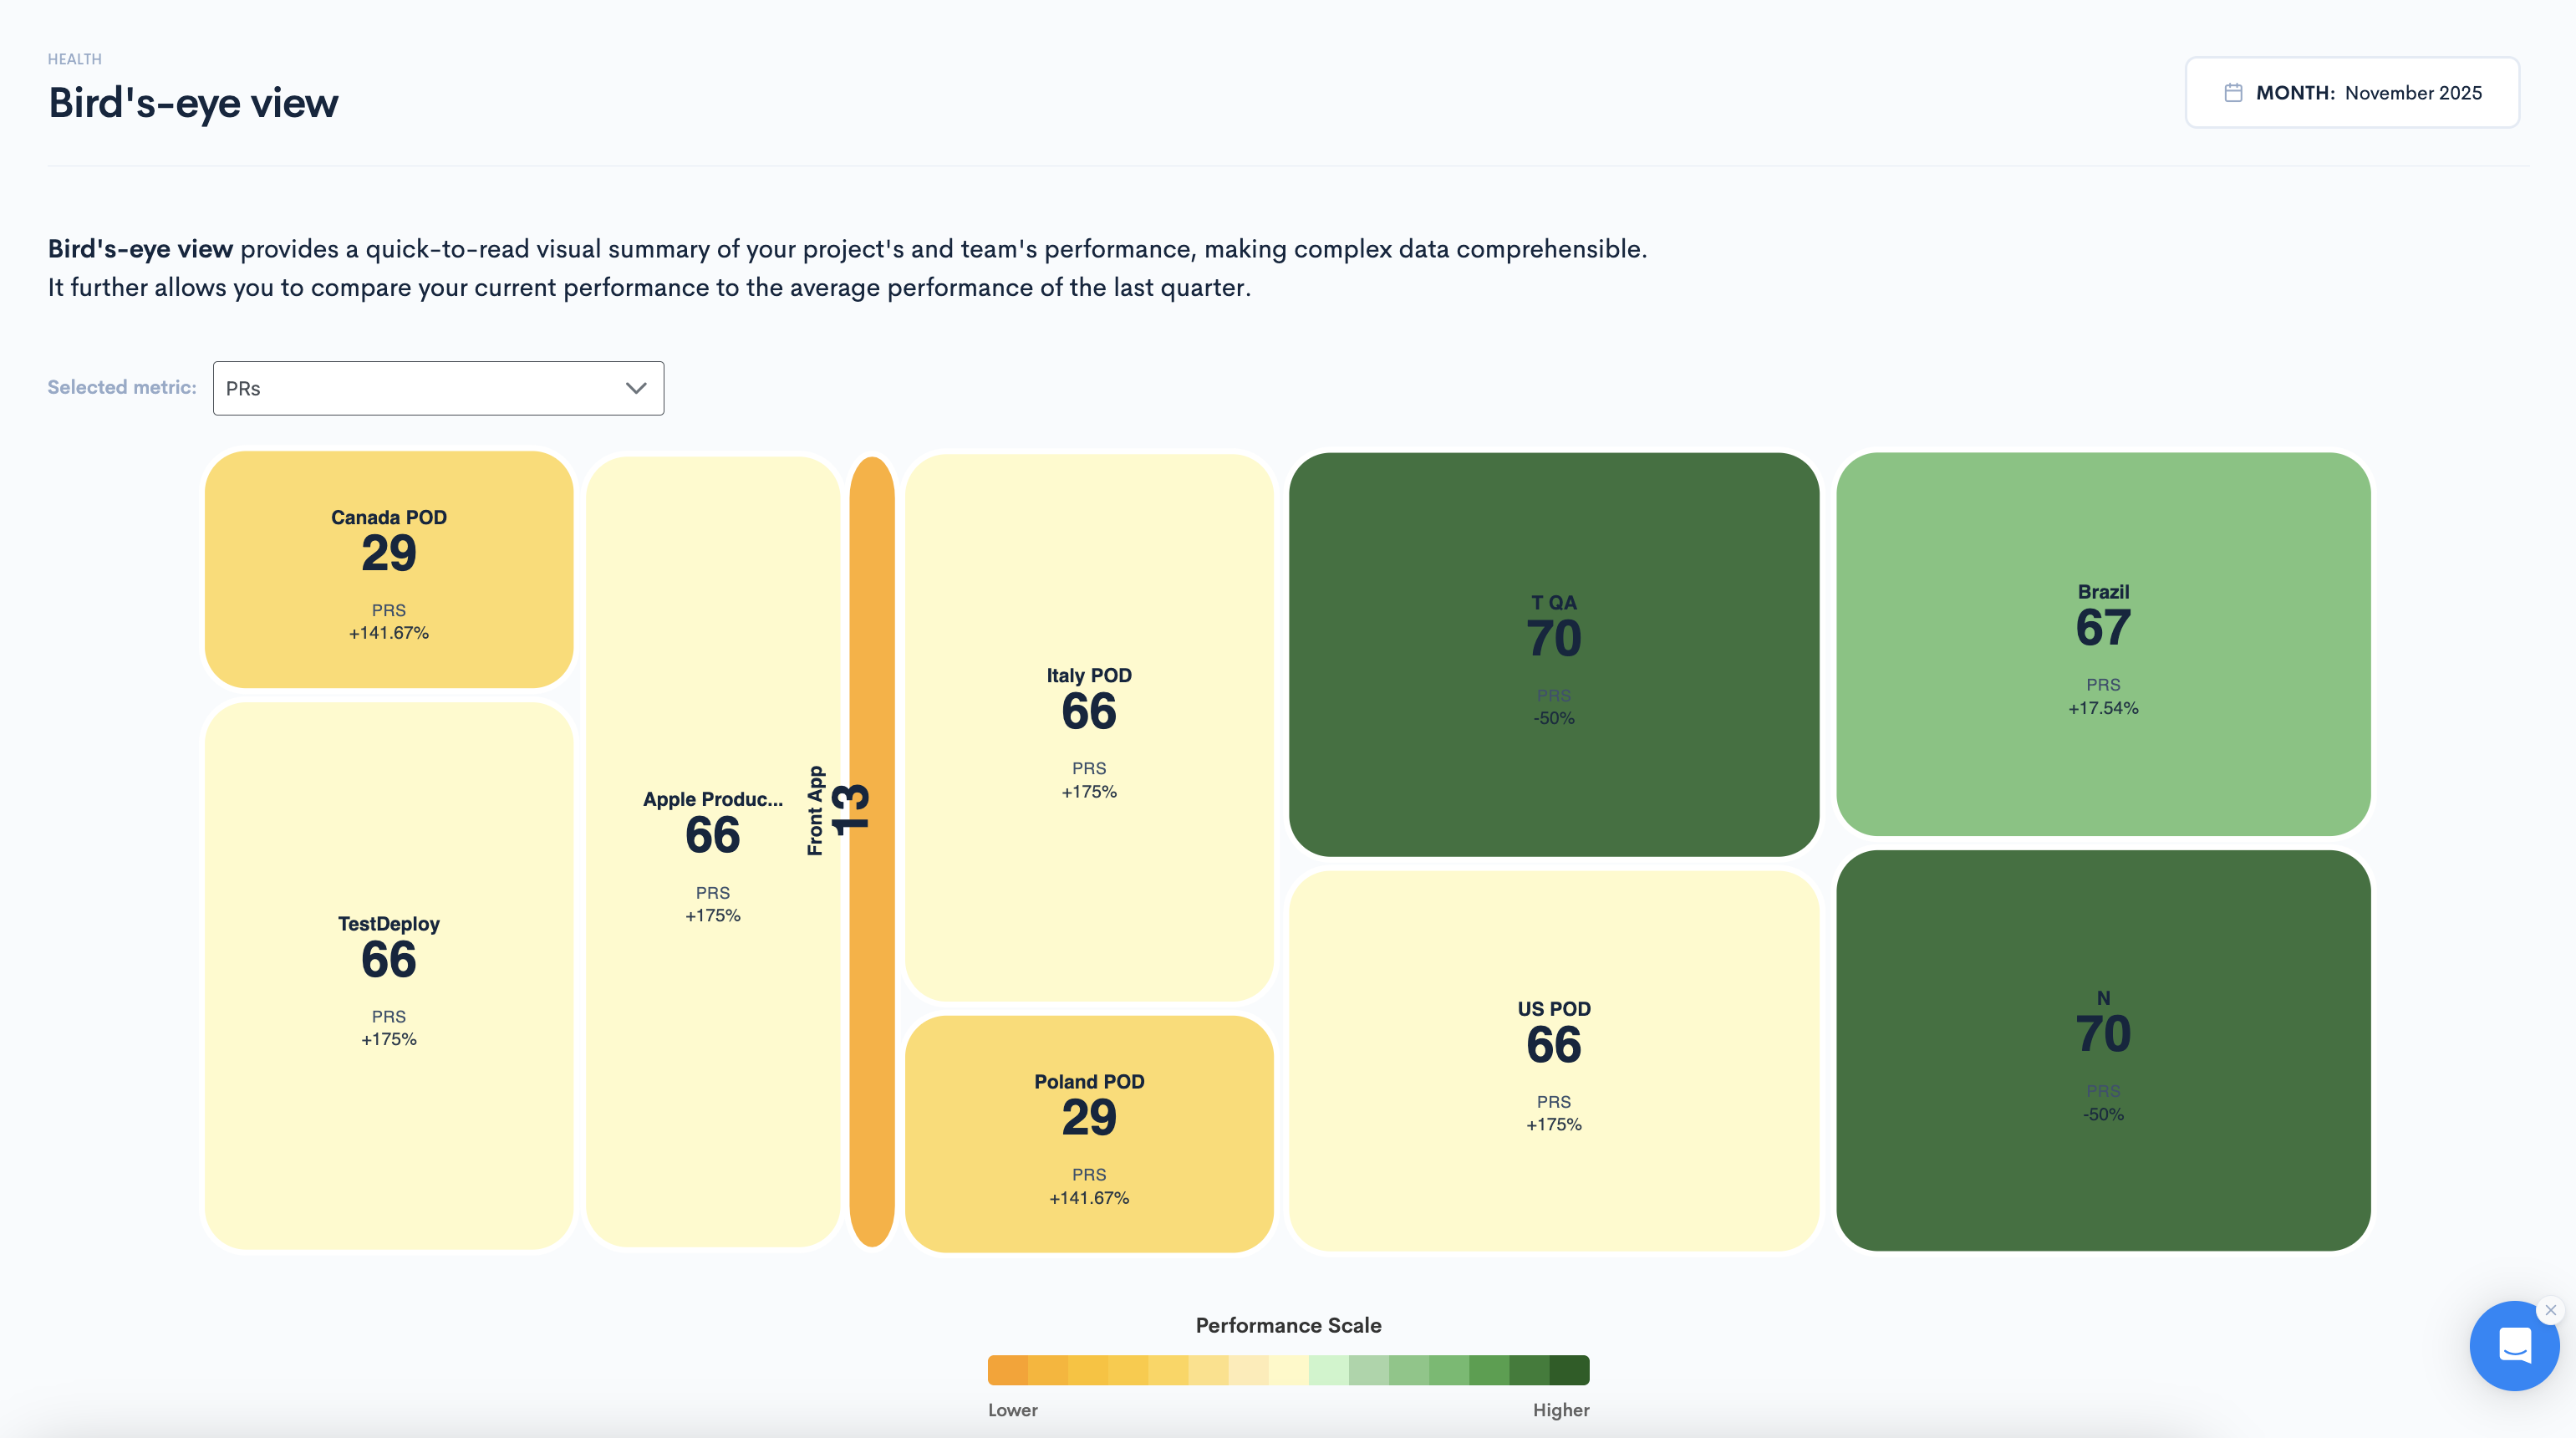
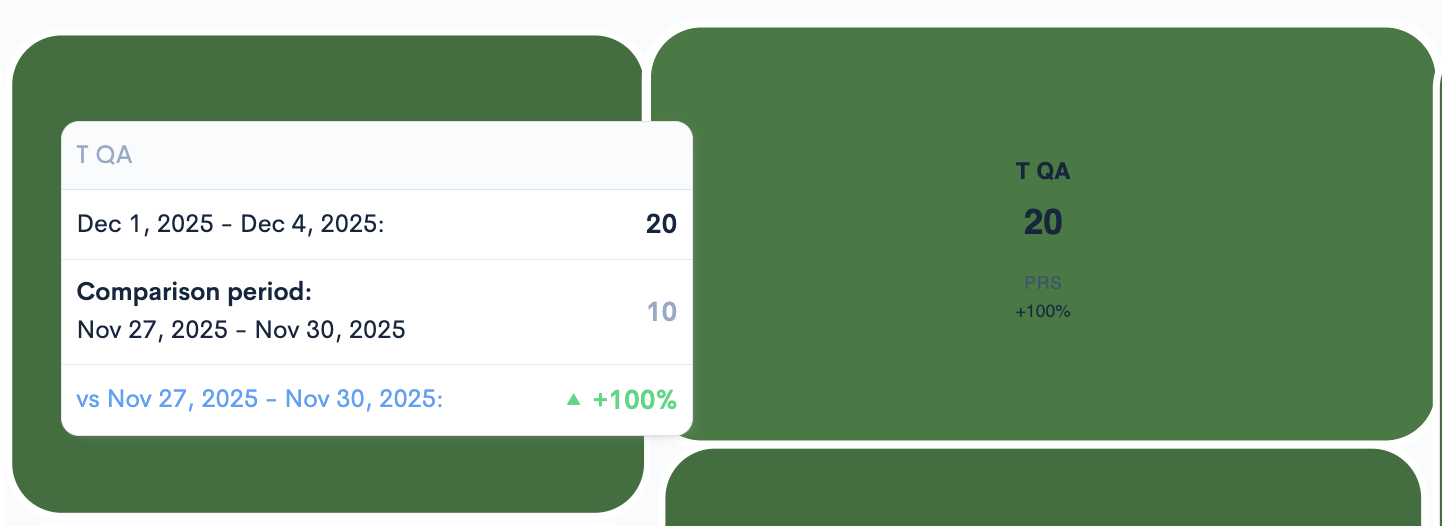
By hovering over each group, you can see how it compares to the previous period in your company as a percentage.
Updated 8 months ago