

Sprints Commitment
Get a clear summary of your sprint with our Sprint Commitment Report! Track and analyze the ticket activity in your teams and identify any bottlenecks.
Feature Overview
To view the data, select the time frame and the teams you'd like to analyze, then click Apply.
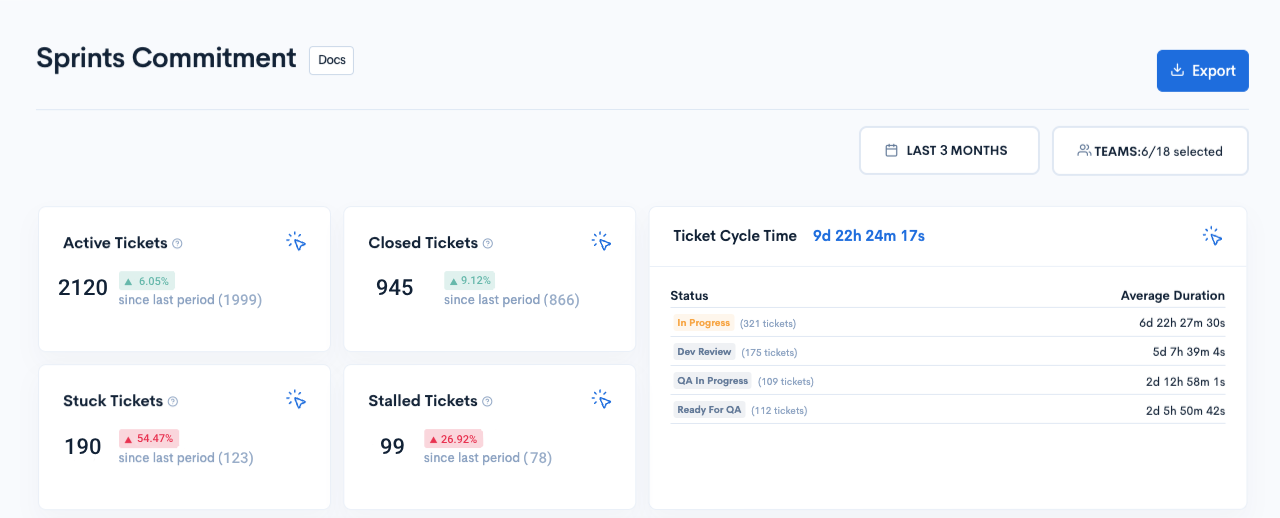
At the top of the page, you will see the following metrics:
- Active tickets: The number of tickets that are currently in an active state.
- Closed tickets: The number of tickets that have been closed.
- Stuck tickets: The total number of active tickets that haven’t had any new Git activity for the past 7 days.
- Stalled tickets: The total number of active tickets that have remained in the same state for the past 7 days.
- Tickets Cycle Time: The average cycle time of tickets, broken down by ticket status.
Ticket Graph & Progress Table
The Ticket Graph displays the number of tickets divided by months, weeks, or days, depending on the selected time frame. Tickets are presented in four types:
- Active tickets: The number of tickets that are in an active state.
- Total tickets: The total number of tickets created within the selected timeframe.
- Closed tickets: The number of tickets that have been closed.
- Unplanned tickets: The number of tickets added to the sprint after the sprint started.
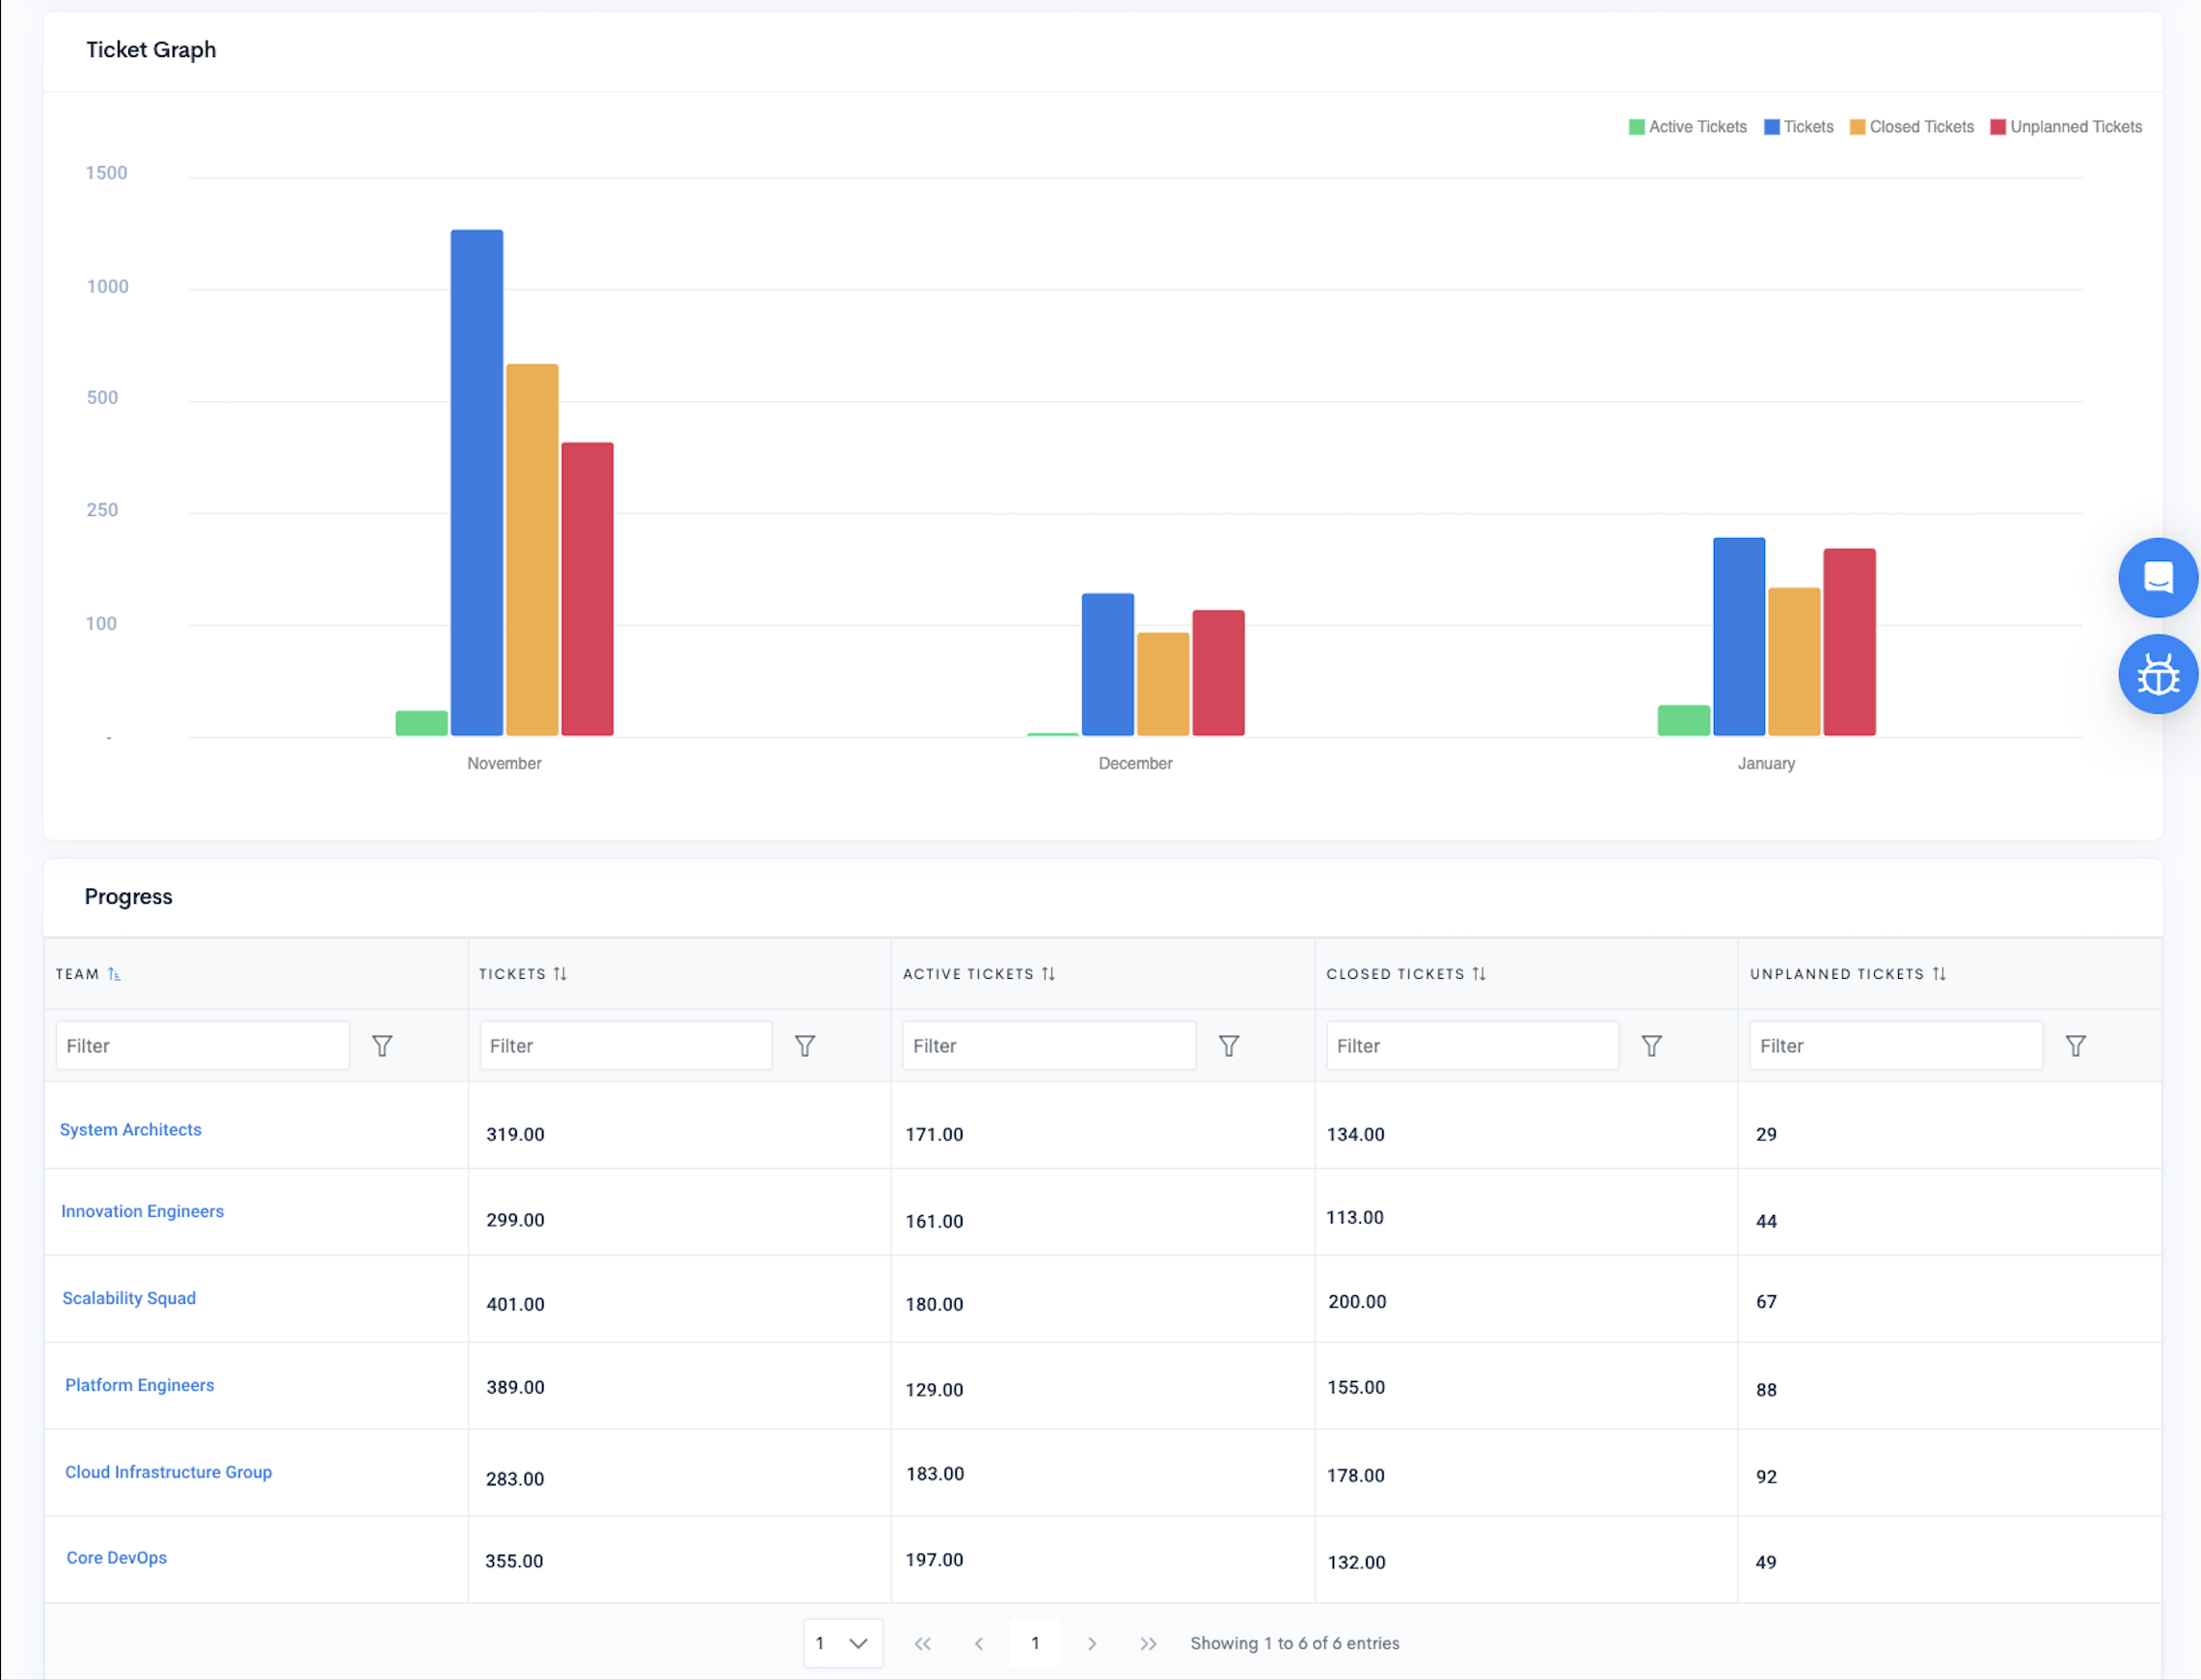
The Progress table below displays the metrics from the graph in a table view, divided by team, allowing you to zoom into selected teams.
Insights Table
At the bottom of the page, we have the Insights table, which provides six metrics to help teams improve predictability, reduce cycle time, and optimize efficiency in their development process:
- Total tickets: The total number of tickets created within the selected timeframe.
- Stuck tickets: The total number of active tickets that haven’t had any new Git activity for the past 7 days.
- Stalled tickets: The total number of active tickets that have remained in the same state for the past 7 days.
- Unlinked tickets: The number of tickets not linked to any PR or commit.
- Unassigned tickets: The number of tickets not assigned to any contributor.
- Epicless tickets: The number of tickets not assigned to any epic.
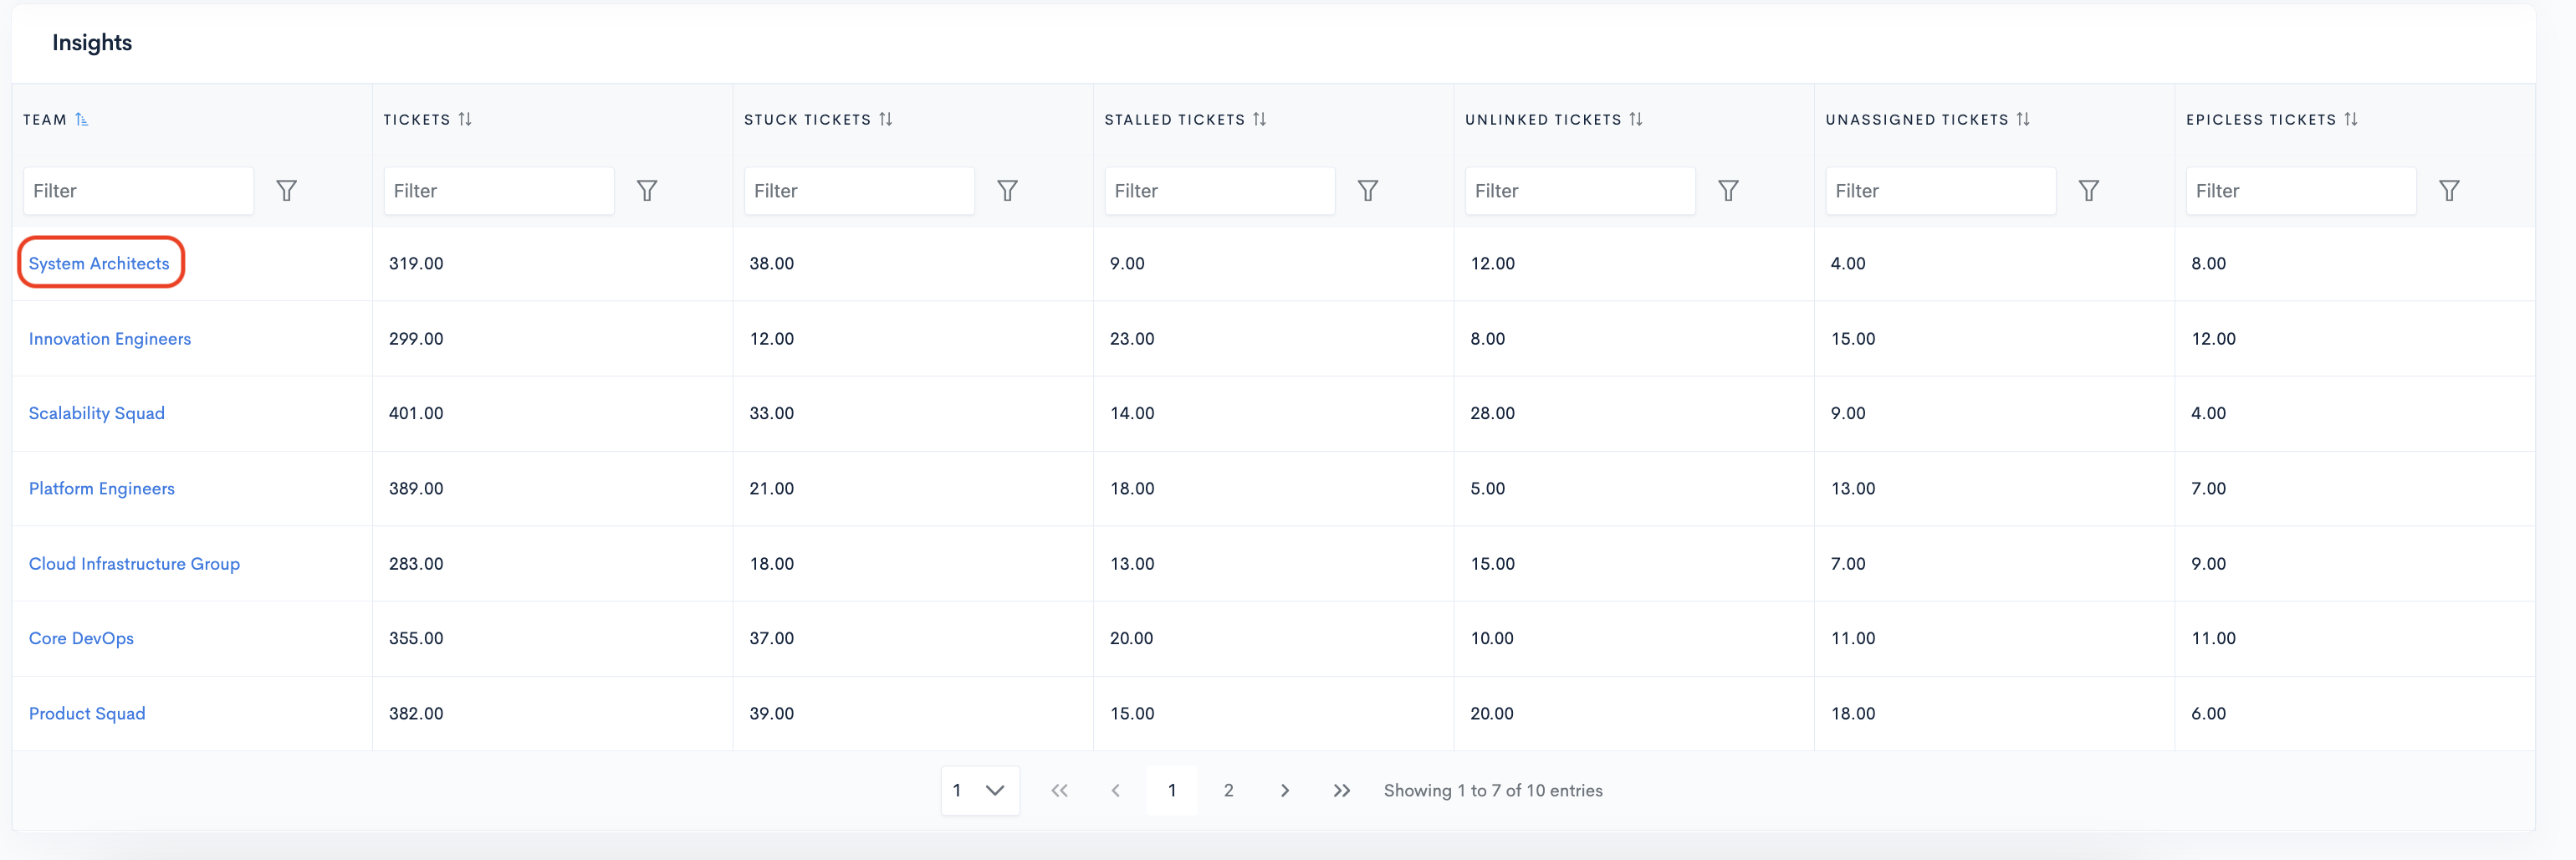
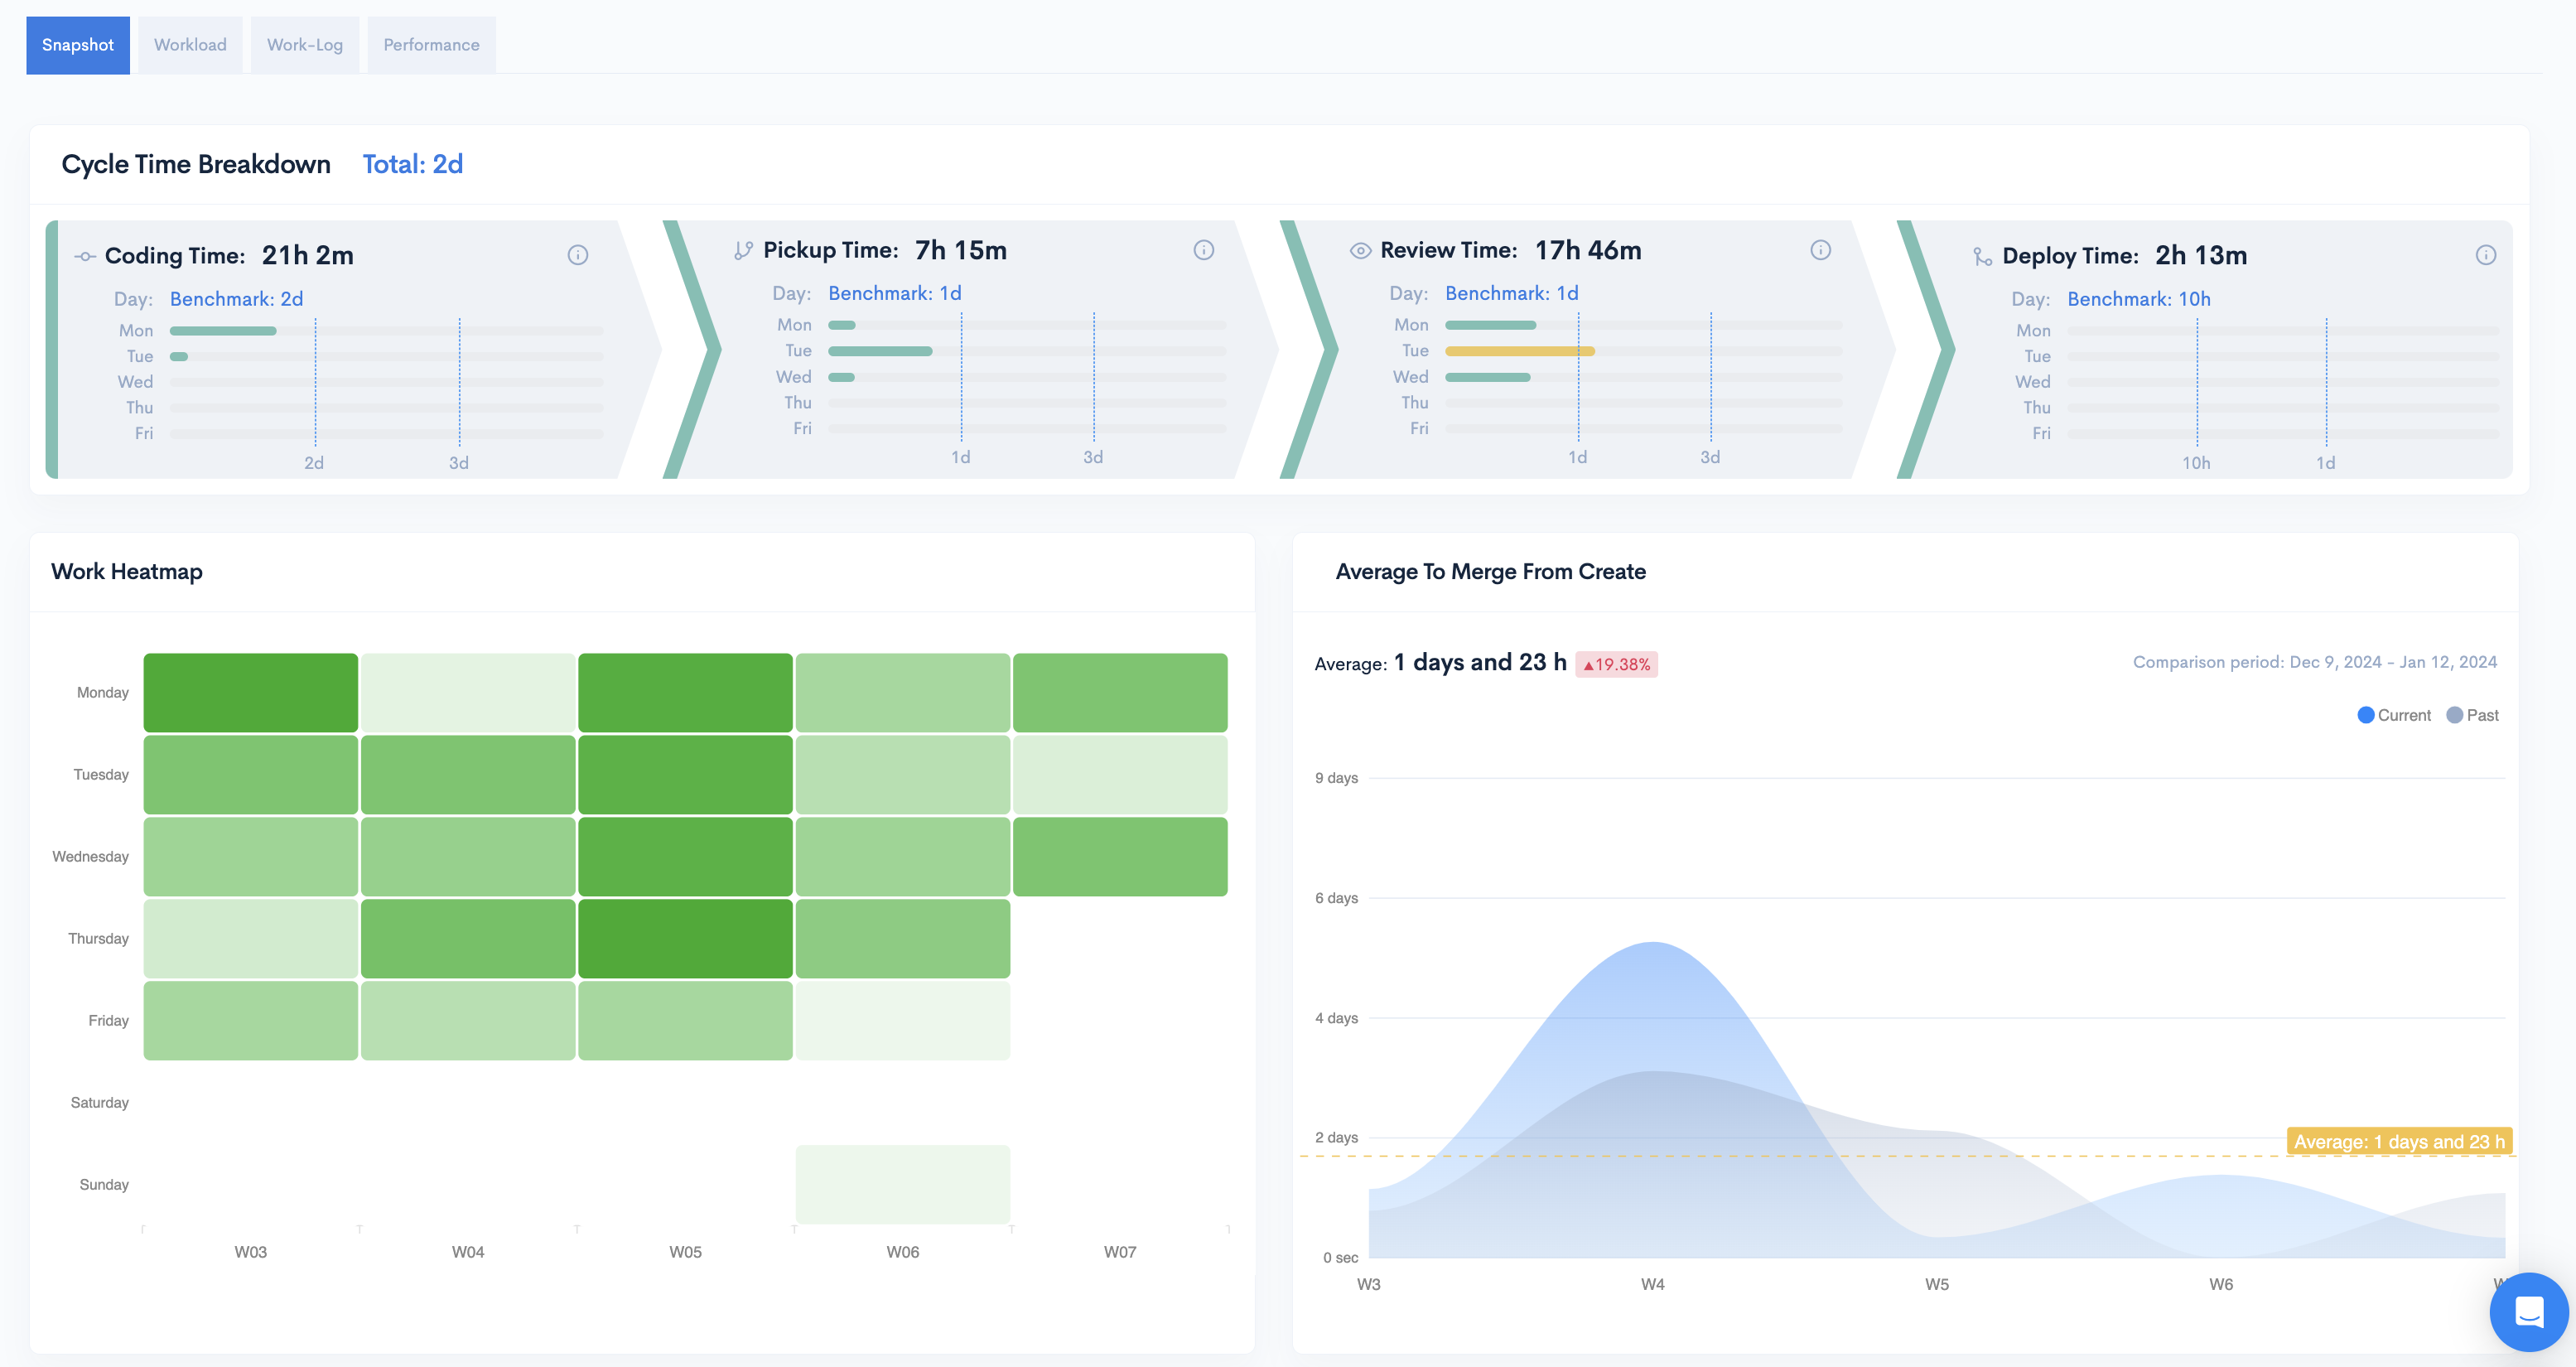
Clicking on a team's name will open the Team Insights page, where you can find a detailed overview of their activity.
Ticket Overview Modal
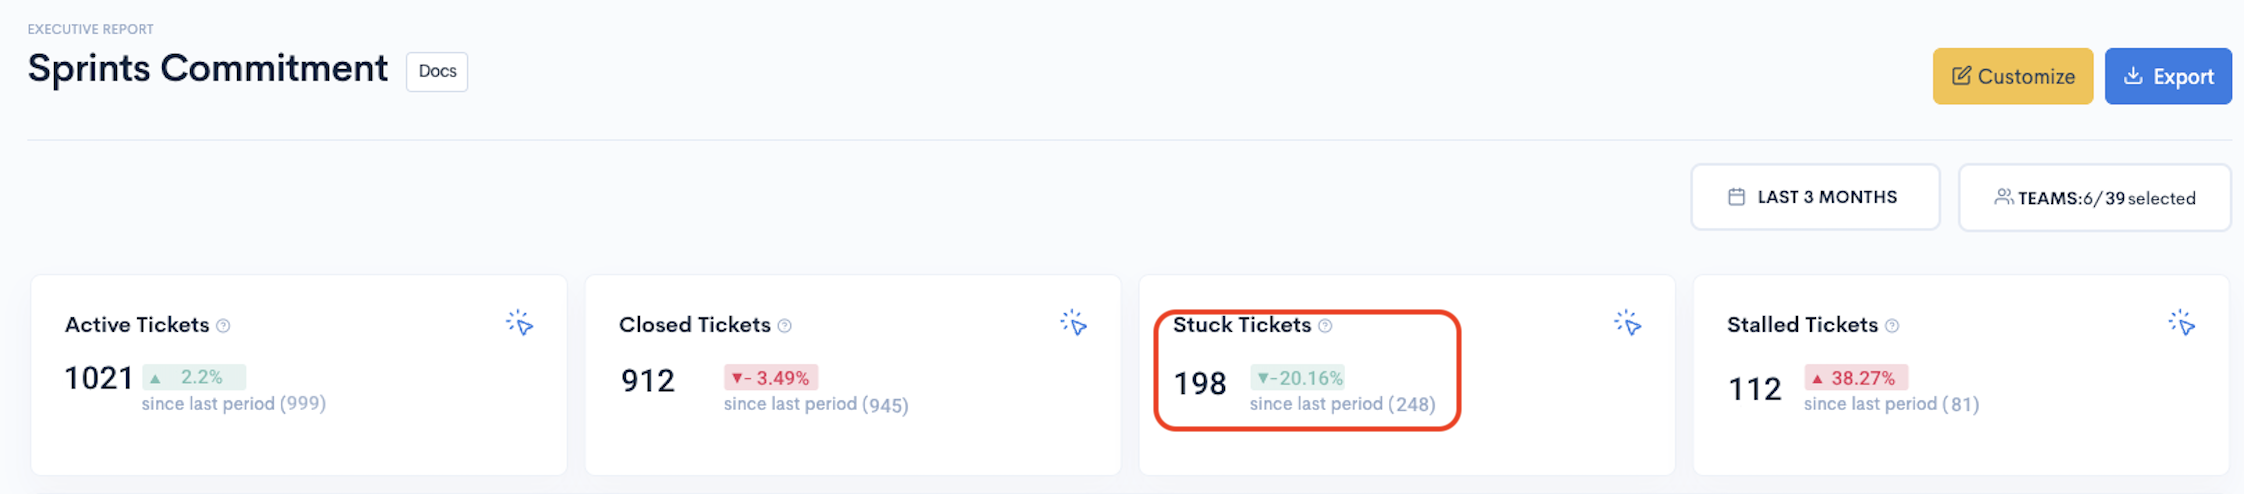
The four widgets at the top of the page are clickable. Clicking on a widget (e.g., "Stuck tickets") will display all relevant tickets within the selected time frame, allowing you to drill down into each one.
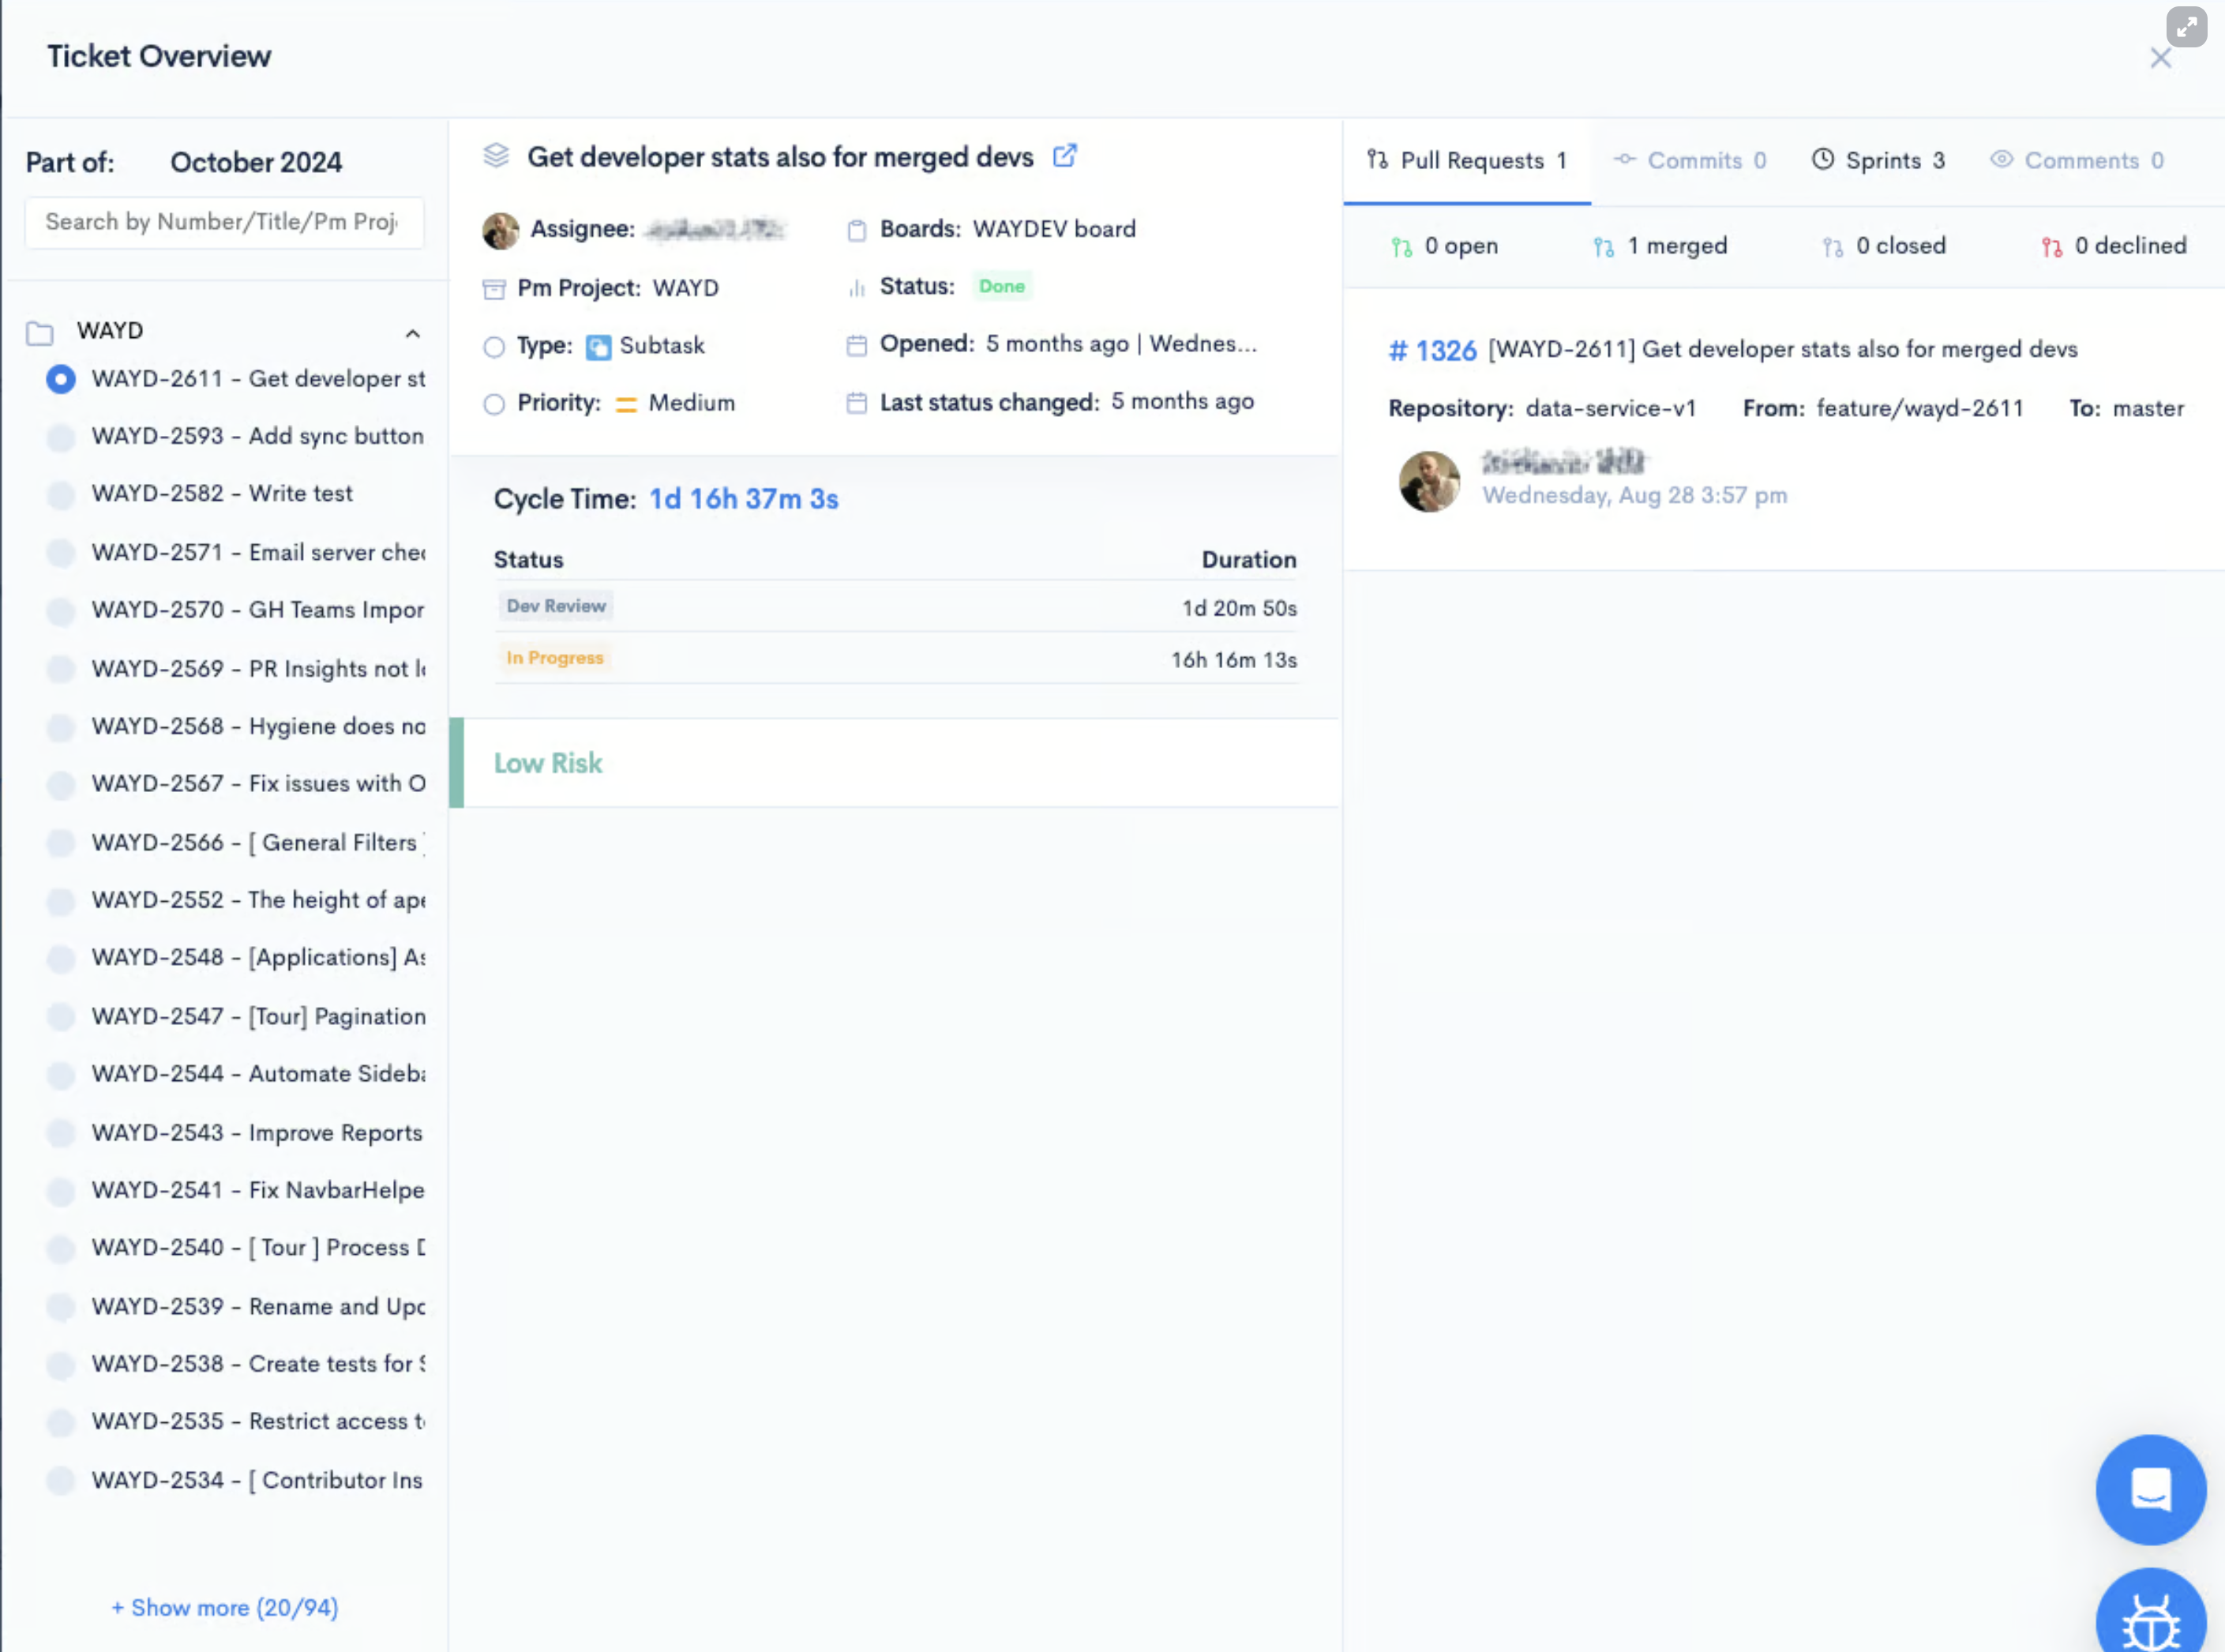
The modal offers all relevant information for the ticket. On the left, you will find a list of tickets for the selected time frame and teams, and you can search for a specific project by number, title, and project.
In the middle, there are all the identification details for the ticket:
- Assignee: The contributor to whom the ticket is assigned.
- PM Project: Title of the project.
- Type: Ticket type.
- Priority
- Boards: Name of the ticket's board.
- Status: Ticket status.
- Opened: Date the ticket was opened.
- Last status changed: When the ticket entered its current status.
- Cycle Time: Includes the duration for the ticket's previous statuses.
- Risk:
- Low Risk
- Medium Risk
- High Risk
The right side provides the ticket's associations:
- Pull Requests: with their status.
- Commits
- Sprints
- Comments
Glossary
- Total tickets: The total number of tickets created within the selected timeframe.
- To do tickets: The number of tickets that have not started yet.
- Active tickets: The number of tickets that are in an active state.
- Closed tickets: The number of tickets that have been closed.
- Unassigned tickets: The number of tickets that are not assigned to any contributor.
- Unplanned tickets: The number of tickets that were added to the sprint after the sprint started.
- Epicless tickets: The number of tickets that are not assigned to any epic.
- Unestimated tickets: The number of tickets that are missing a story points estimate.
- Unlinked tickets: The number of tickets that are not linked to any PR or commit.
- Stalled tickets: The total number of active tickets that have remained in the same state for the past 7 days.
- Stuck tickets: The total number of active tickets that don’t have any new Git activity for the past 7 days.
- Total subtasks: The total number of subtasks created within the selected timeframe.
- Total points: The total number of story points for tickets created within the selected timeframe.
- Points per tickets: The average number of story points per ticket.
Updated 10 months ago