

Hygiene
Overview of all the linked and unlinked PRs for all the active repositories
To access the Hygiene page, navigate to Hygiene within the Health section.
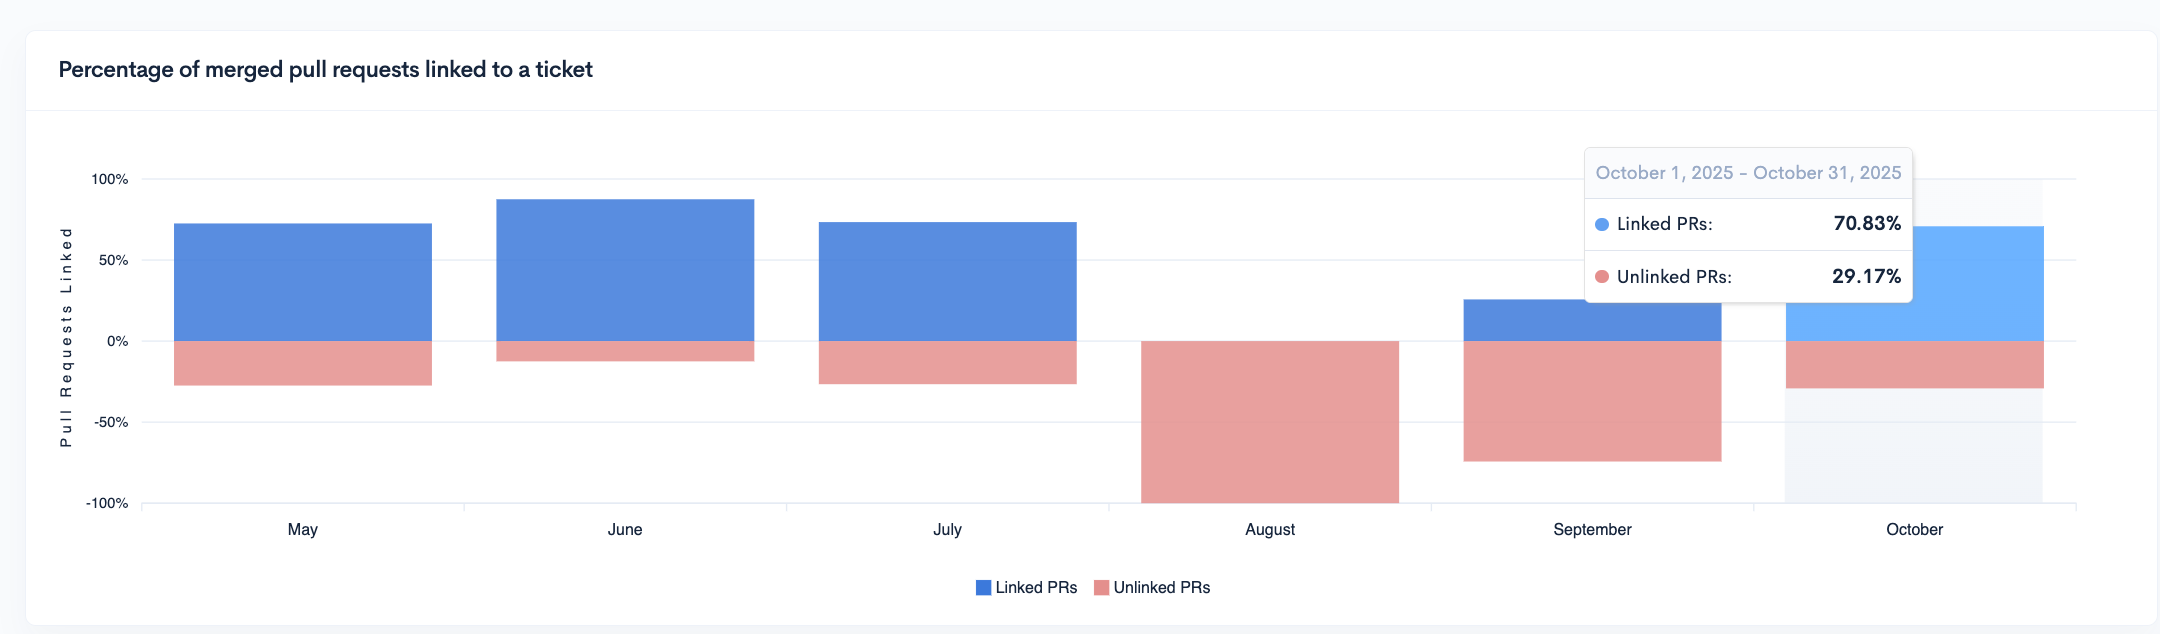
Percentage of merged pull requests linked to a ticket
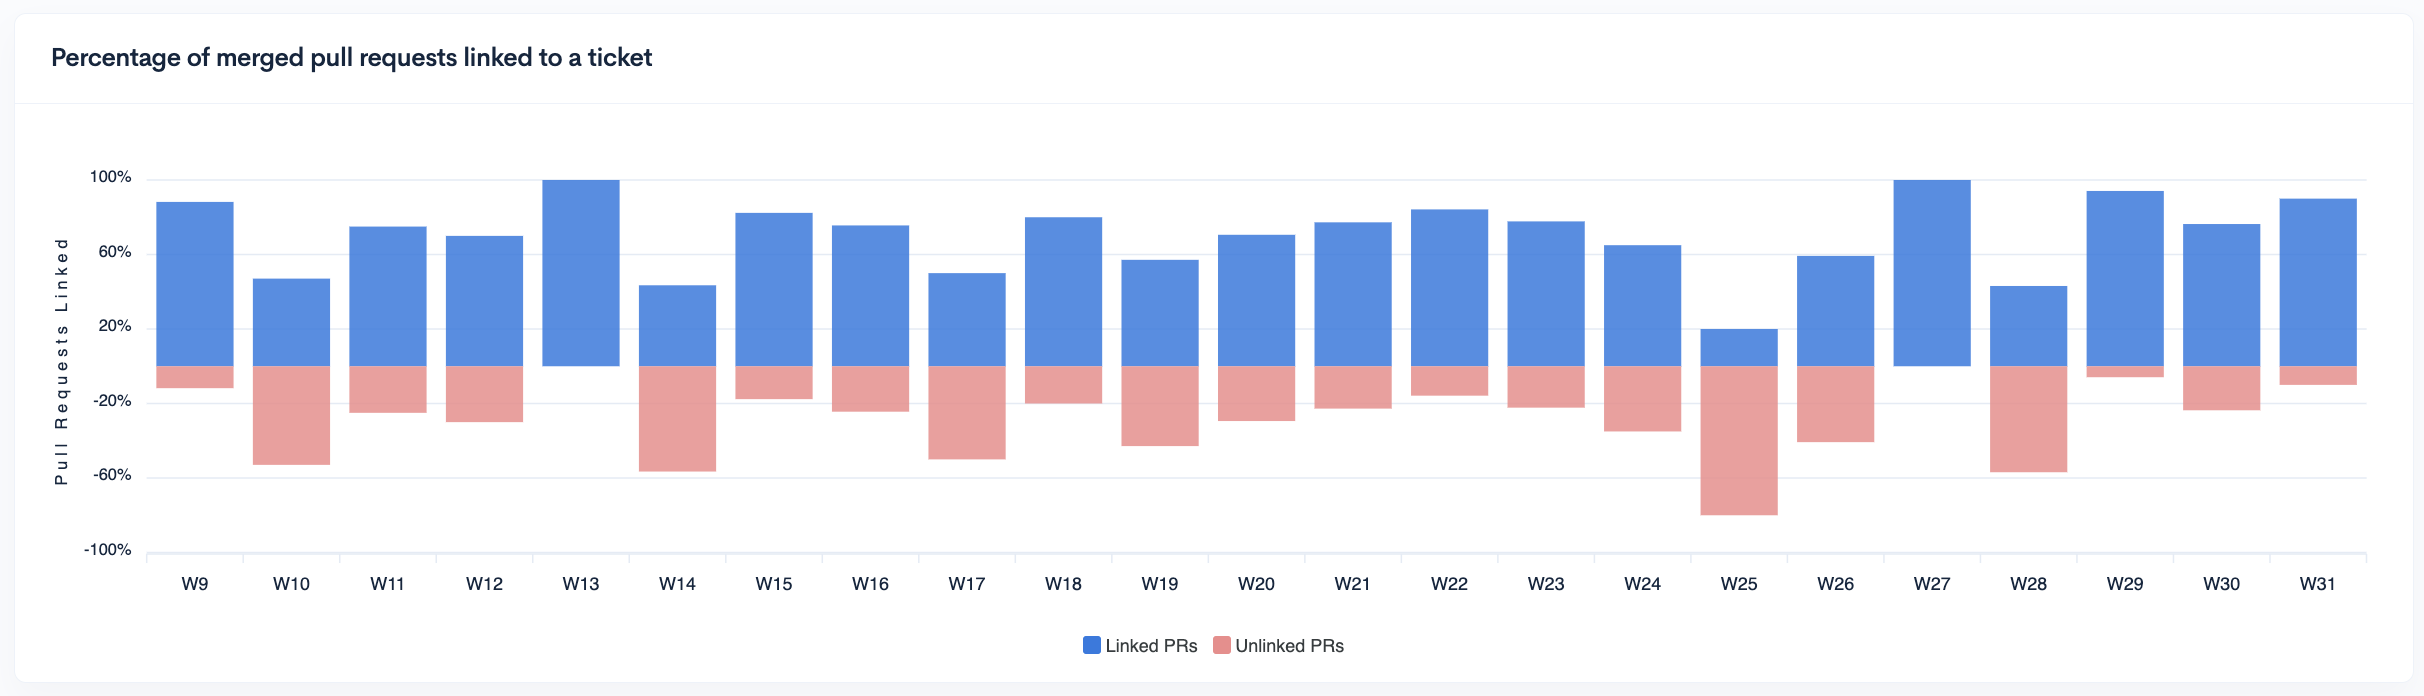
The graph shows the Linked PRs in relation to Unlinked PRs, grouped by weeks. This graph allows you to assess the adherence to best practices by showing the percentage of linked versus unlinked PRs. This information can then be used to make necessary adjustments (a higher percentage of red/unlinked PRs indicates that recommended procedures are not being followed).
Pull Requests by Repository
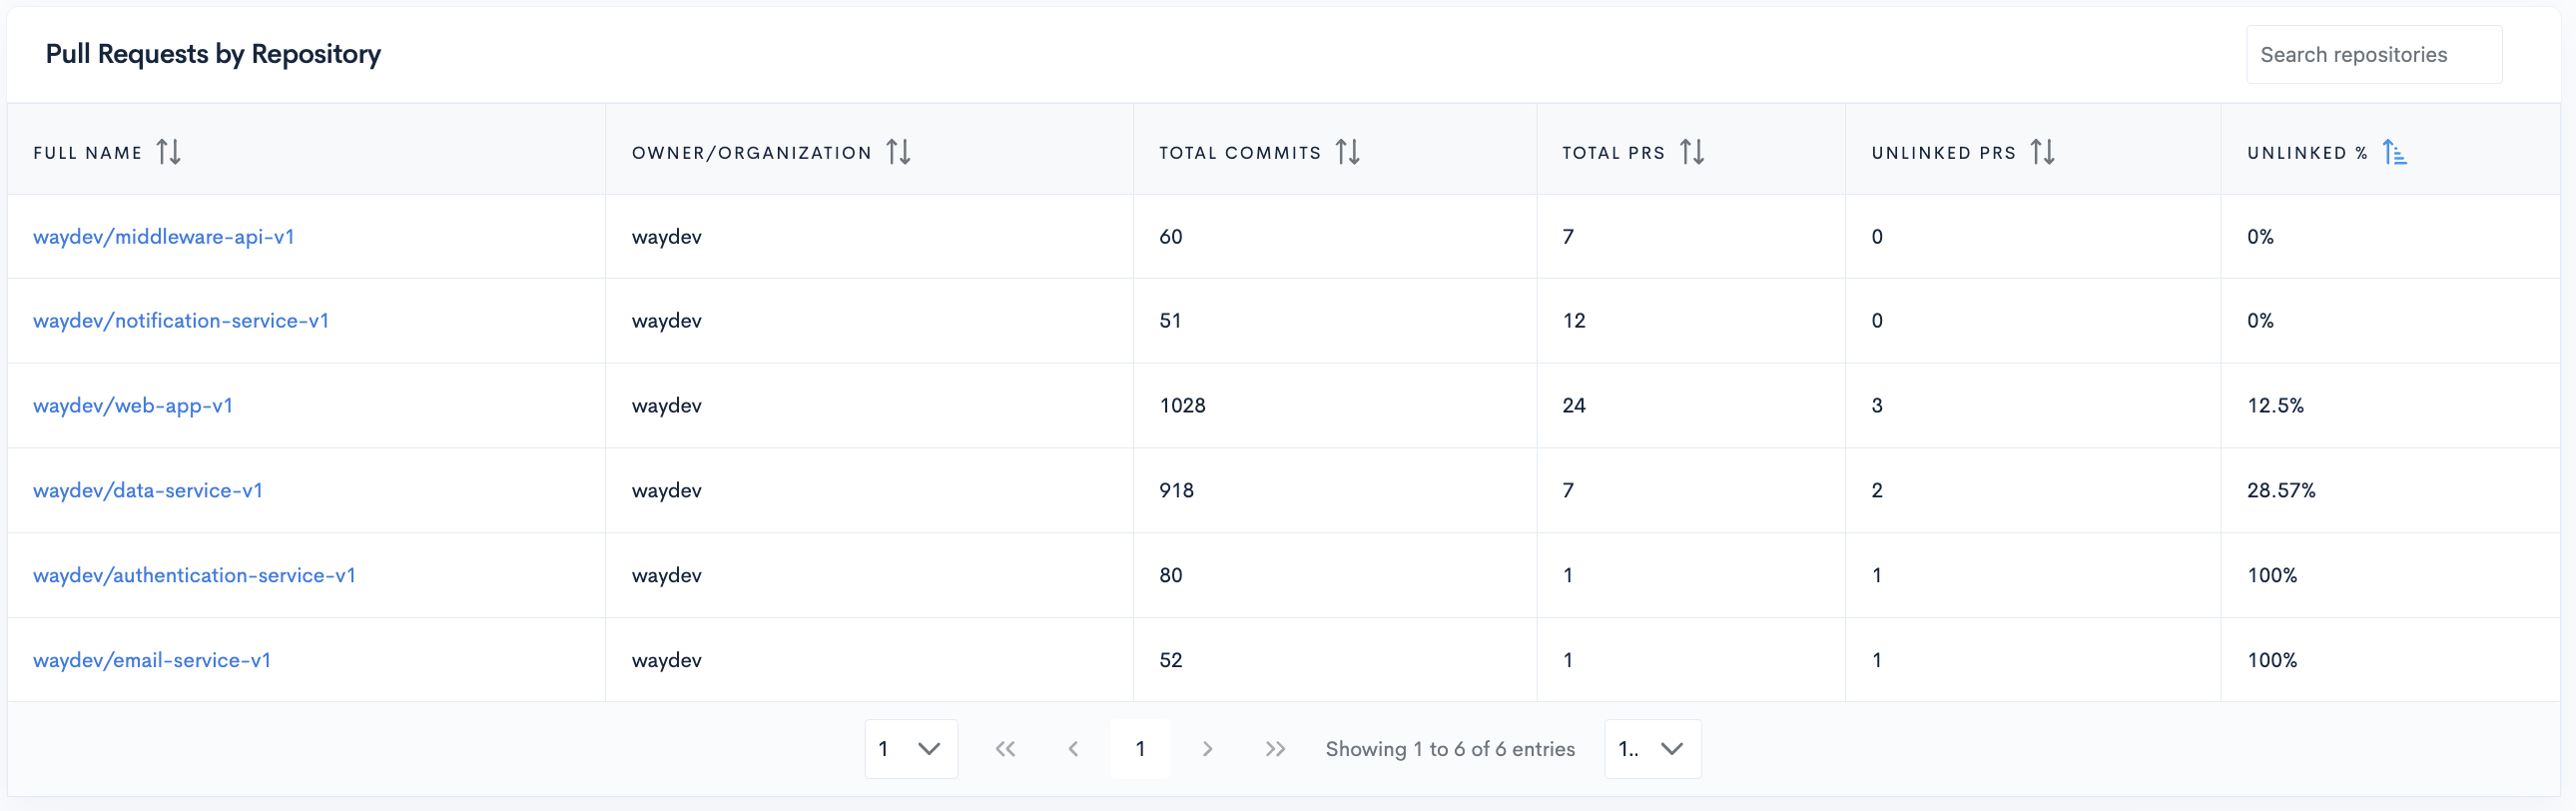
The Pull Requests by Repository table displays the following information:
- Total Commits in the repository
- Total PRs in the repository
- Unlinked PRs
- Unlinked % (the percentage of unlinked PRs in a repository)
You can click the repository name to go directly to the repo in your version control system.
Detailed view
You can view all the Linked or Unlinked PRs for the time period shown in the graph by clicking on their respective part of the bar.
This will open a modal with all the Linked or Unlinked PRs.
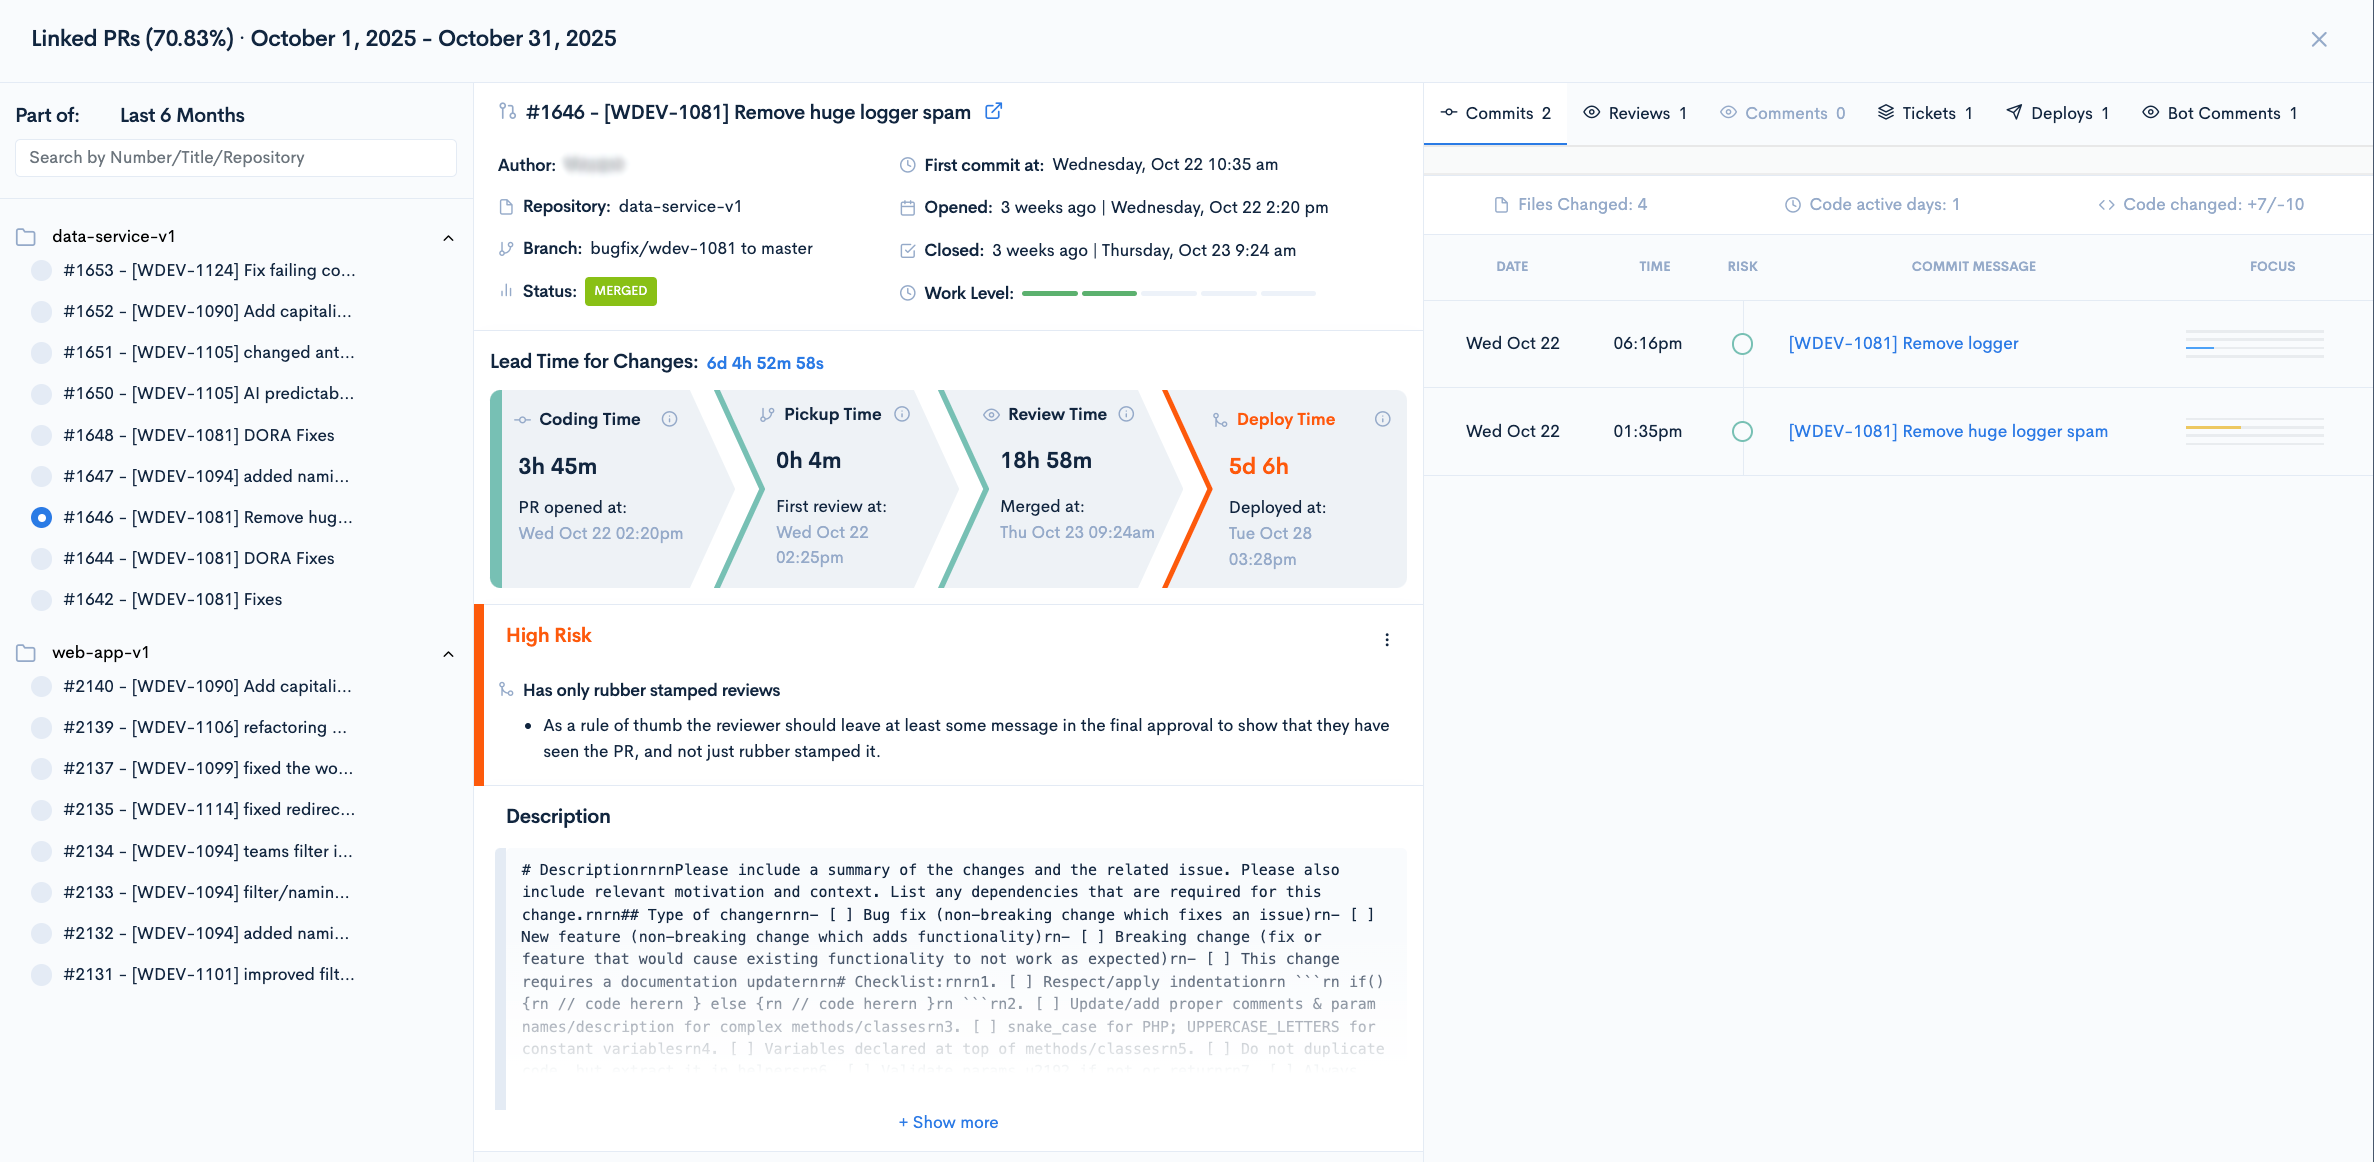
The modal contains:
- On the left, all PRs from that category, grouped by repository.
- Branch for the PR.
- Status of the PR.
- Time to first comment.
- Open/Closed dates.
- Work level - bars get filled based on difficulty.
- The Cycle Time of the PR.
- Risk: High/Medium/Low
- Description of the PR - follow the best practices
- Commits: the commits linked to the PR with an overview and a link to the commit.
- Reviews: Reviewers are listed here
- Comments: All the comments for the PR
- Tickets: The tickets linked to the PR.
- Deploys
- Bot comments
Updated 9 months ago