

Contributor Insights
The "Contributor Insights" dashboard provides a condensed overview of your engineering team members' recent activities, allowing you to better understand their work.
To see your team's insights, navigate to "Contributor Insights" in the Delivery section in the sidebar menu.
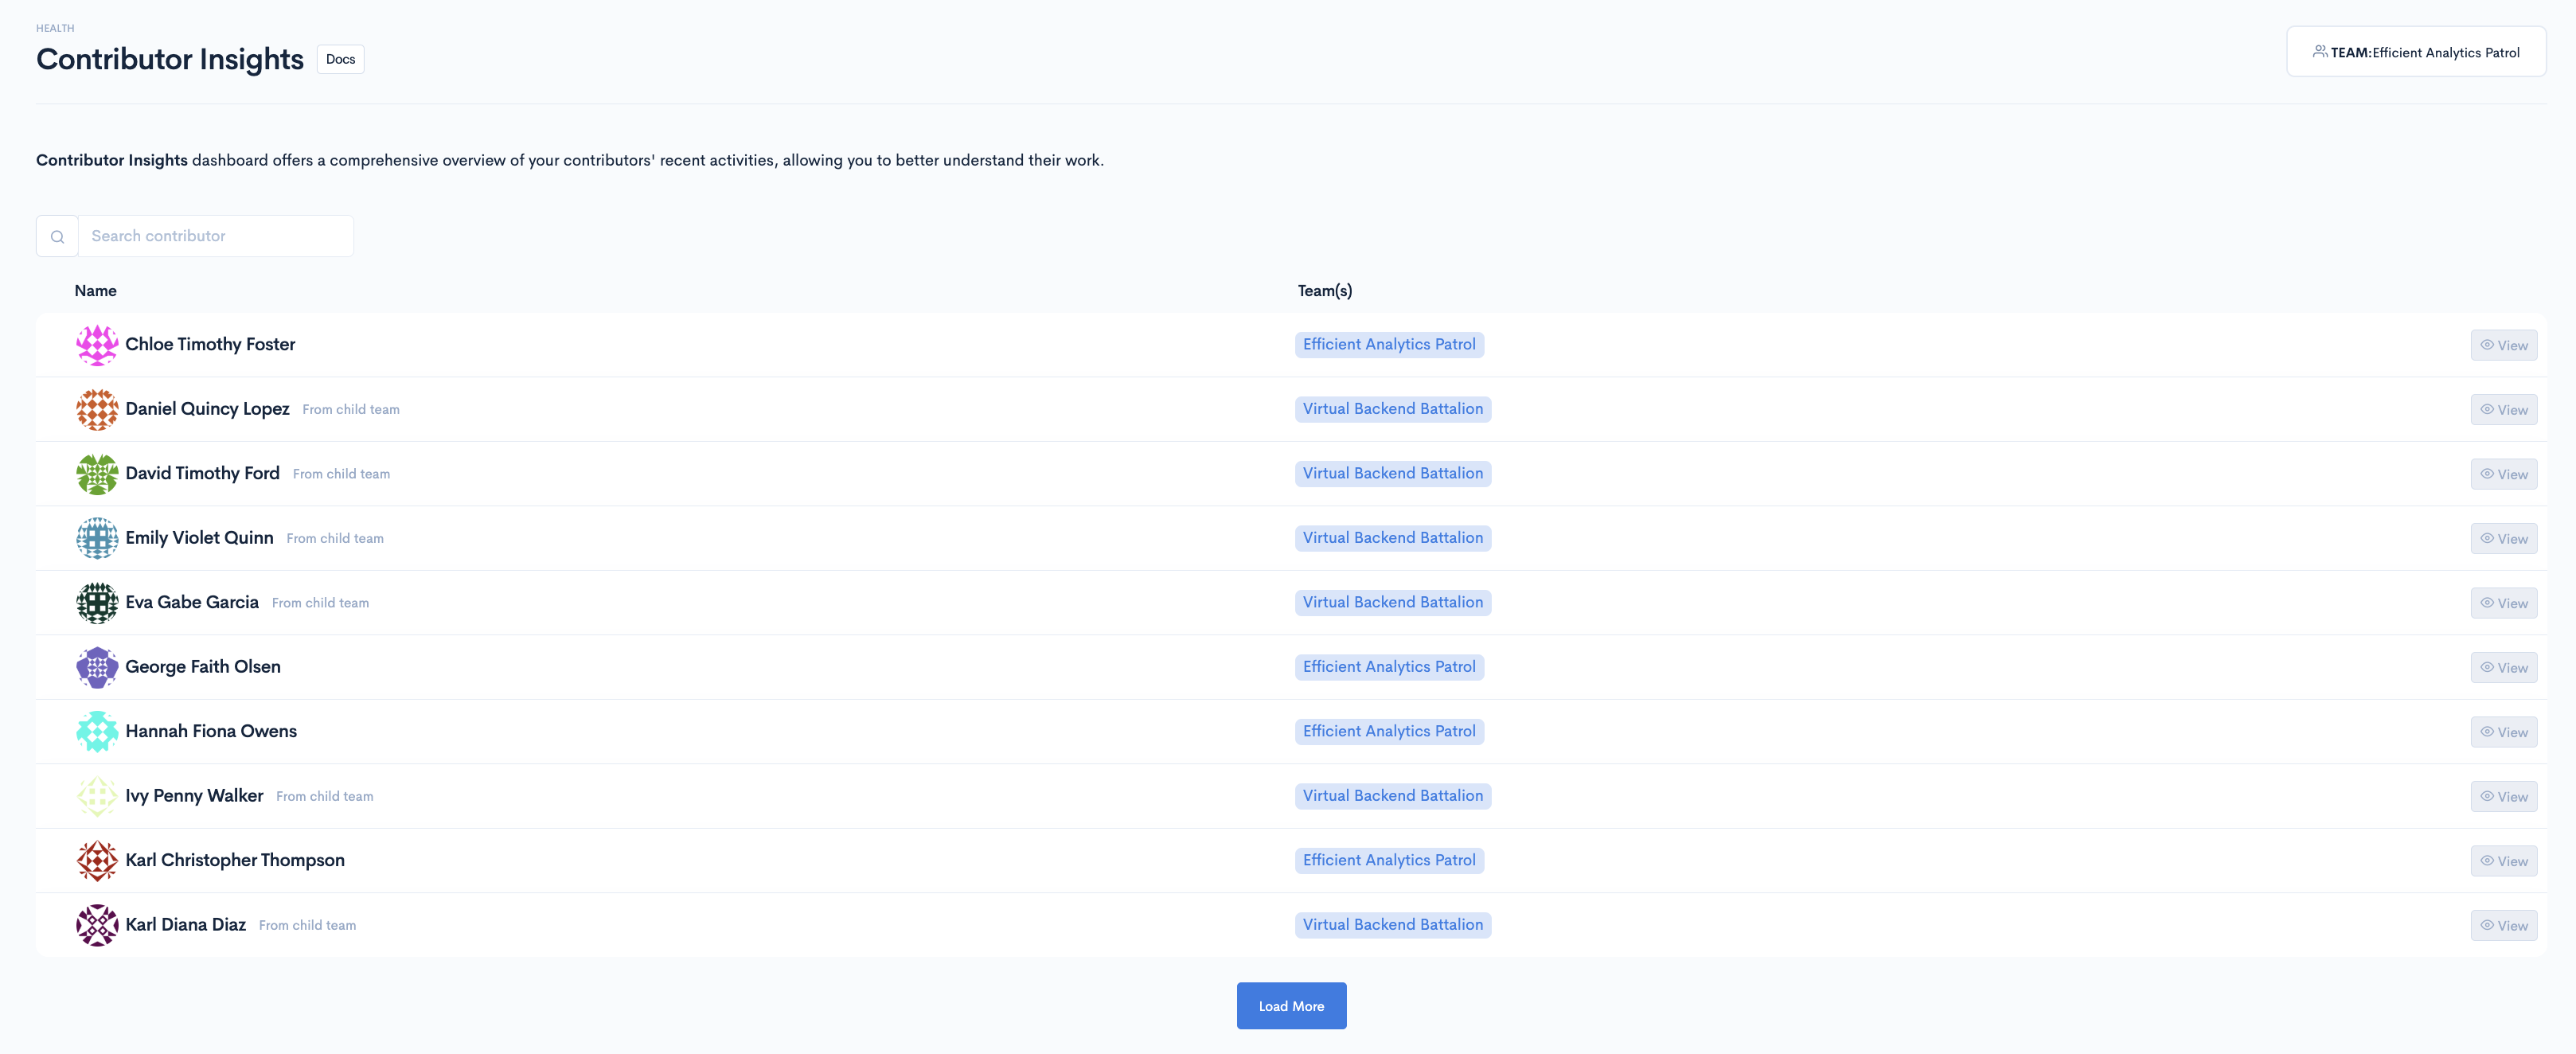
Select any contributor from the contributors list.
After clicking any contributor from the list, you'll be directed to their "Contributors Insights" page.
The "Contributor Insights" page has three tabs:
- Recent
- Activity
- Performance
Recent
This tab summarises the contributor's recent work in one easy-to-read dashboard.
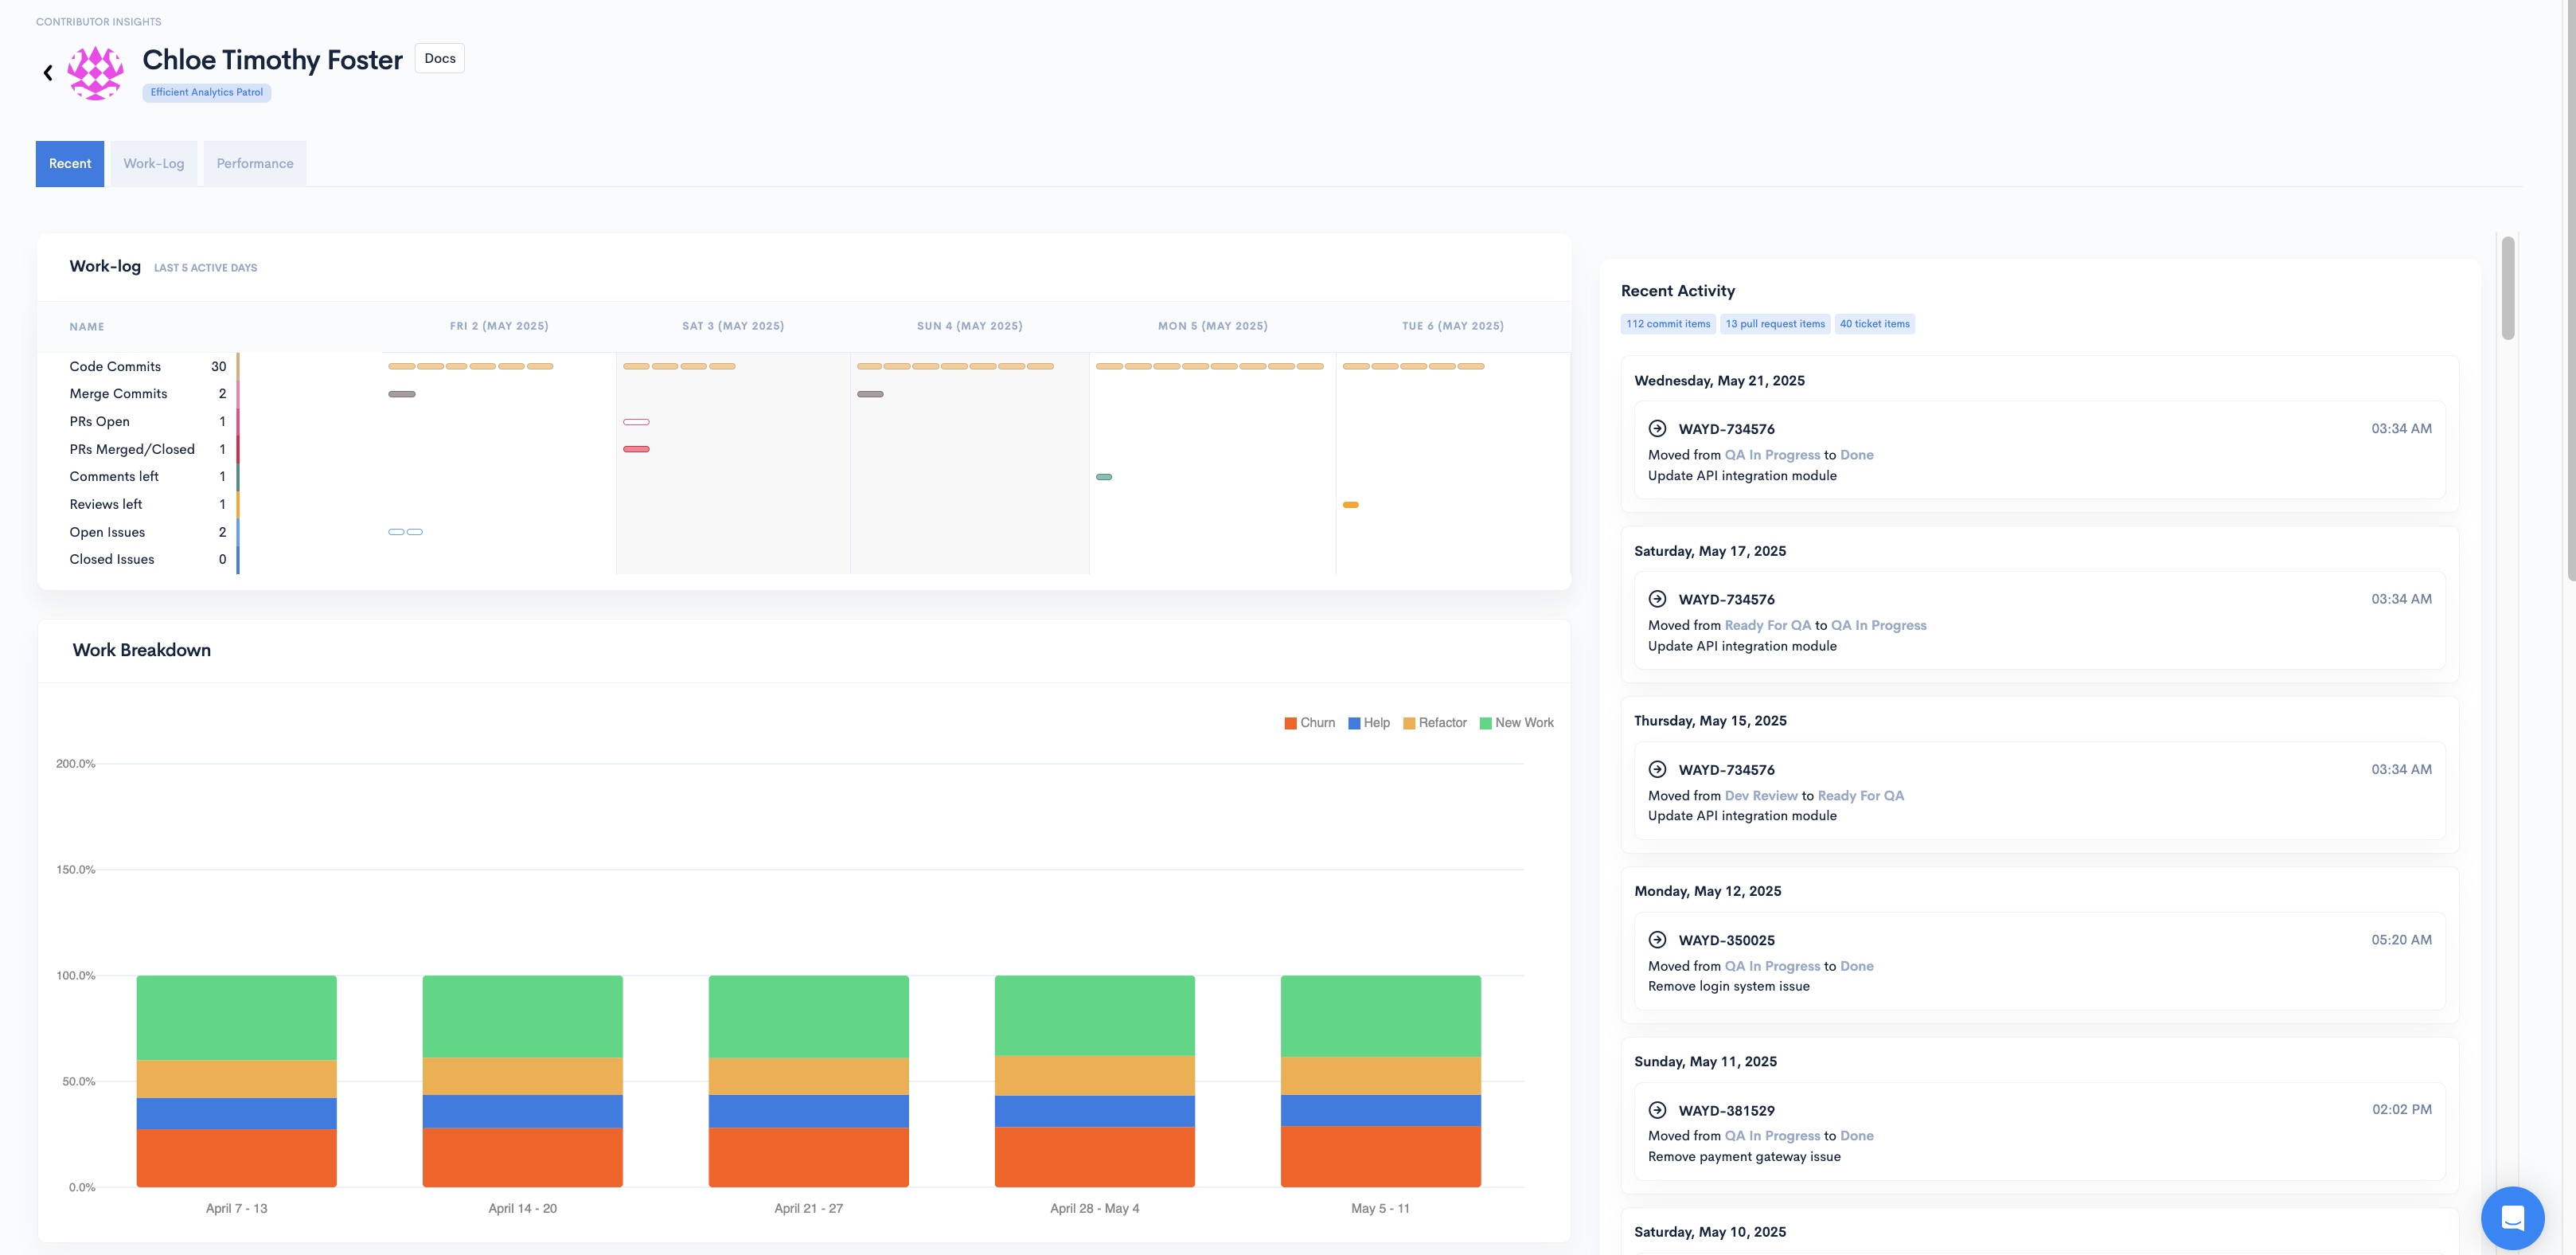
Here is what you'll see on the Recent tab:
Work-log
Here, you'll see an individual Work-log which encaptures activities from the last 5 active days.
The Work-log contains:
- Code Commits
- Merge Commits
- PRs Open
- PRs Merged/Closed
- PR Comments
- PR Reviews
- Open Issues
- Closed Issues
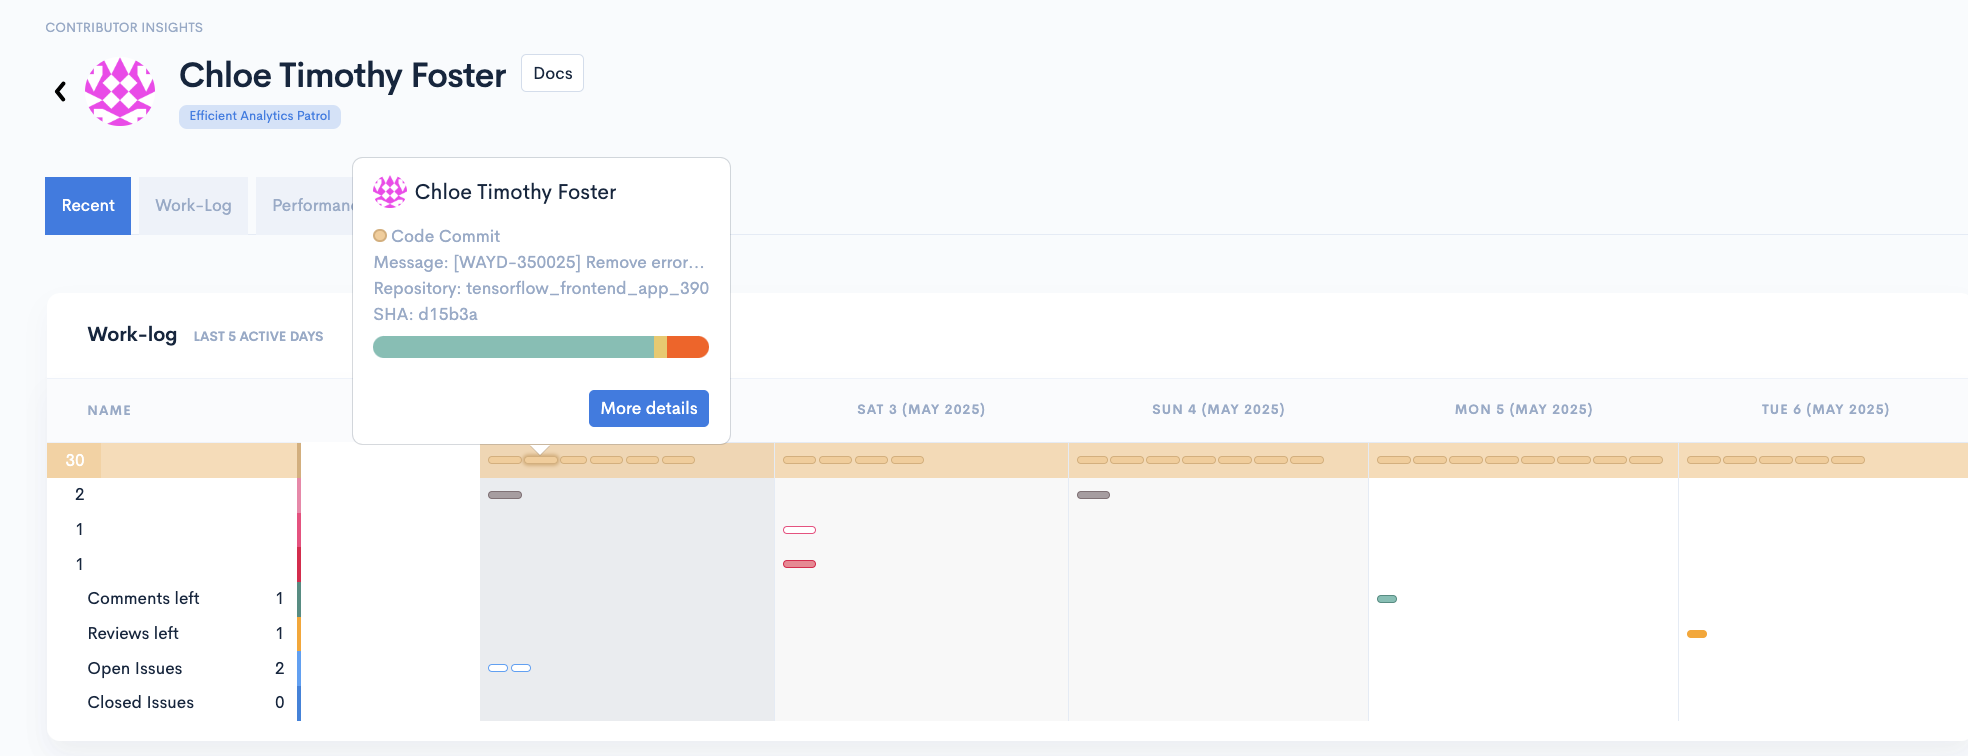
By hovering over the elements in the Work-log, you'll see a summary for that specific element.
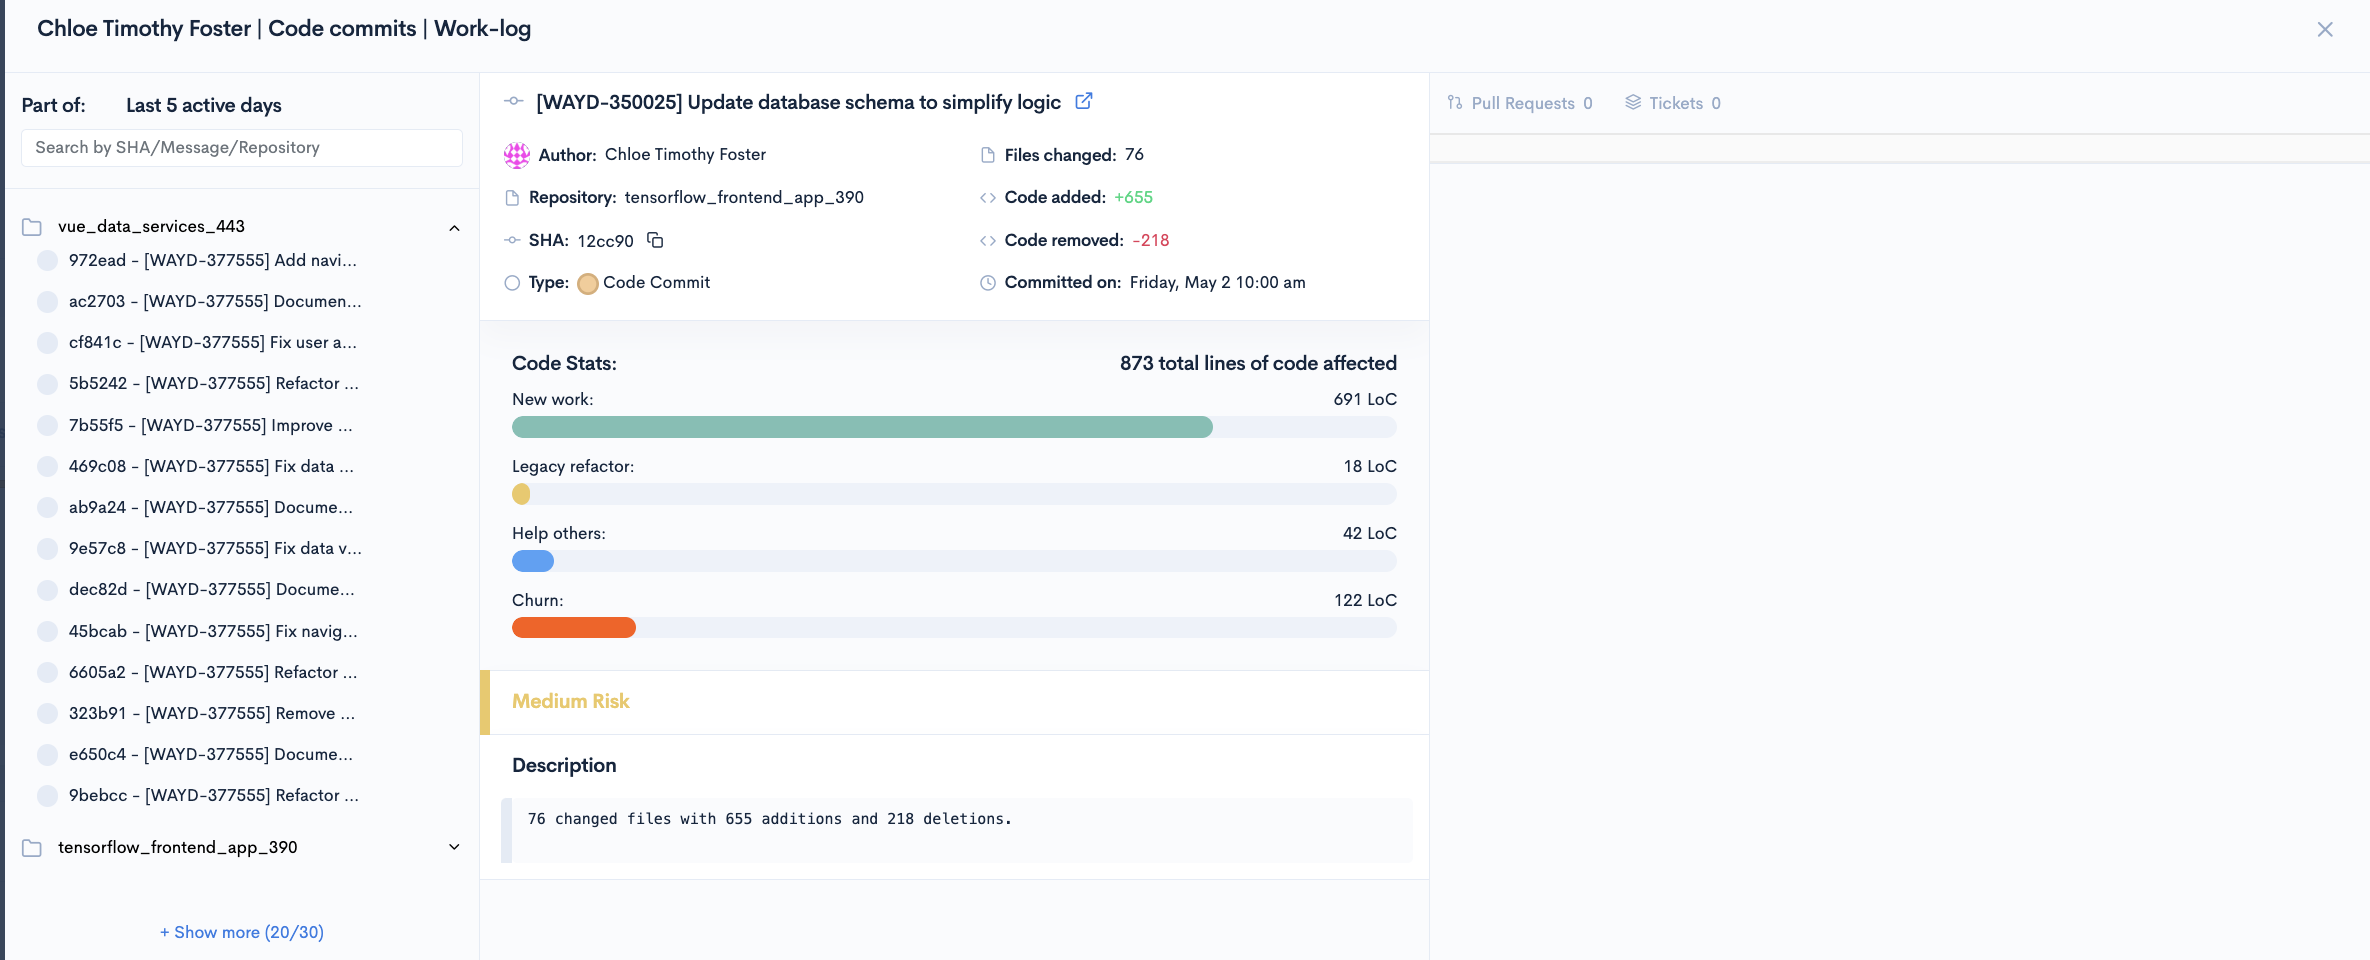
When you click on any symbol in the Work-Log, you can access detailed information about the work being done. The following information is available:
- The work focus
- The commit size
- The commit message
- The time of execution
- Pull Request reviews
- Pull Request comments
- The time to first comment
- The status of the pull request
- The commit timeline of the pull request
- The repository where the work was done
Work Breakdown
The Work Breakdown is a visual representation of the work focus of the past 9 weeks.
- Churn - when a contributor re-writes their own code shortly after it has been checked in - less than 21 days old.
- Help - describes how much a contributor is replacing another contributor's recent code - less than 21 days old.
- Refactor - the process of improving the structure of an old or unfamiliar code (after 21 days).
- New Work - brand new code that does not replace other code.
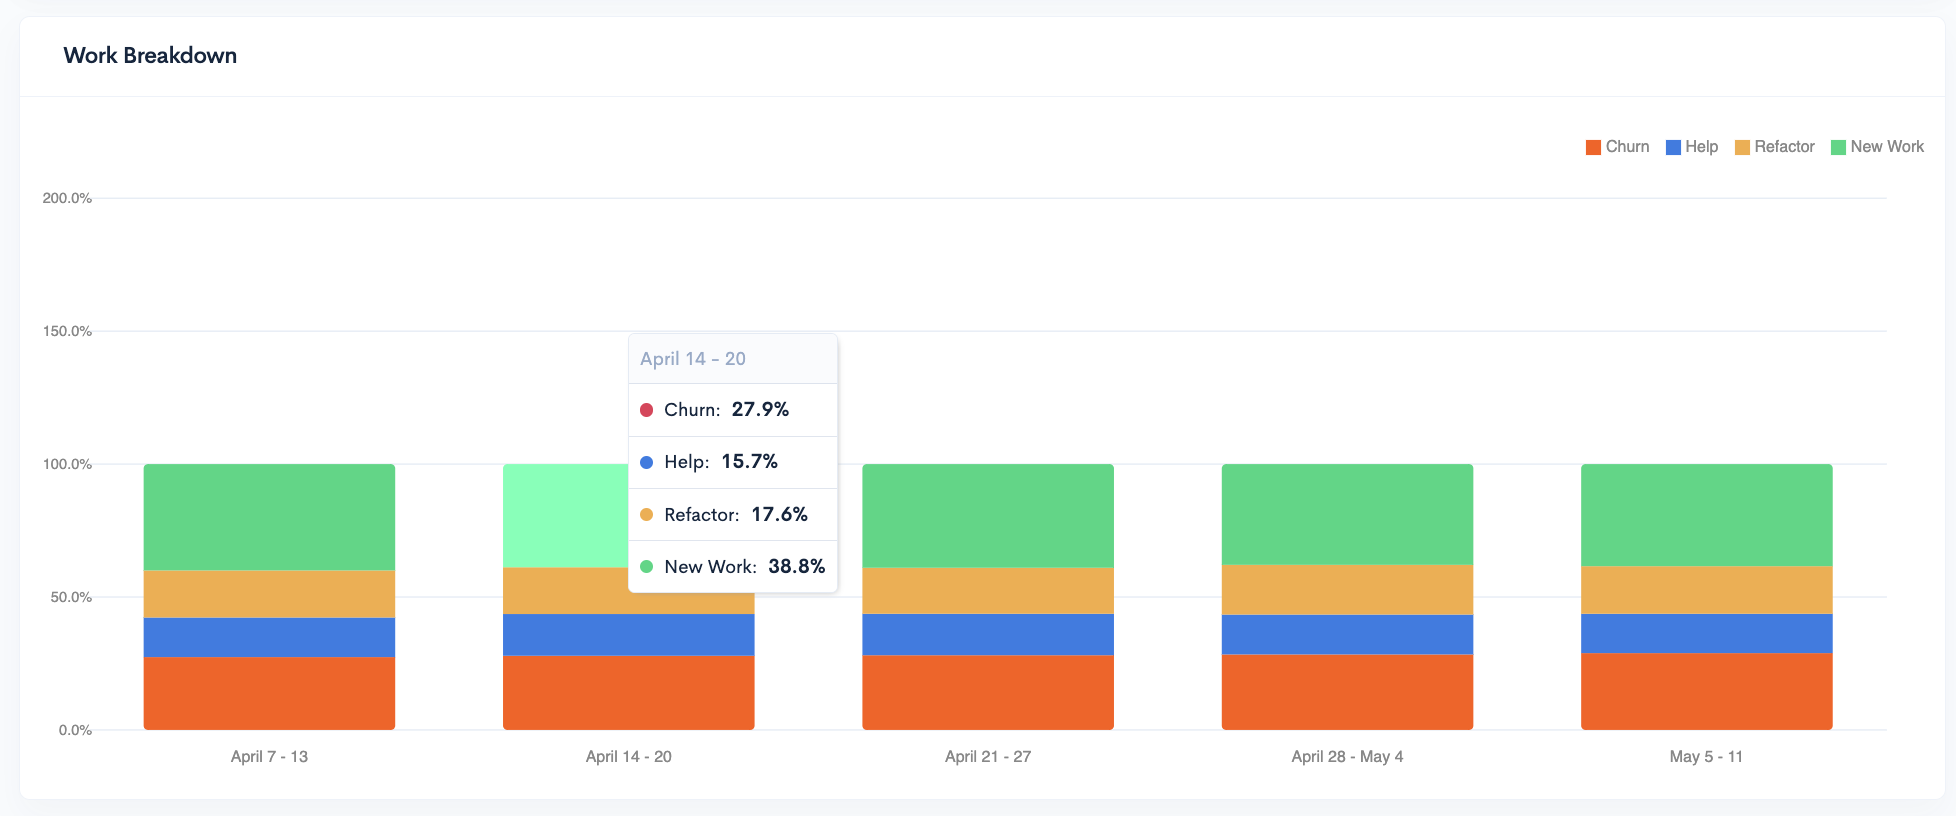
For a better understanding of the graph, hover over it and see the exact percentage of each type of work for a timeframe.
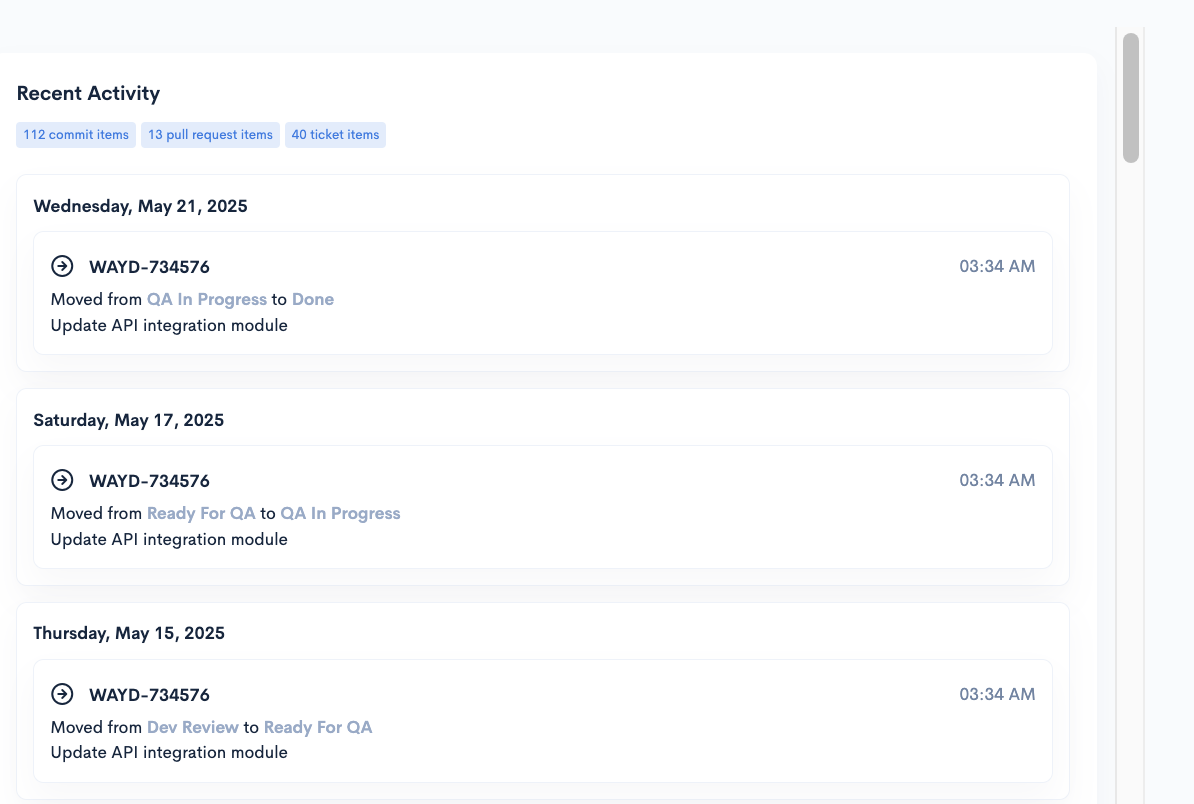
Recent Activity
The Recent Activity list shows a list of commits, PRs, PR reviews, PR comments, and ticket transitions in the past week.
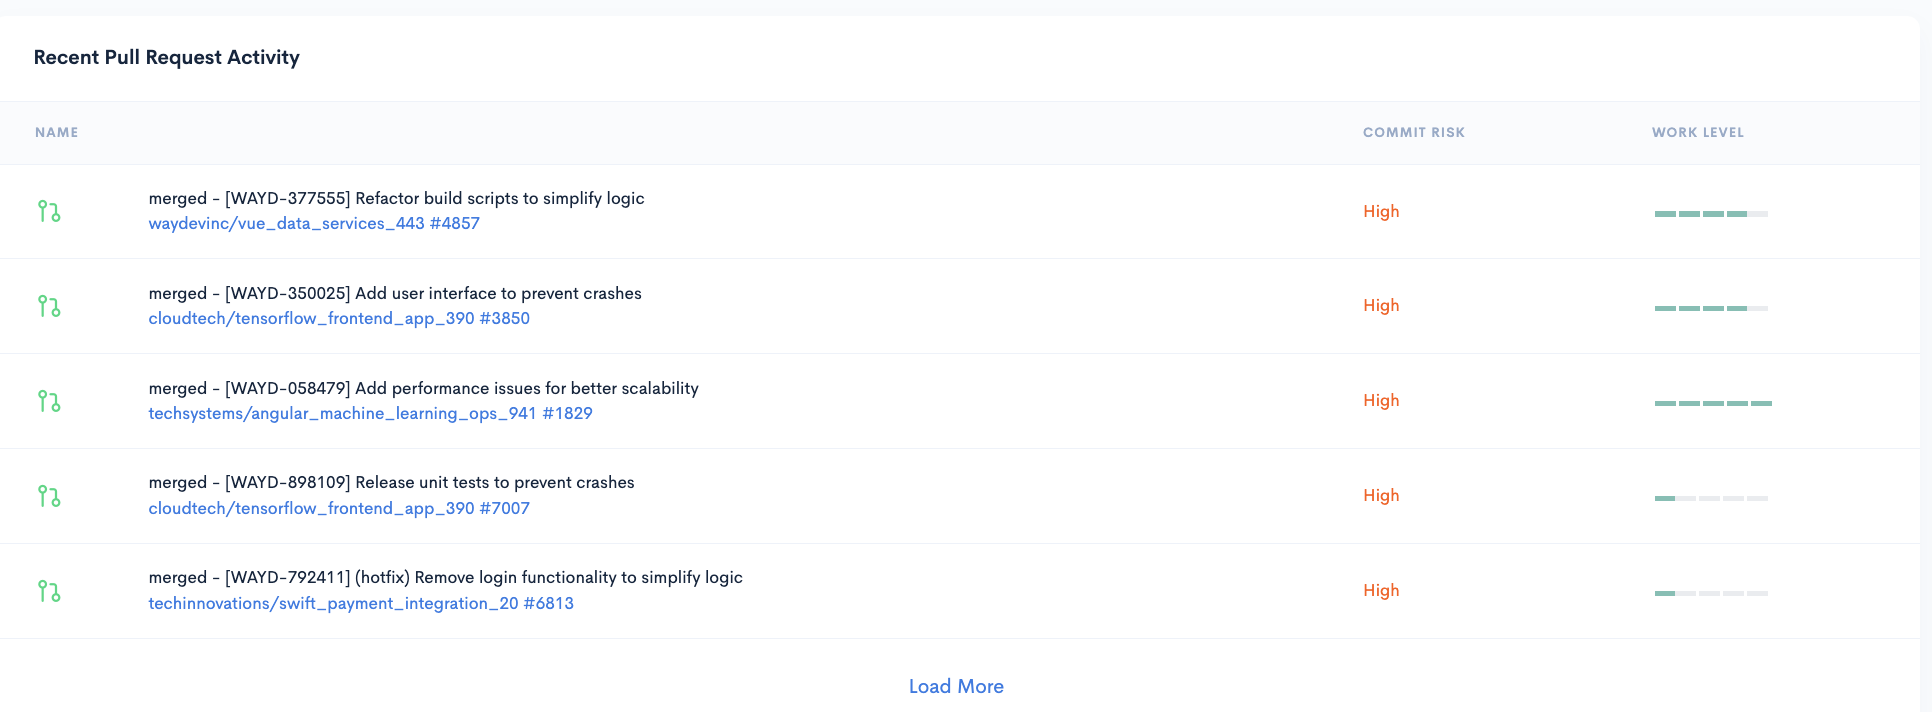
Recent Pull Request Activity
The Recent Pull Request Activity displays all the pull request activity from the past week. Clicking on any Pull Request activity from the list will redirect you to your git provider.
Recent Risky Commits
The Recent Risky Commits list displays all the risky commits from the past week, showing their level of risk and churn percentage.
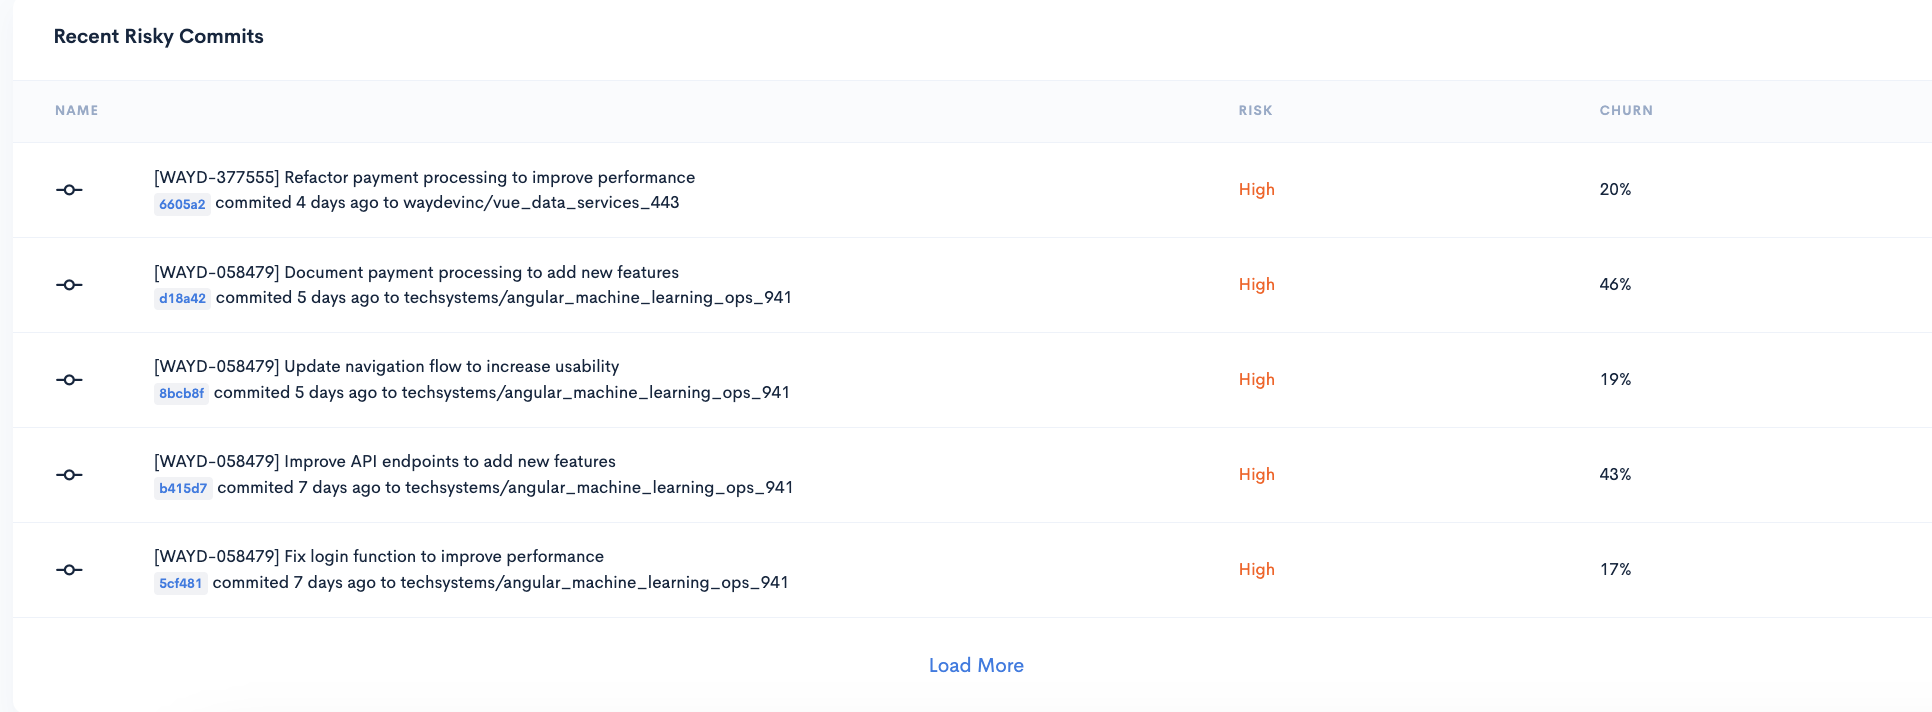
Clicking on the commit number redirects you to the commit page in the git provider.
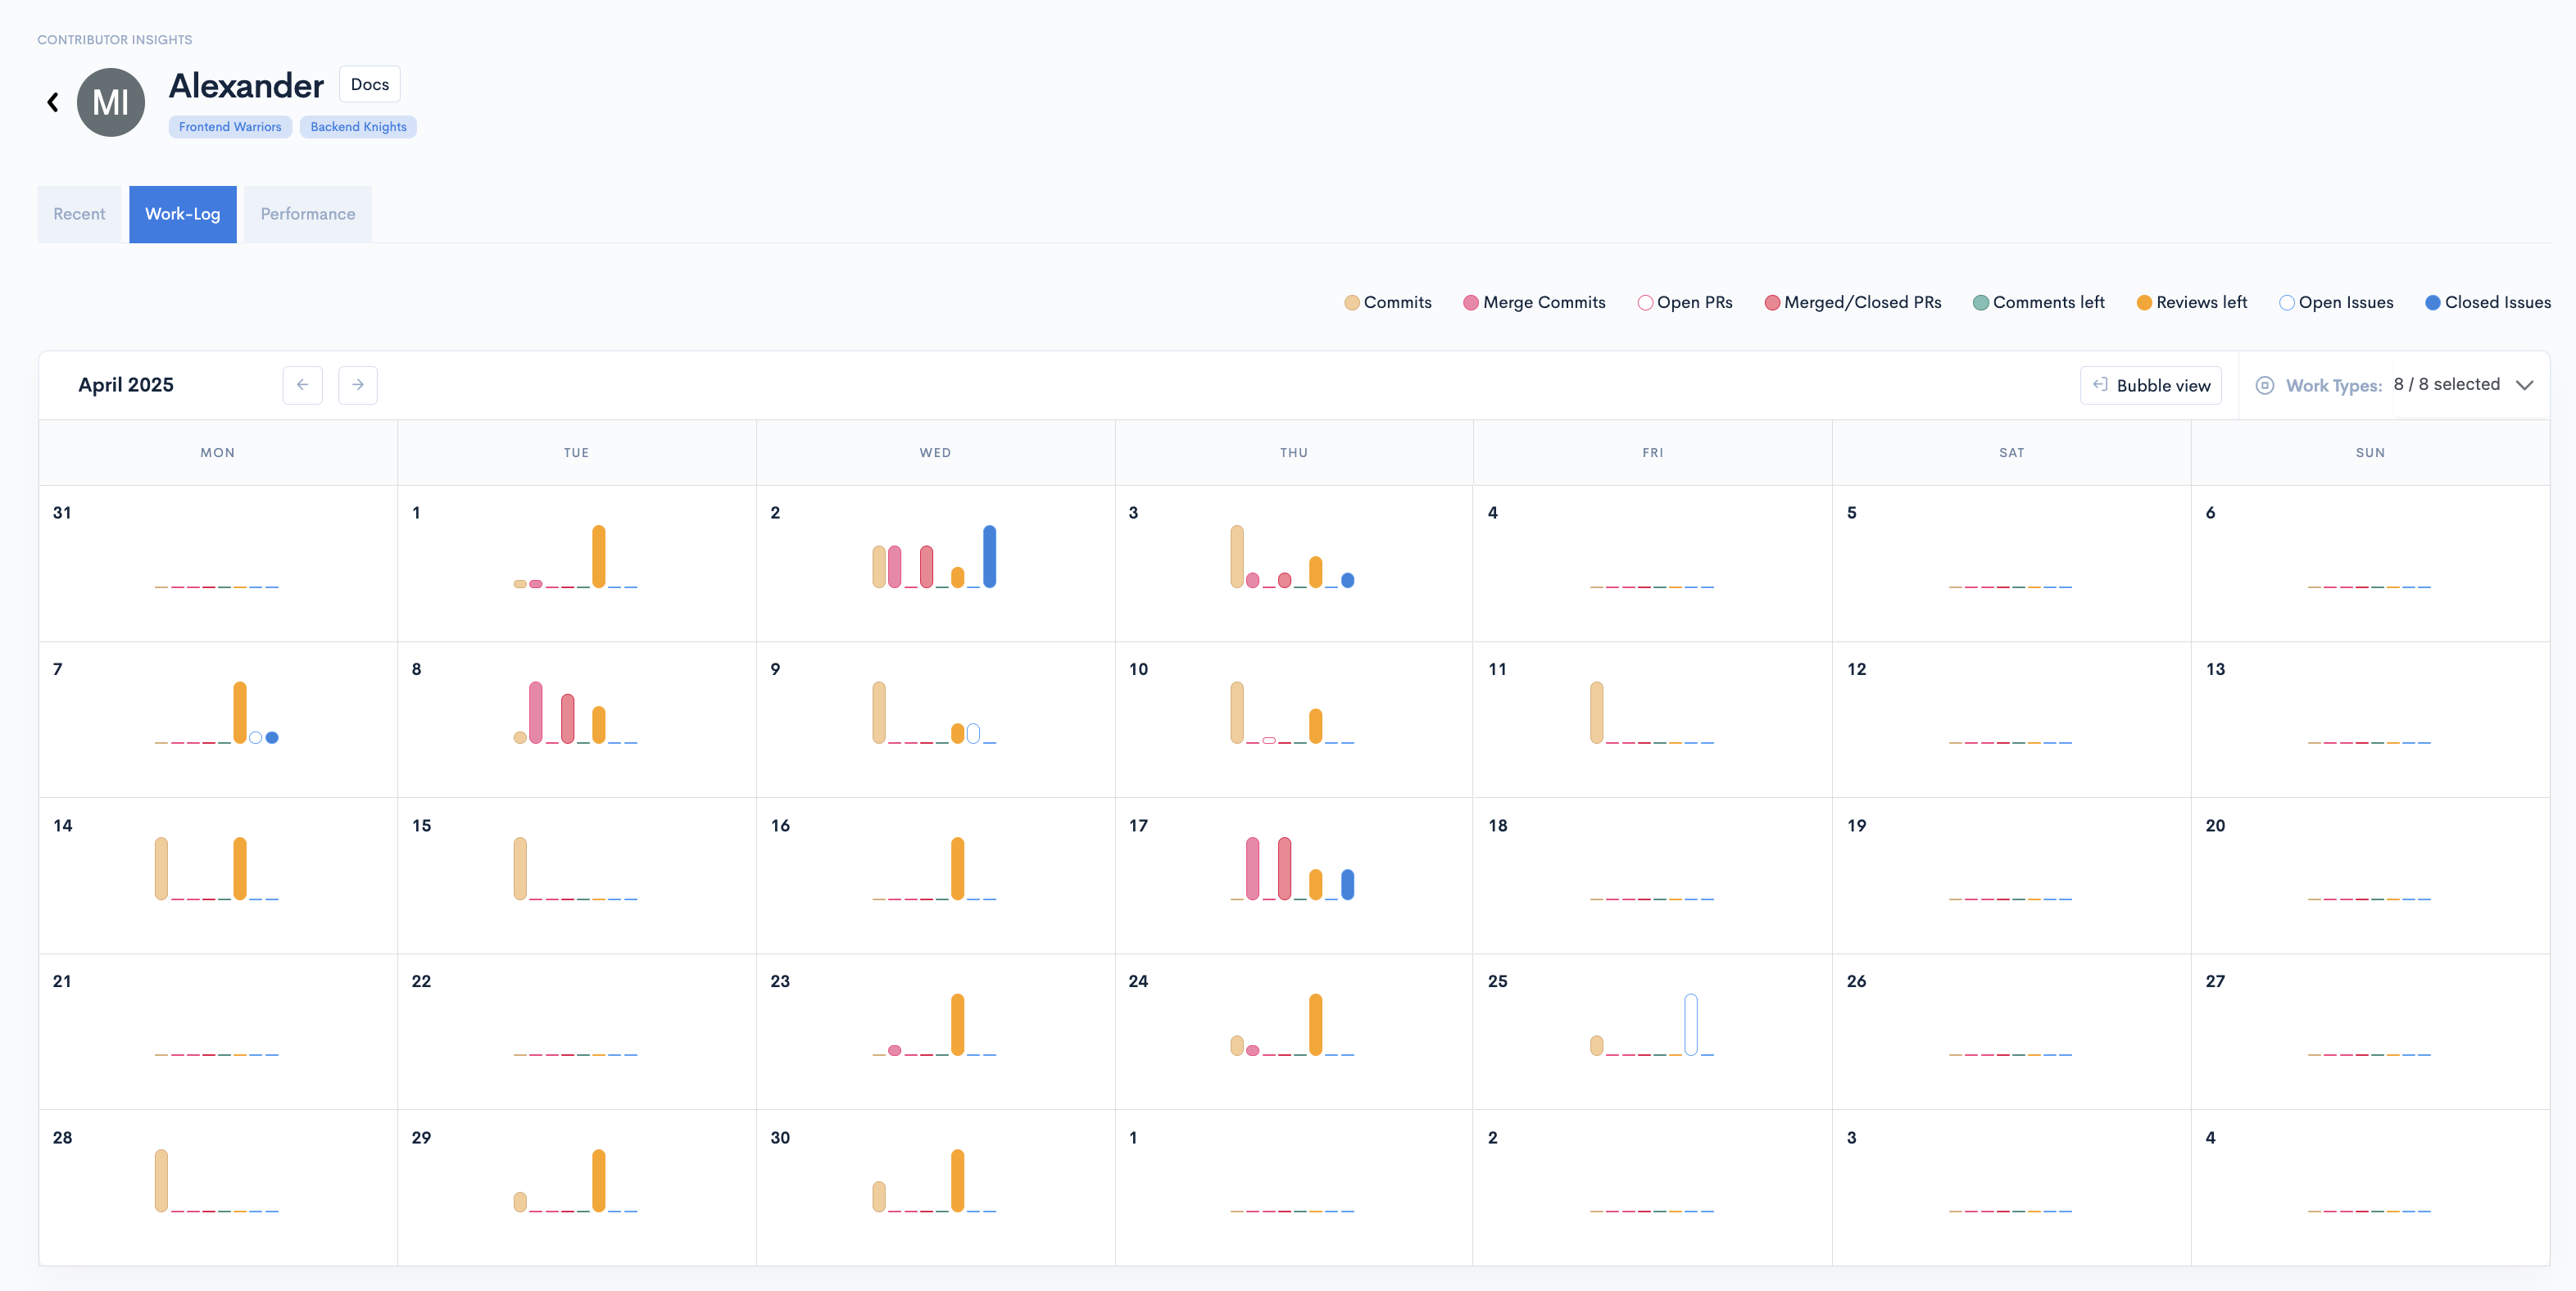
Work-Log
The Work-log contains:
- Code Commits
- Merge Commits
- PRs Open
- PRs Merged/Closed
- PR Comments
- PR Reviews
- Open Issues
- Closed Issues
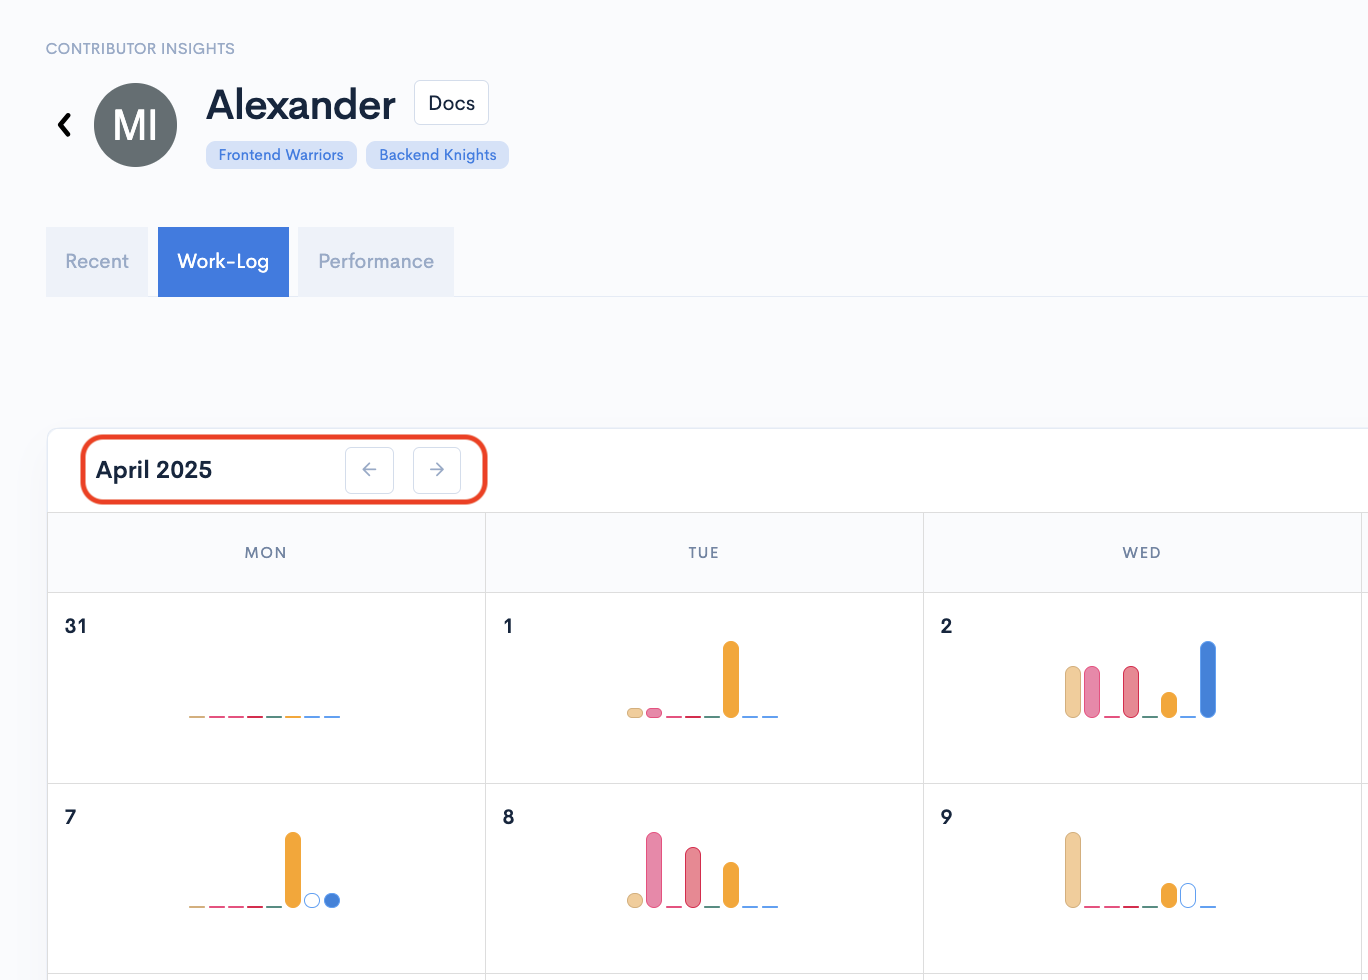
You can select another month than the last one by clicking the arrows next to the date.
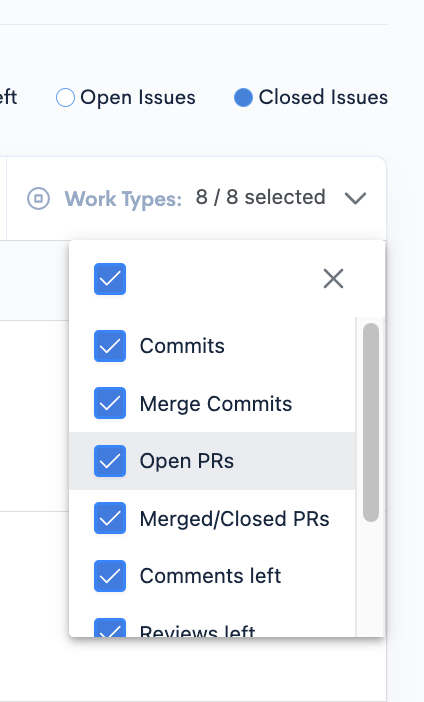
You can select the work type you want to visualize from the "Work Types" dropdown in the upper-right corner of the Work-log.
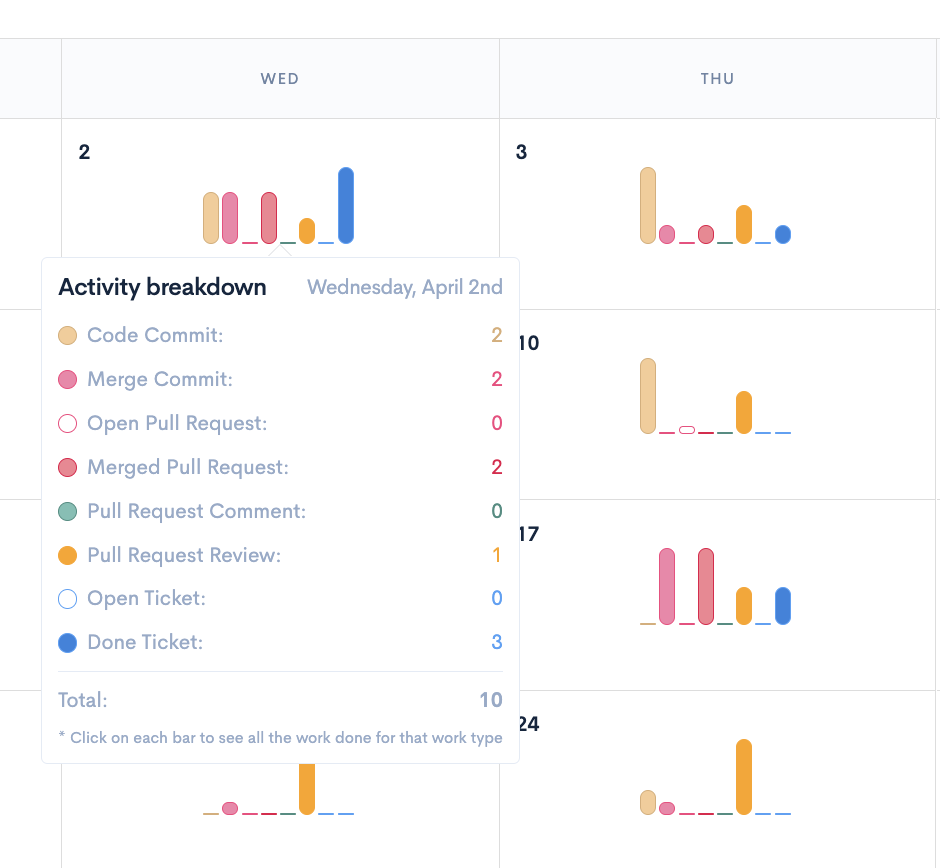
You can switch the view between Compact view and Bubble view.
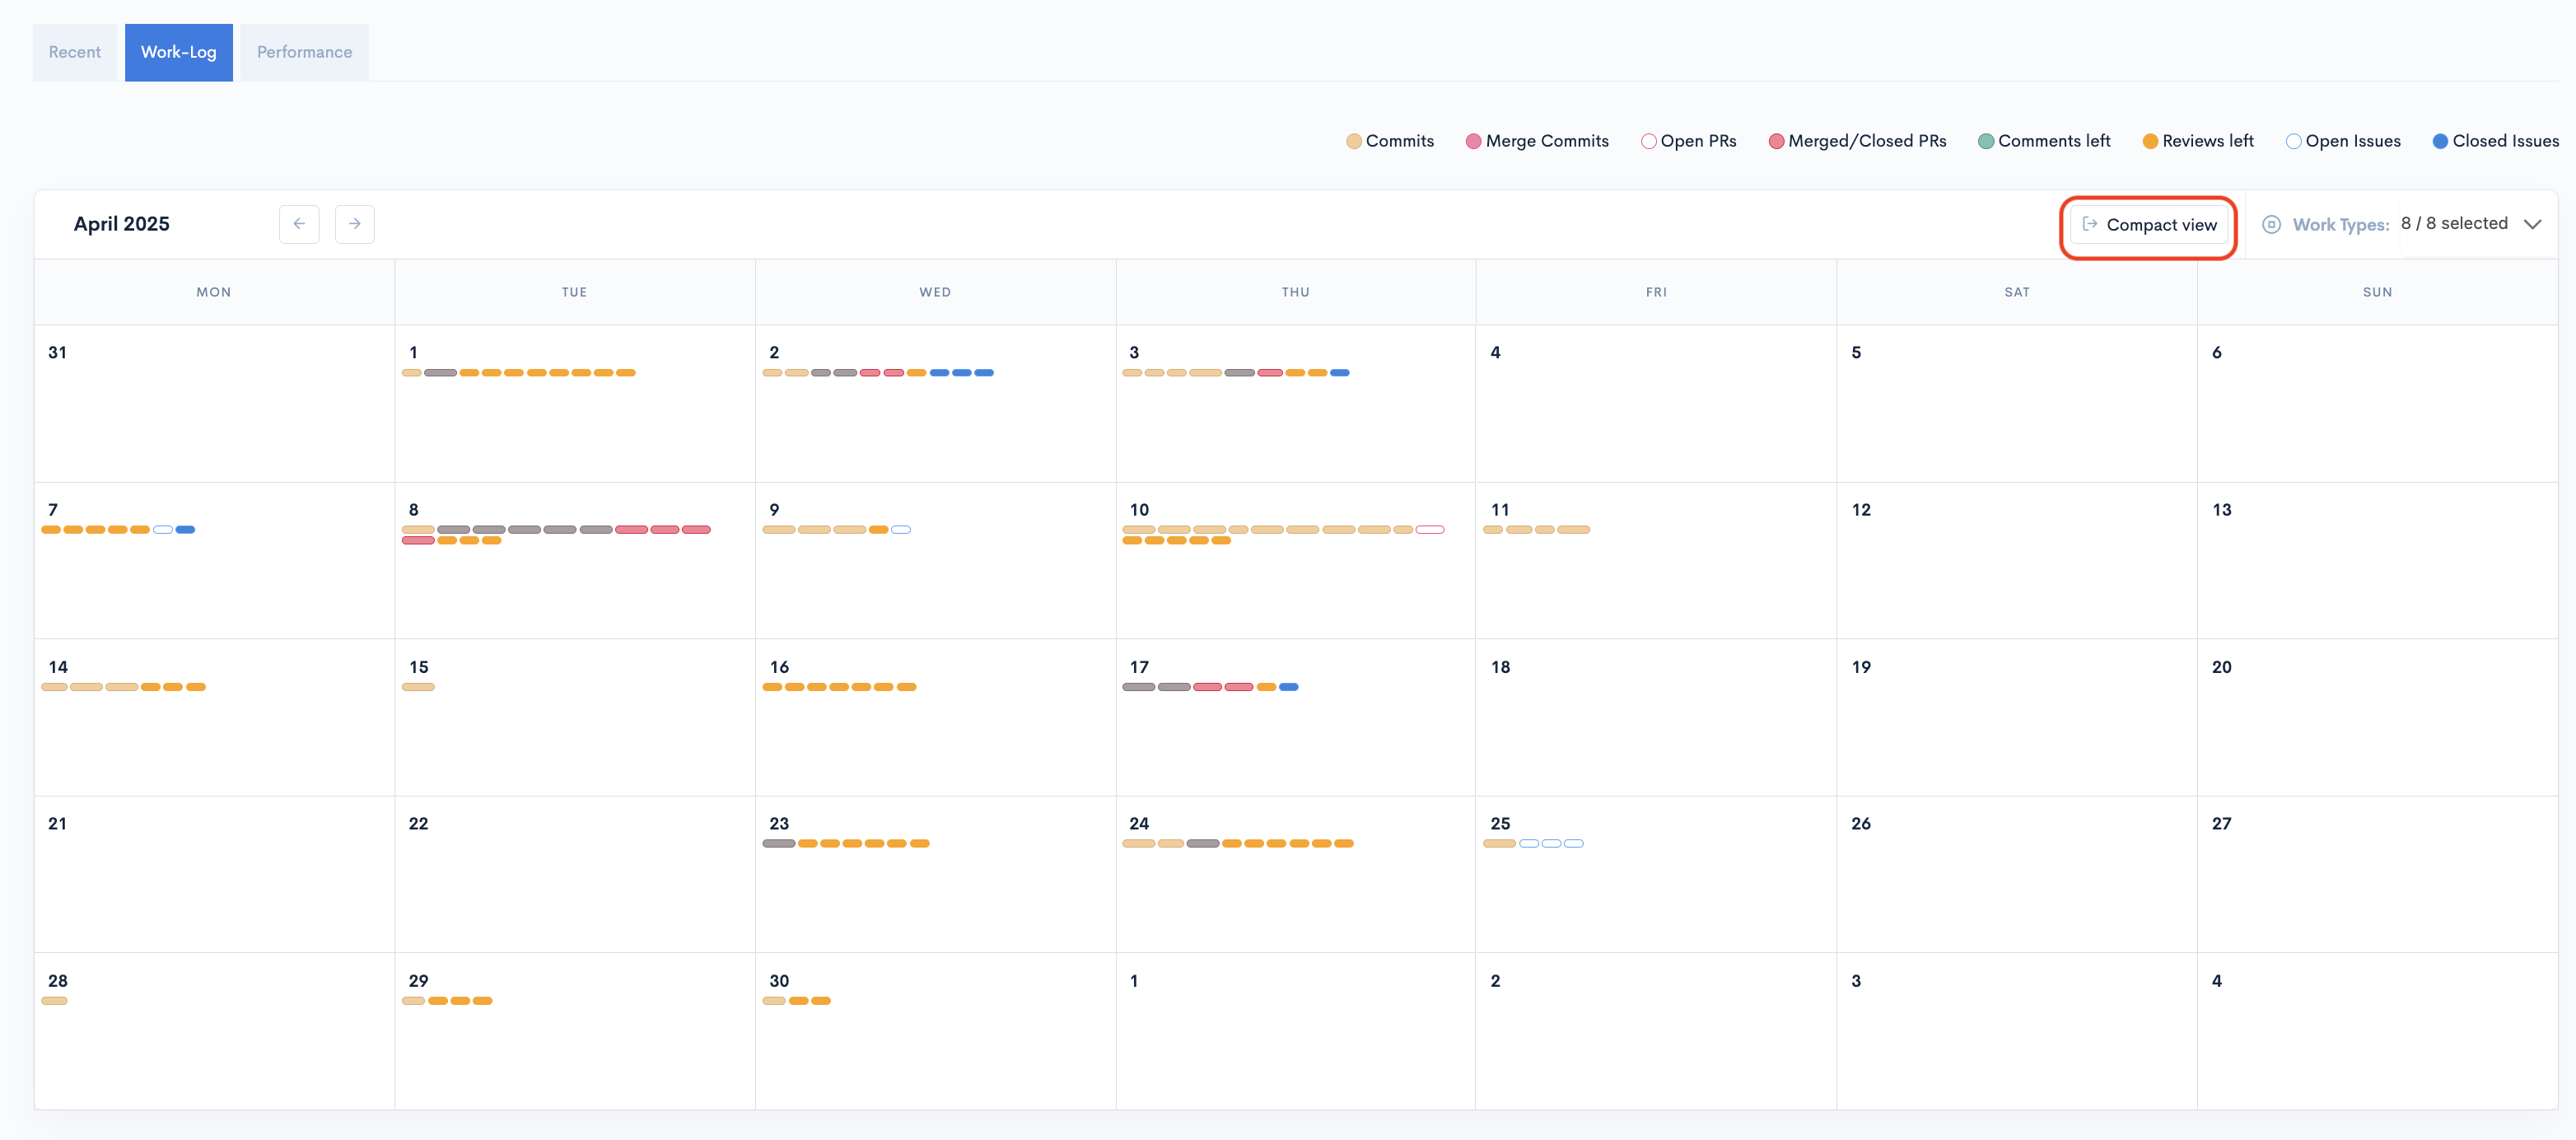
While in the Bubble view hovering above an item will show more details about that specific item.
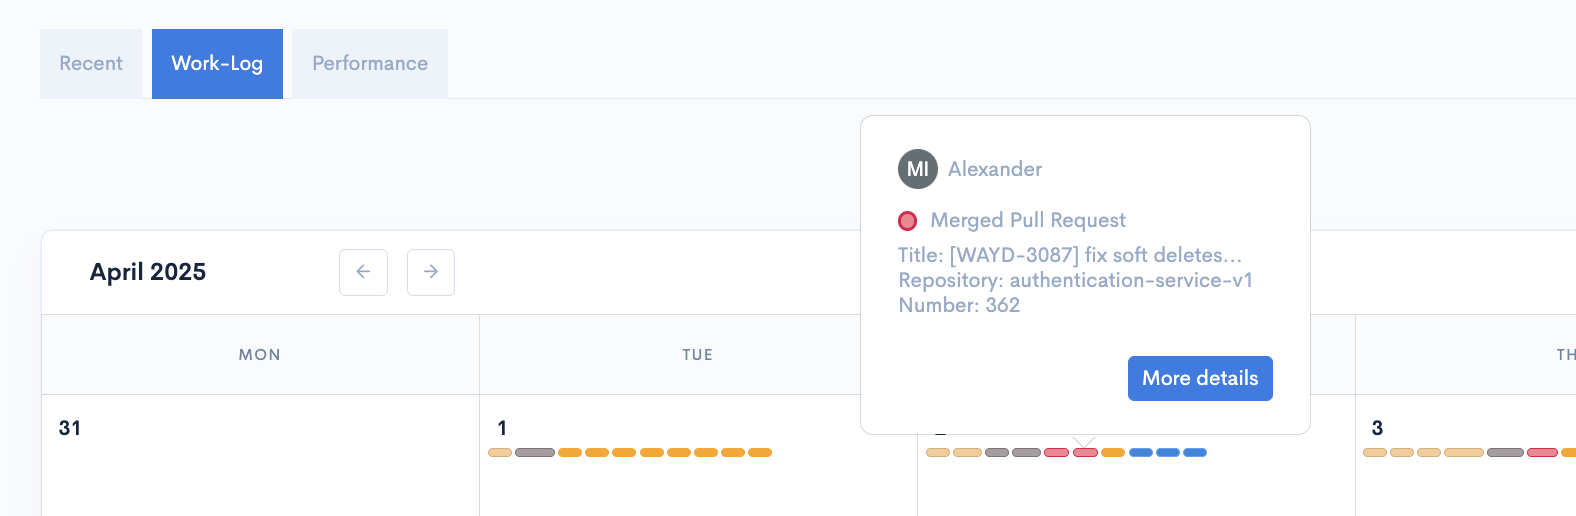
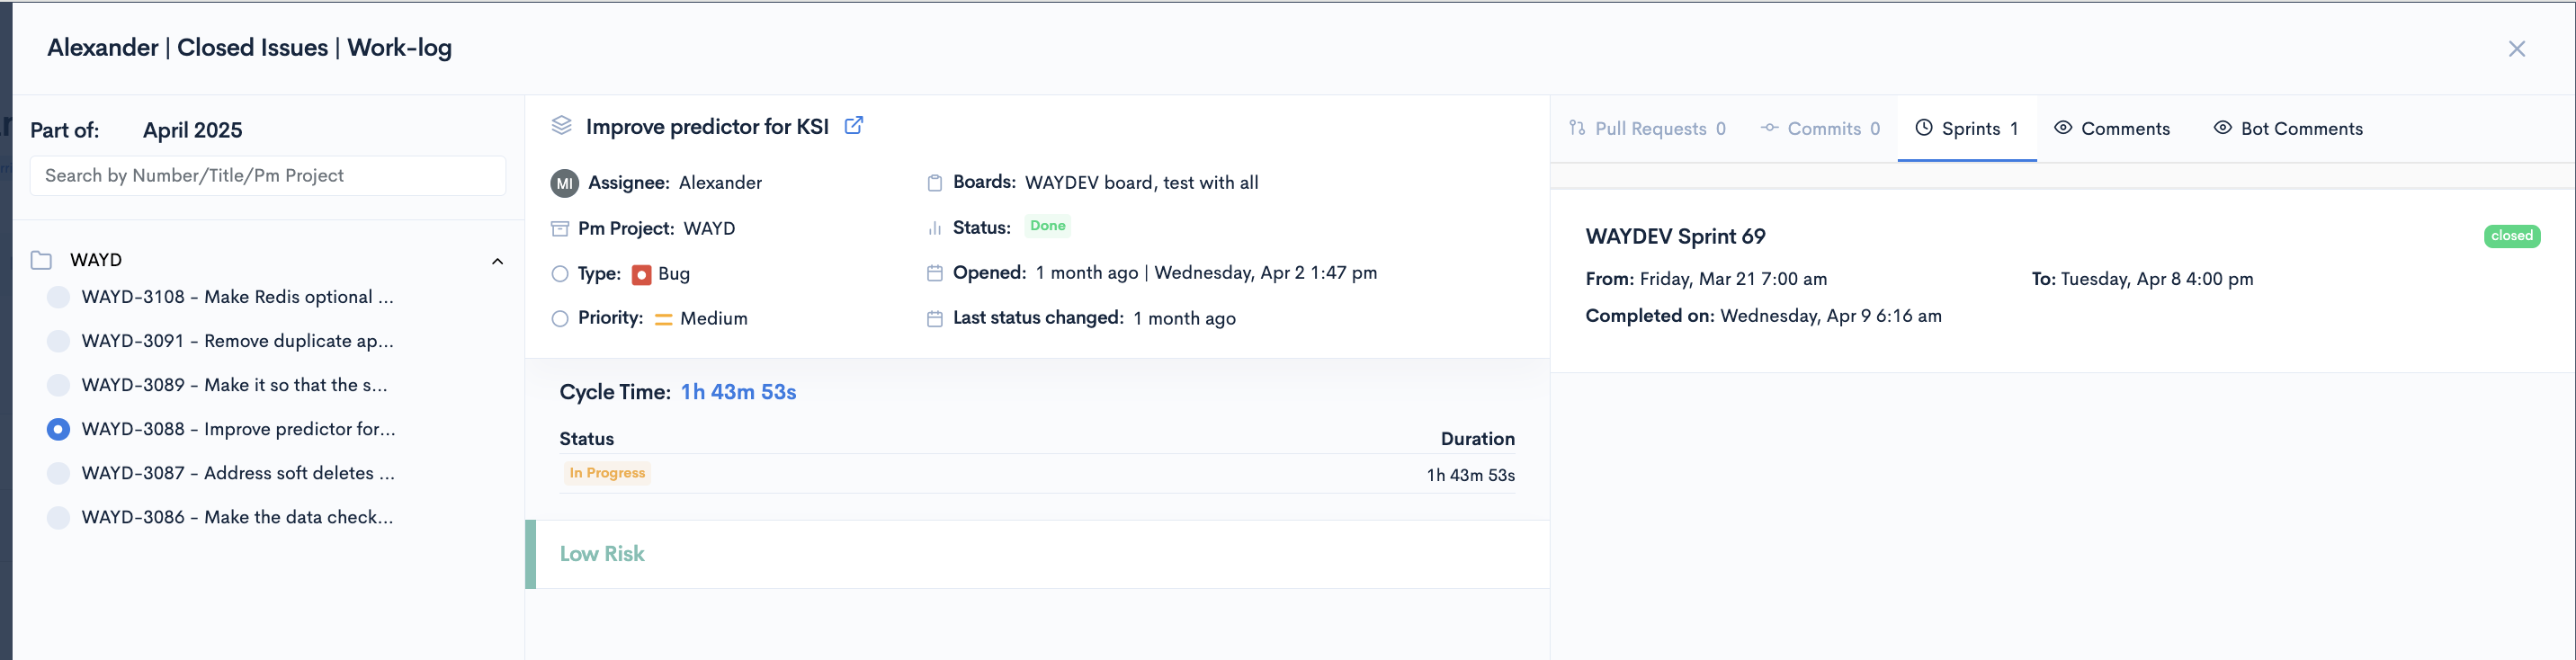
Clicking on an item will open a modal with more details about it.
If the Compact view is selected, hovering above the graph will show a breakdown of the activity for that day.
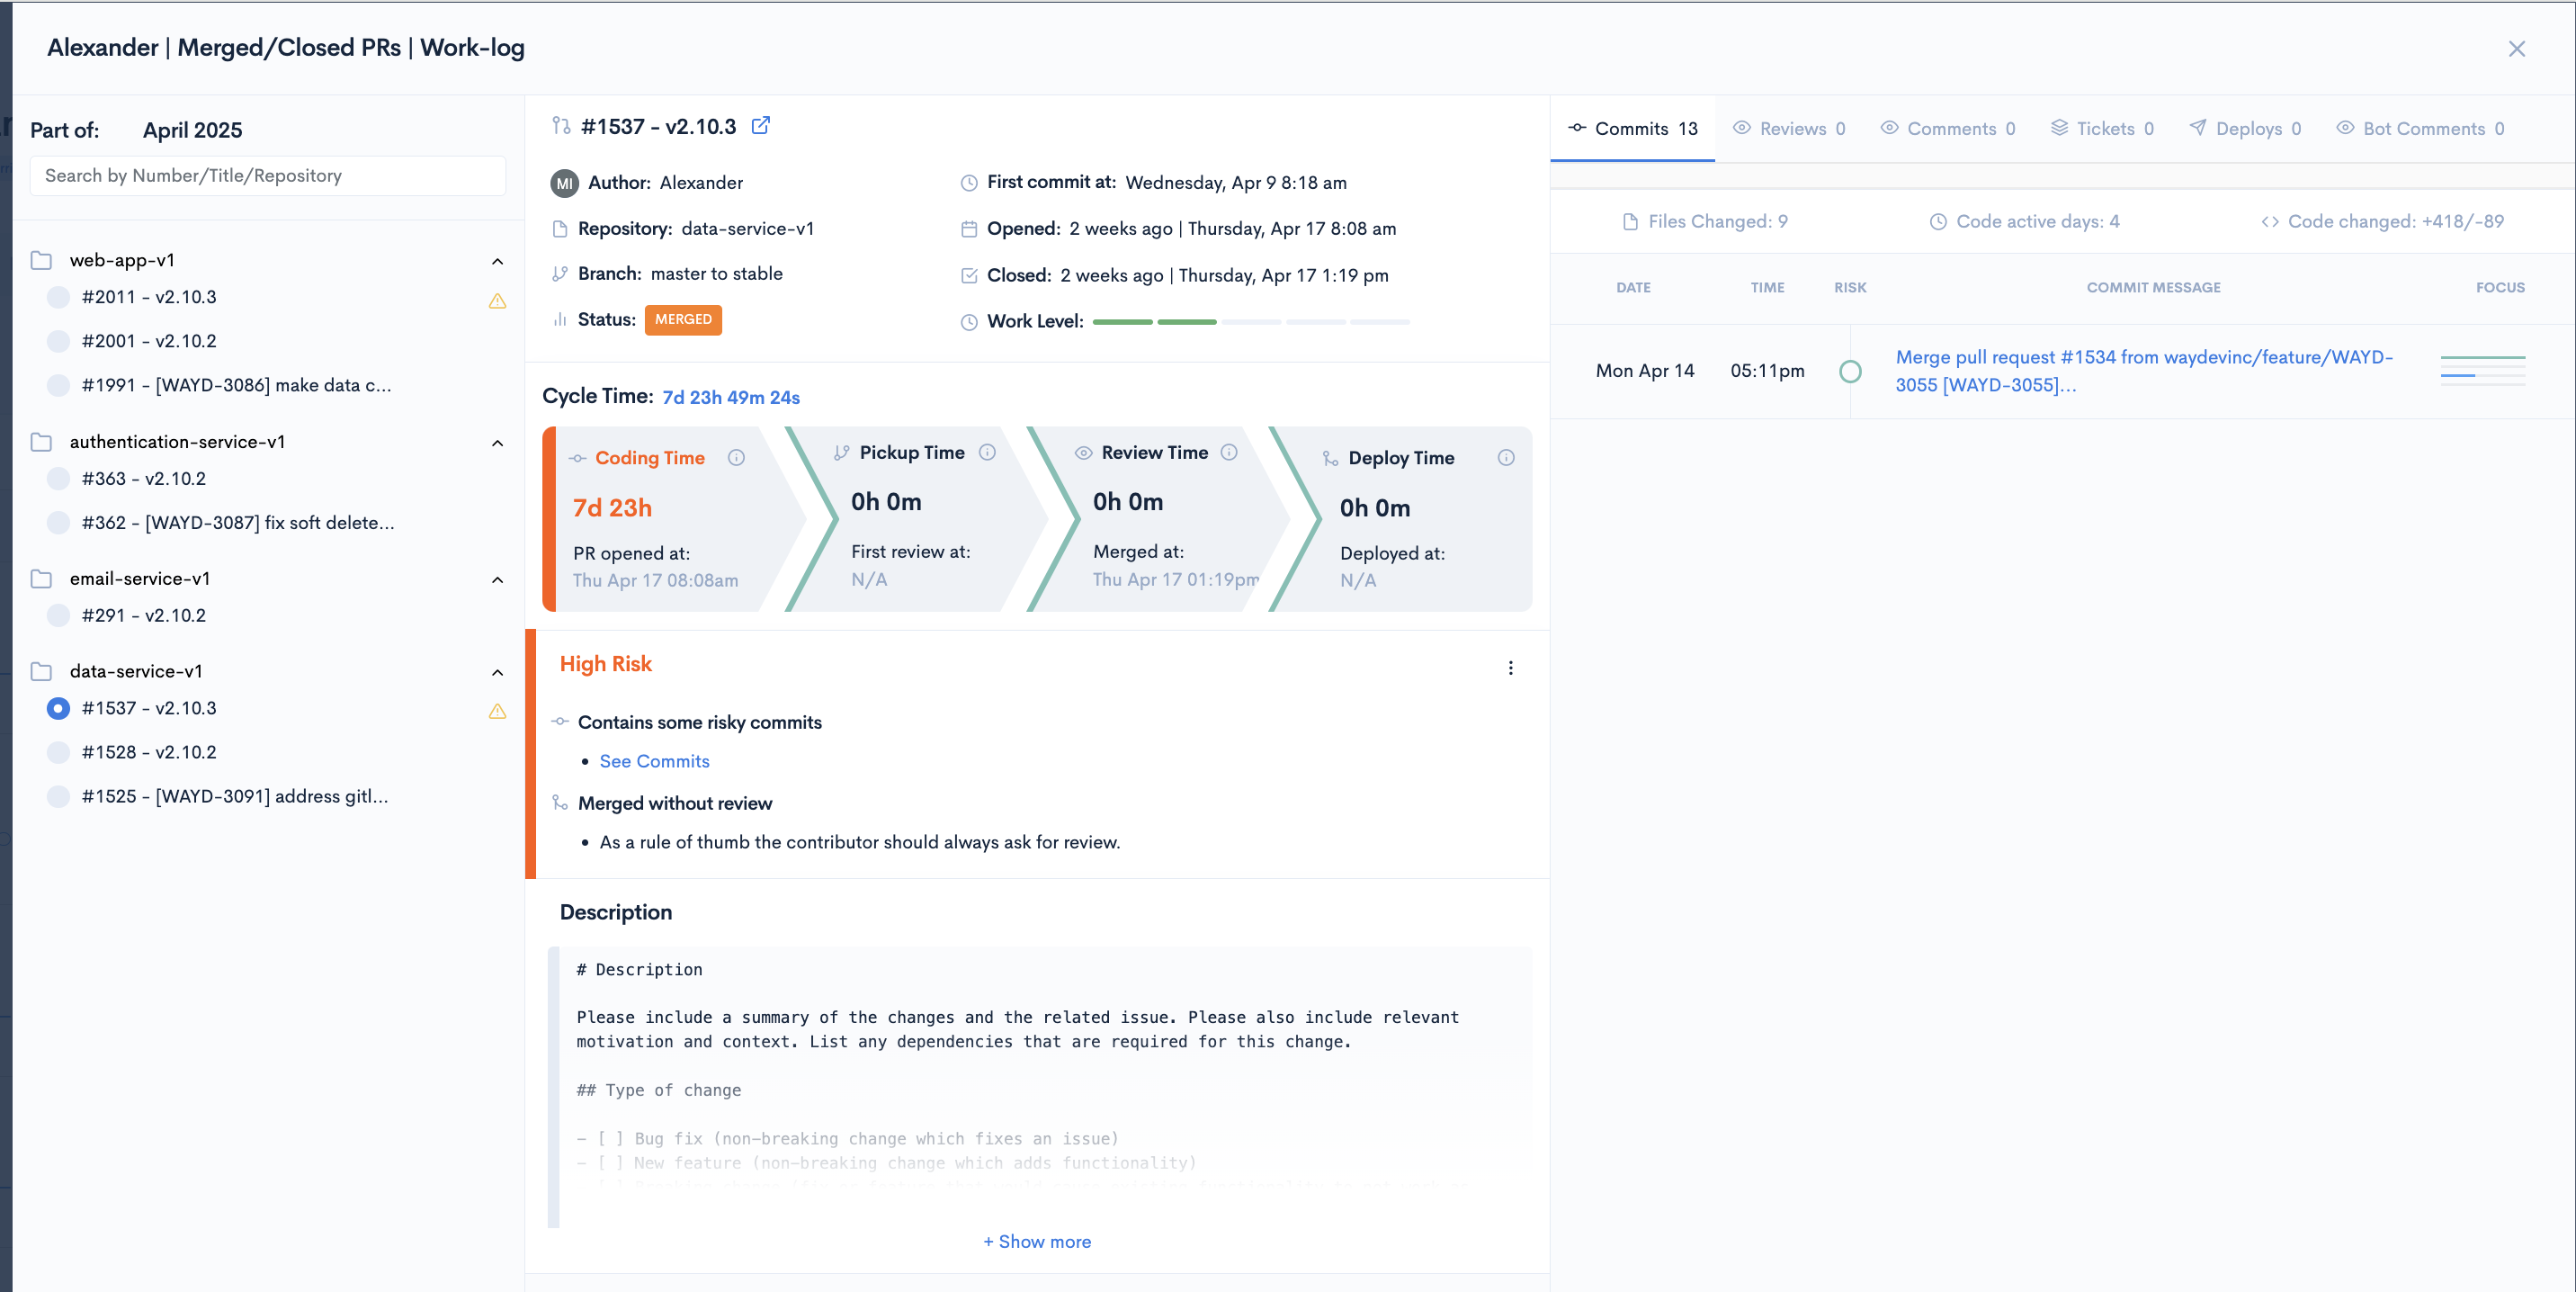
When you click on any symbol in the Work-Log, you can access detailed information about the work being done. The following information is available:
- The work focus
- The commit size
- The commit message
- The time of execution
- Pull Request reviews
- Pull Request comments
- The time to first comment
- The status of the pull request
- The commit timeline of the pull request
- The repository where the work was done
Performance
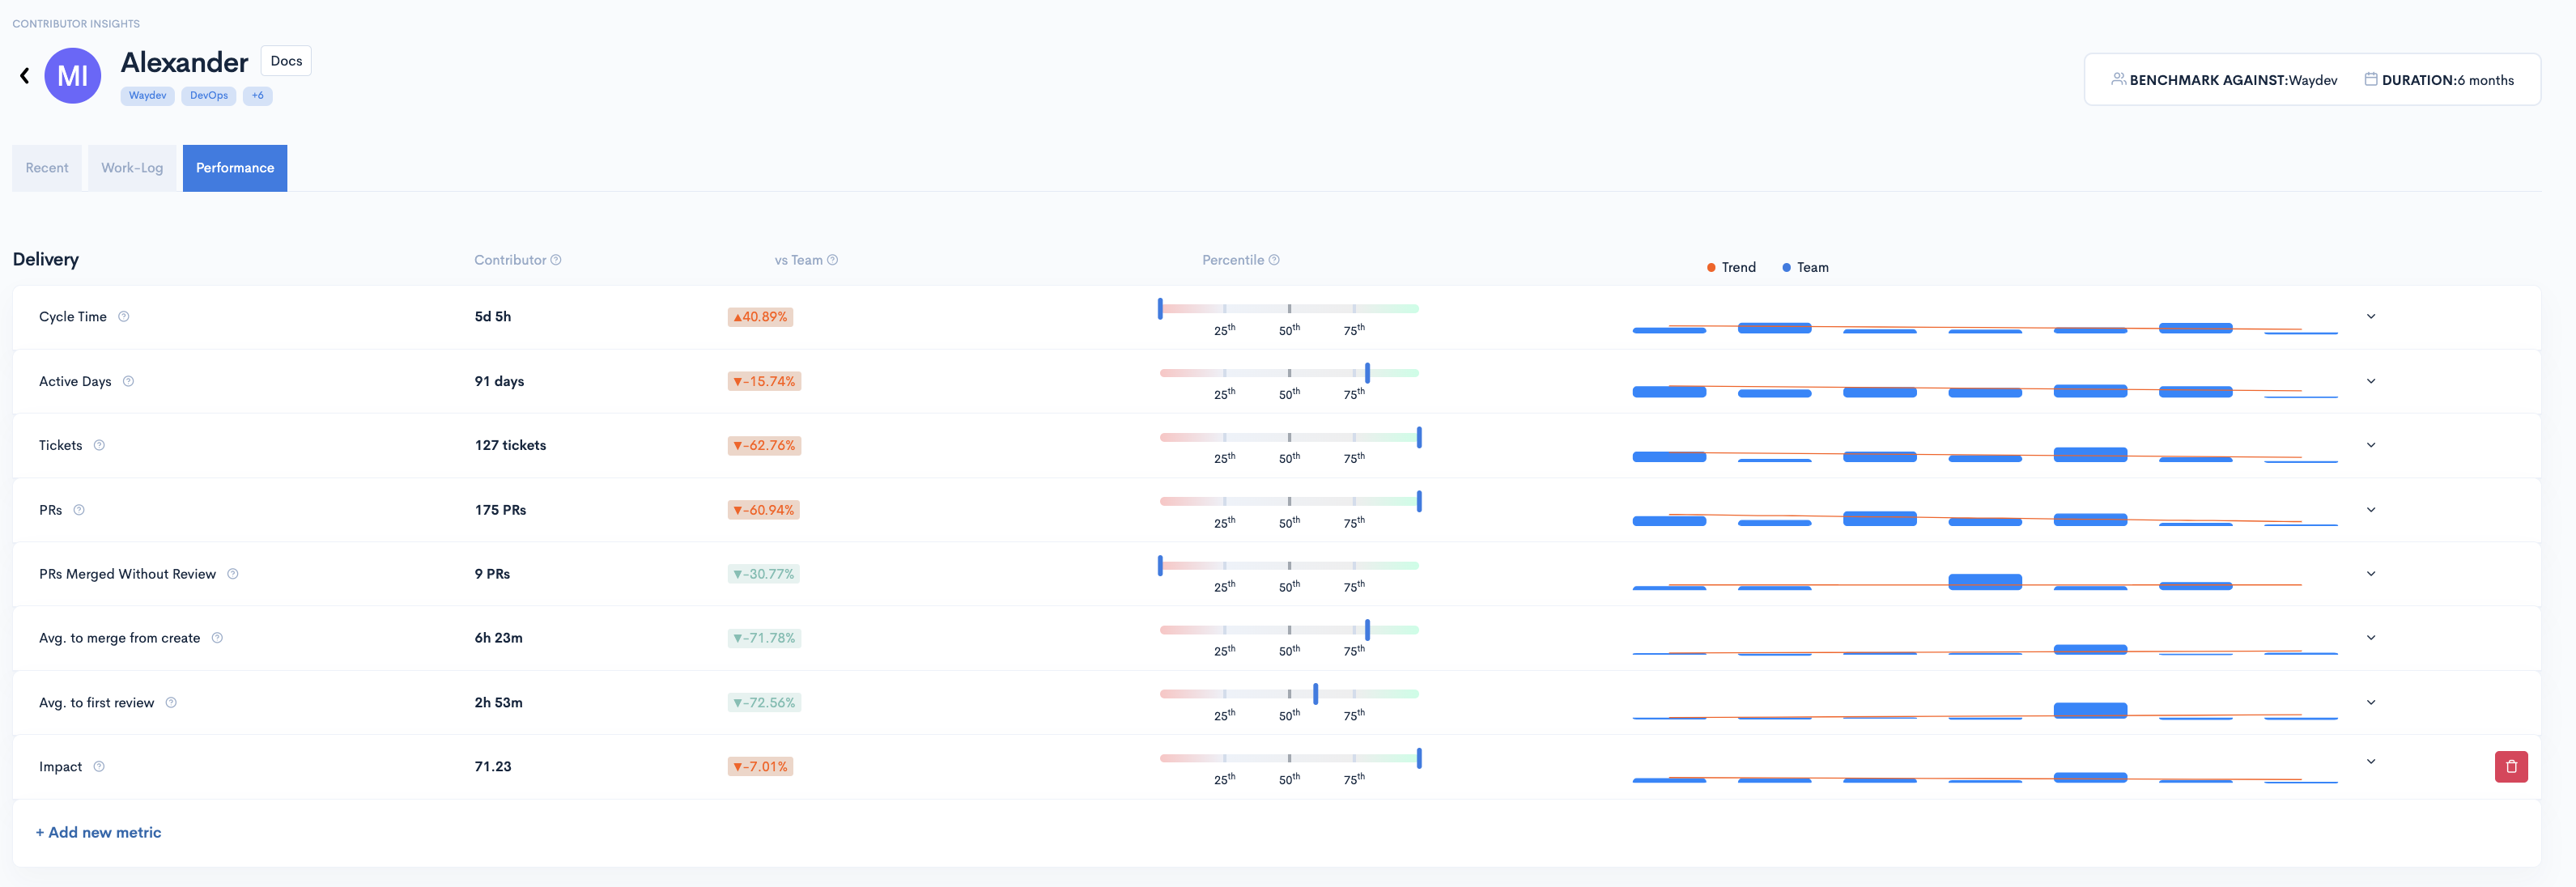
The performance tab includes an overview of the selected contributor's performance in a selected time frame compared to the average of a selected team.
The performance tab includes 2 categories of metrics: Delivery and Health.
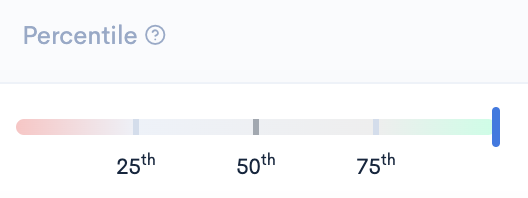
For each metric, you can see the value for the selected time frame, the evolution (%), the percentile bar, and an evolution graph.
The percentile barThis bar provides a perspective on the current contributor's relative performance against the selected team. All contributors from the selected team, including the selected one, are taken into account for comparison (e.g. if the current contributor falls under the first line, this signifies that their performance is within the bottom 25% of all contributors.)
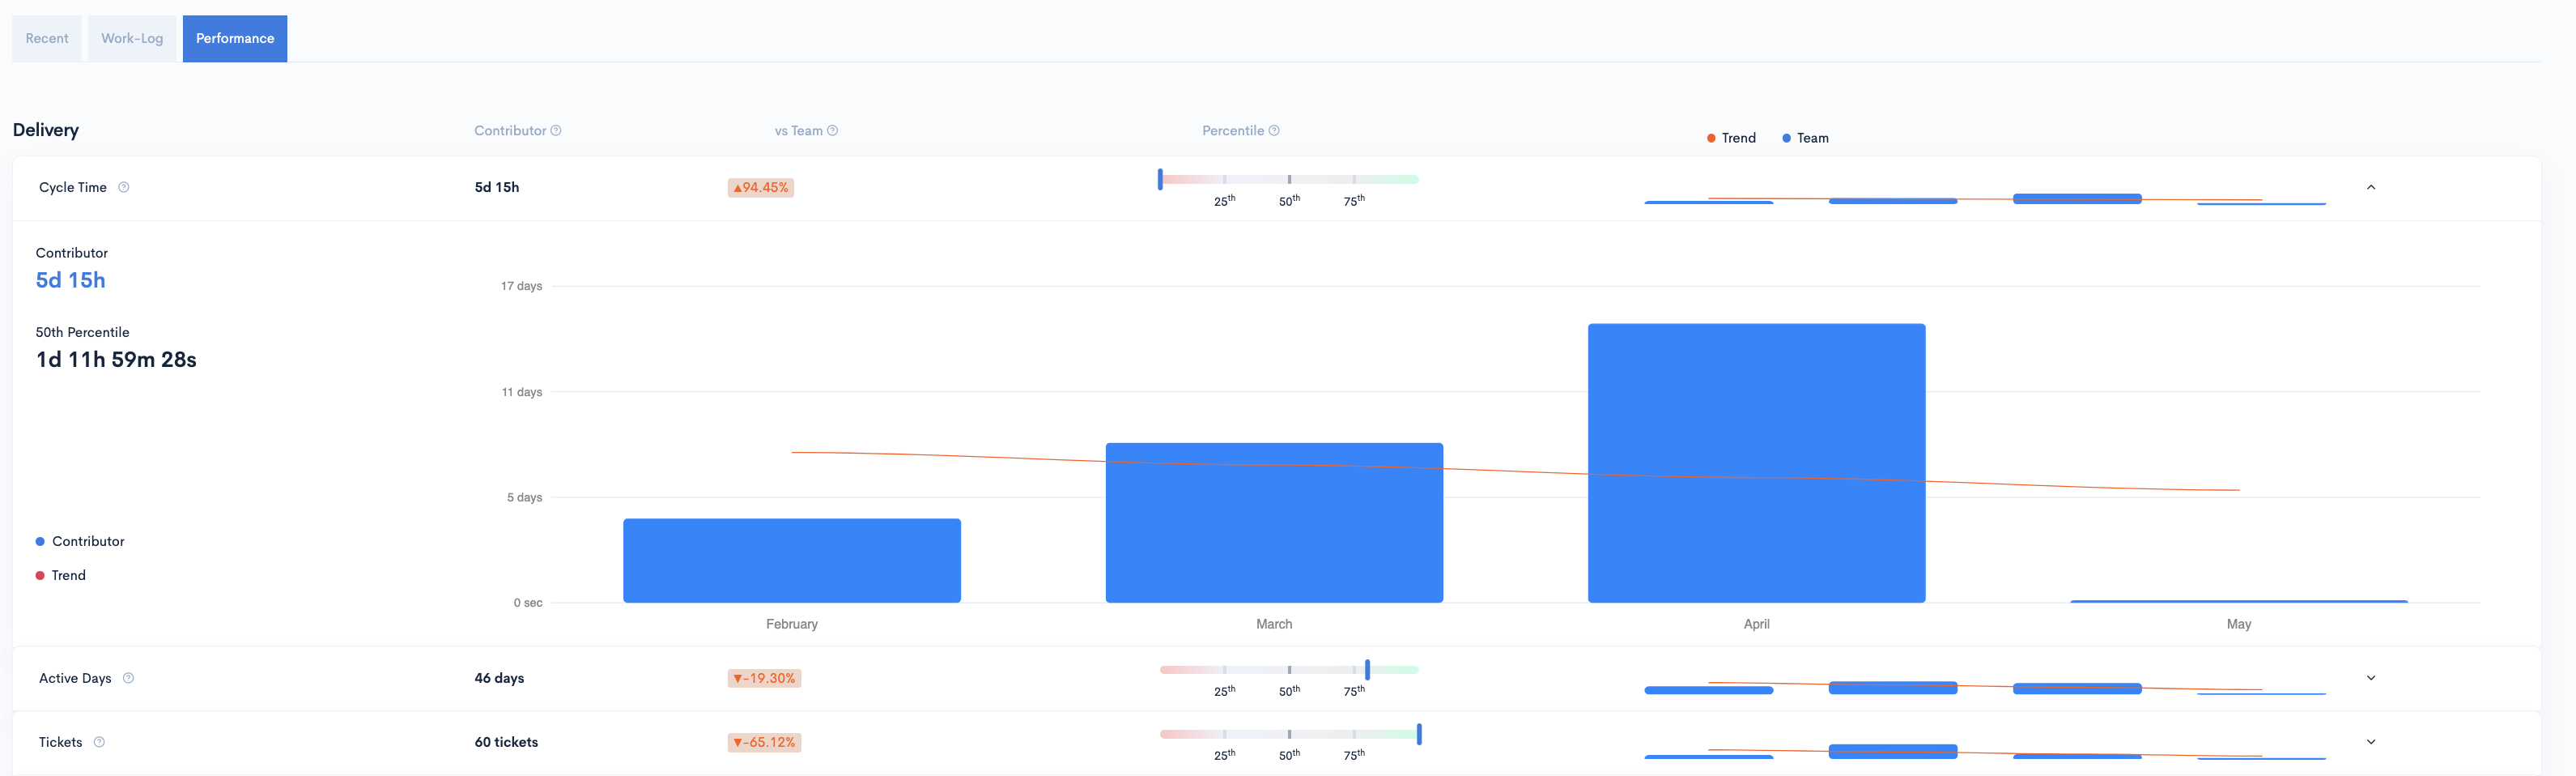
Clicking on any metric in the "Performance" section will display a historical graph for that specific metric.
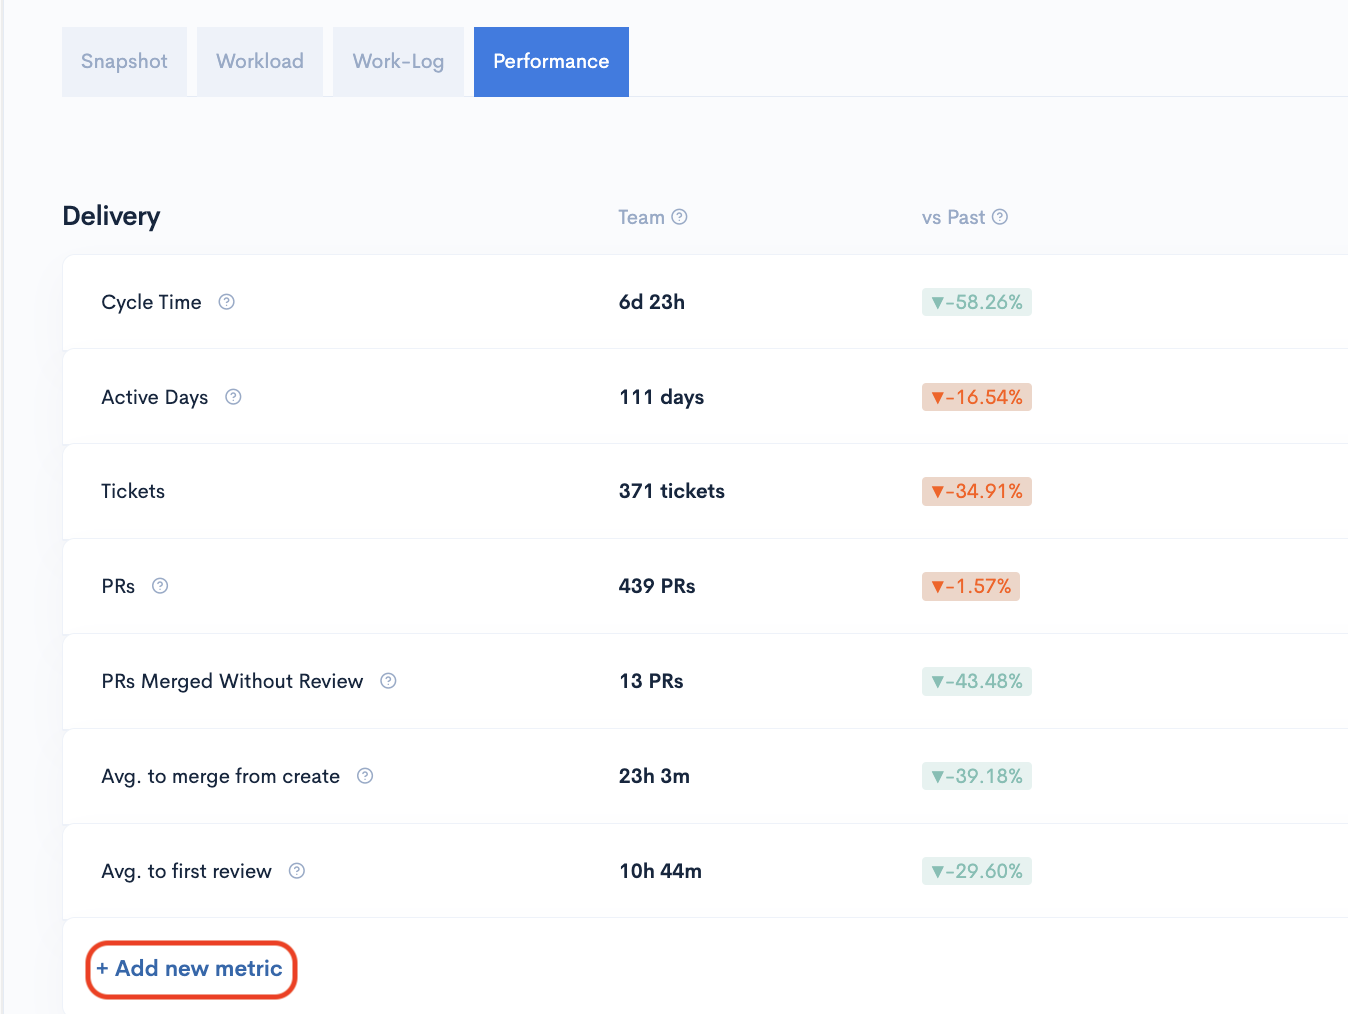
Delivery
Cycle time - the elapsed time from the first commit made to the production release.
Active Days - Active days metric represents the number of days a contributor was active, tracking code commited and pull request activity.
Tickets - total number of tickets
PRs - total PRs for the time frame selected
PRs Merged Without Review - the number of pull requests that were merged into the codebase without undergoing a standard review process.
Average to merge from create - Measures the average time it takes for a pull request (PR) to be merged from the moment it is created.
Average to first review - The average time it takes for the first review to be made on a Pull Request.
Health
KSI - The Sharing Index is a metric designed to assess how well your team collaborates on code reviews. It quantifies the distribution of reviews across your team members and considers factors that promote fair and active participation.
Traceability - Indicates the percentage of commits that are linked to at least one ticket.
PR Failure Rate - Indicates the percentage of Pull Requests declined or closed to total Pull Requests, excluding Pull Requests in progress.
Unreviewed PRs - Tracks the number of pull requests that have been submitted but not yet reviewed.
Unplanned Tickets - the number of unplanned tickets .
High Risk Commits - *Risk is a measure of how likely a commit is to cause problems. It is calculated based on the size of the commit, how the changes are spread across the code base and how serious the changes are.
Churn - Code that has been rewritten or deleted in the first 21 days (this value is adjustable on the Settings page).
Updated 10 months ago