
Setup Custom Metrics
Custom Metrics enable engineering leaders to tailor their metrics according to their unique needs. With Custom Metrics, you can now leverage your own variables and formulas to track a wider range of data points beyond what Waydev's default metrics offer.
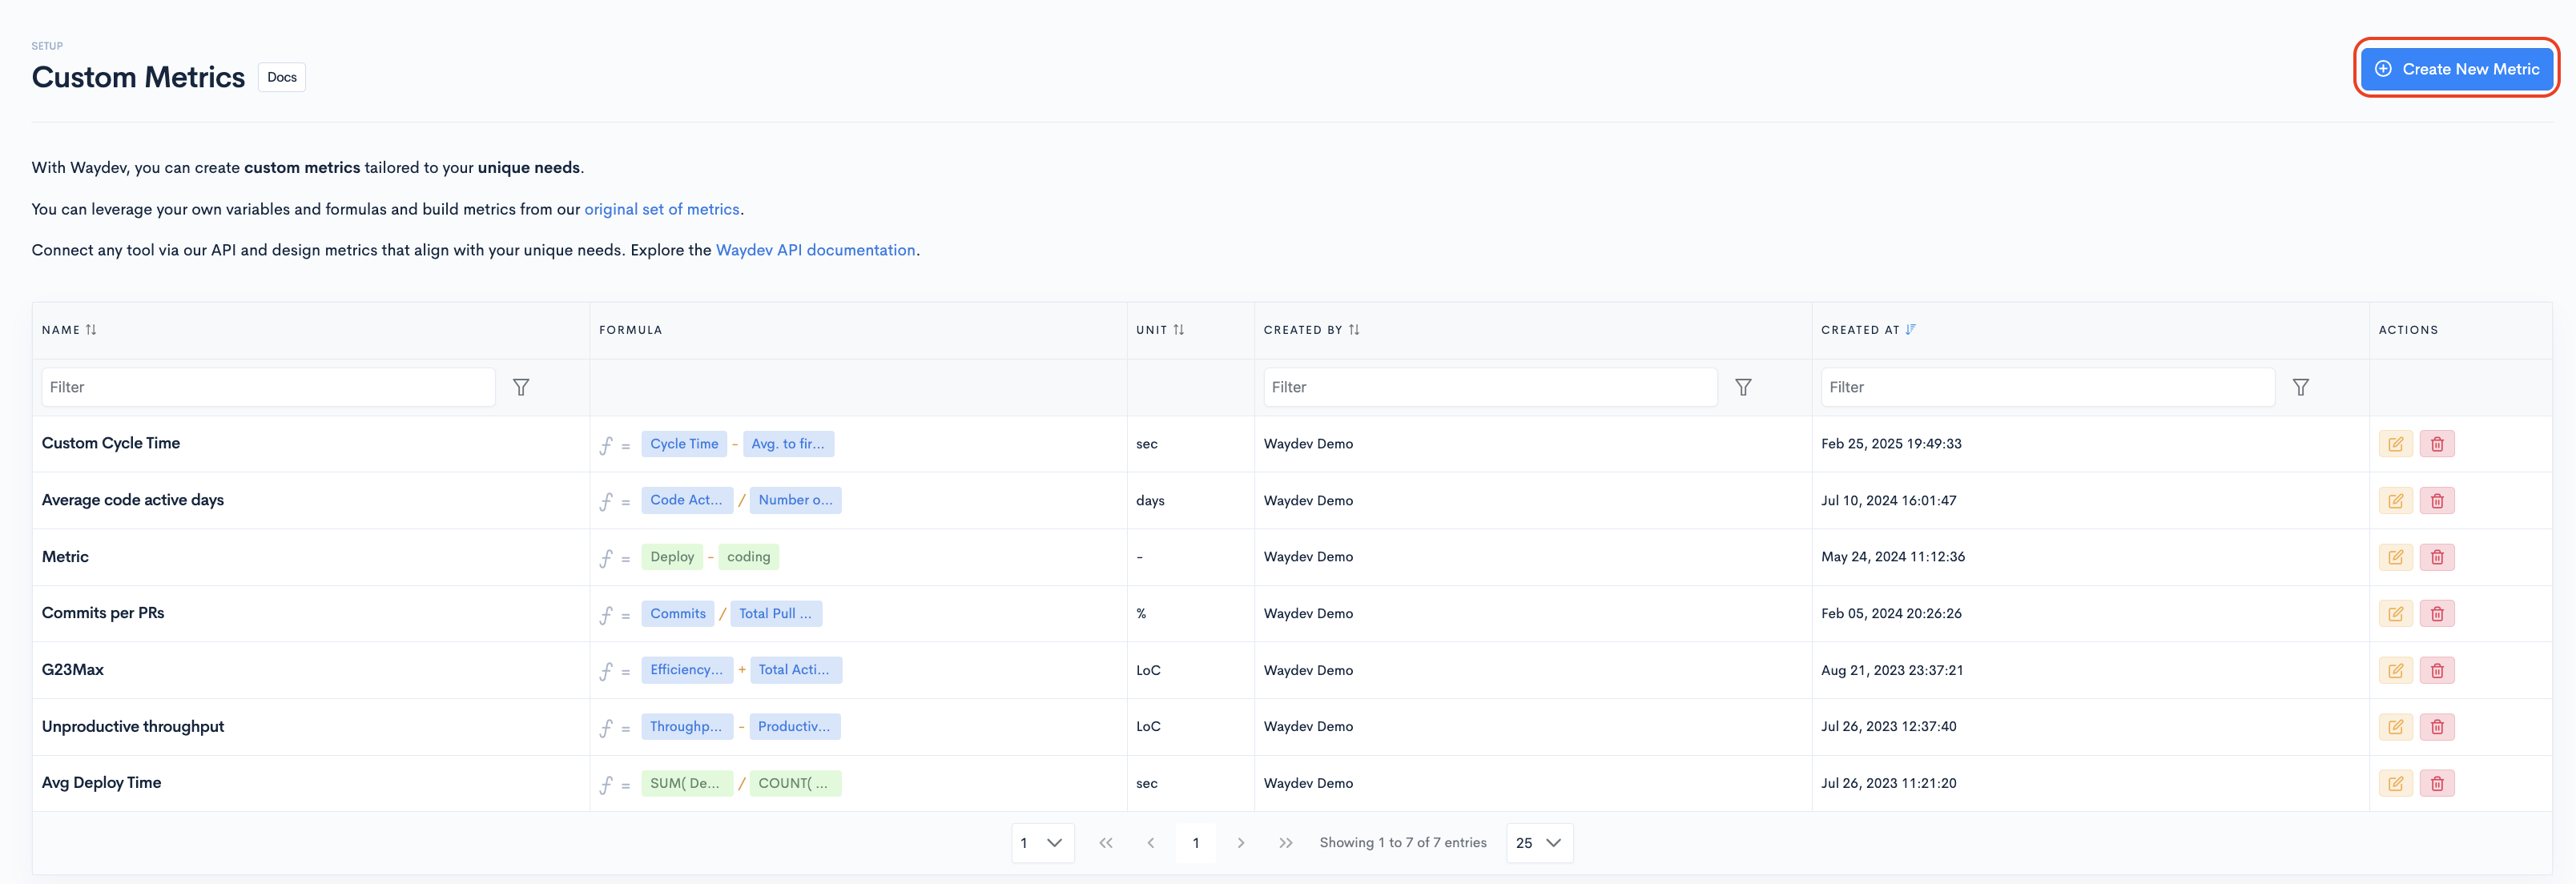
To create custom metrics, navigate to Custom Metrics in the Studio section.

To create a new custom metric, click the Create New Metric button.
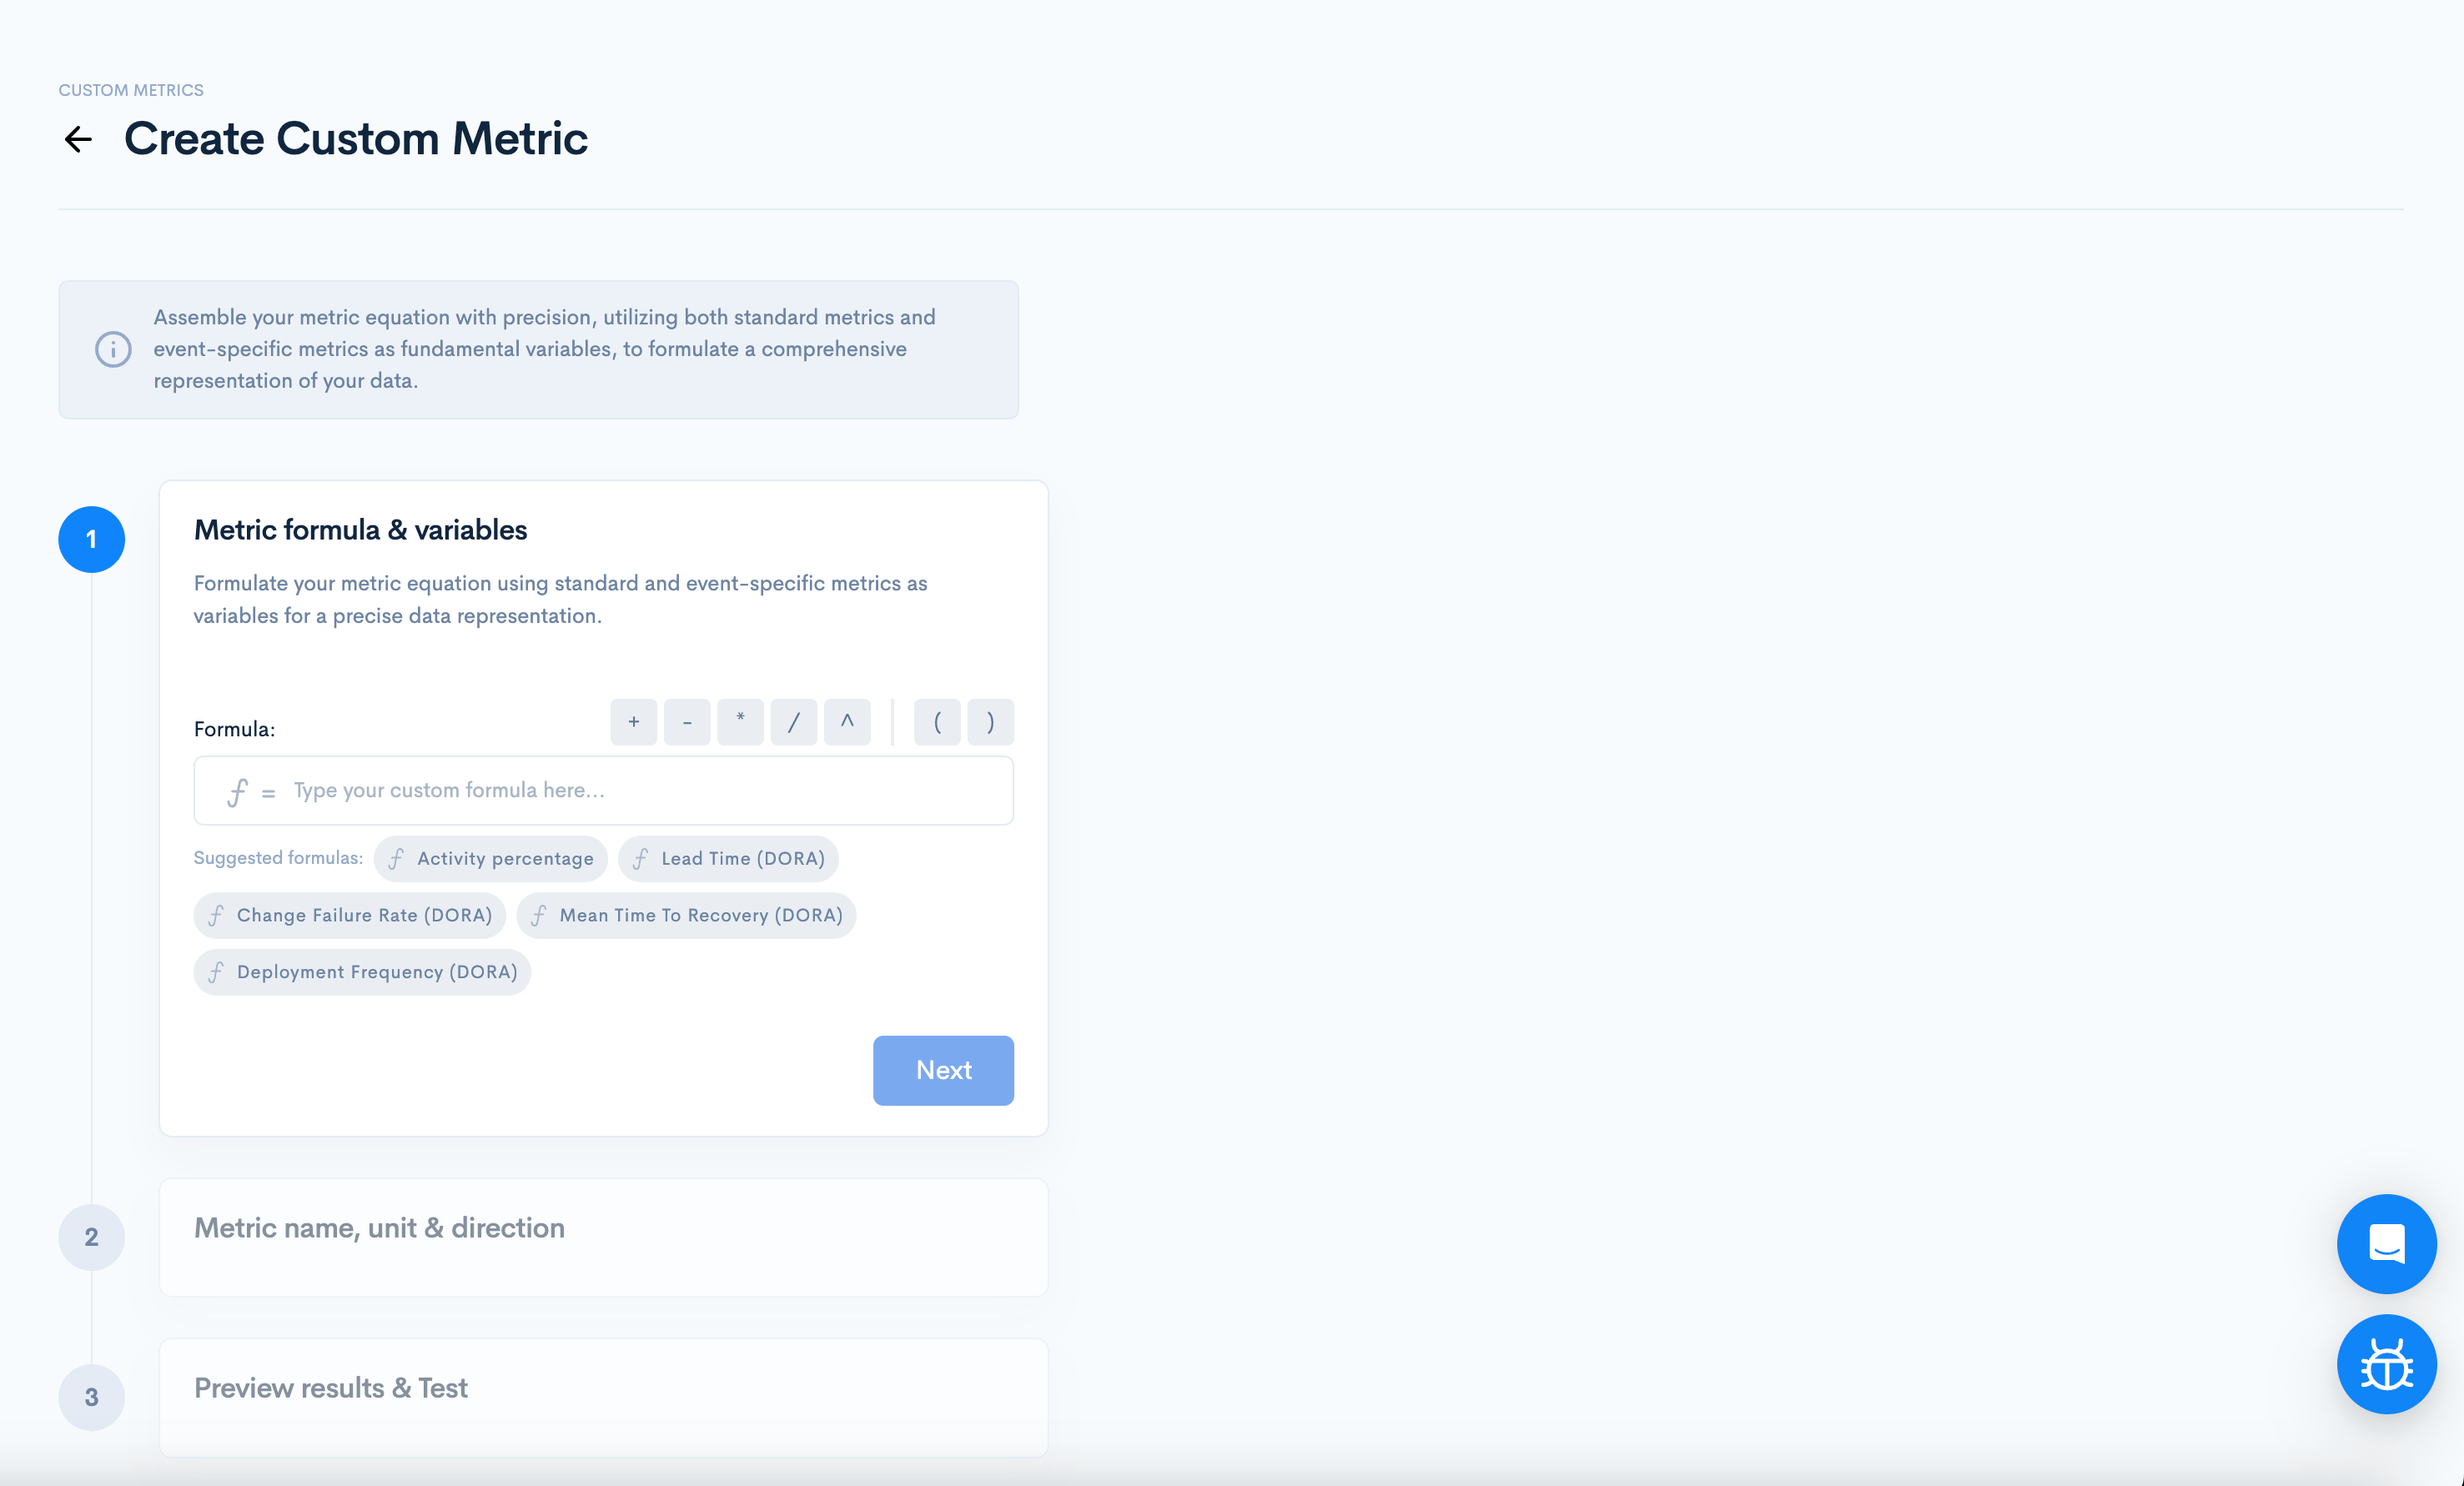
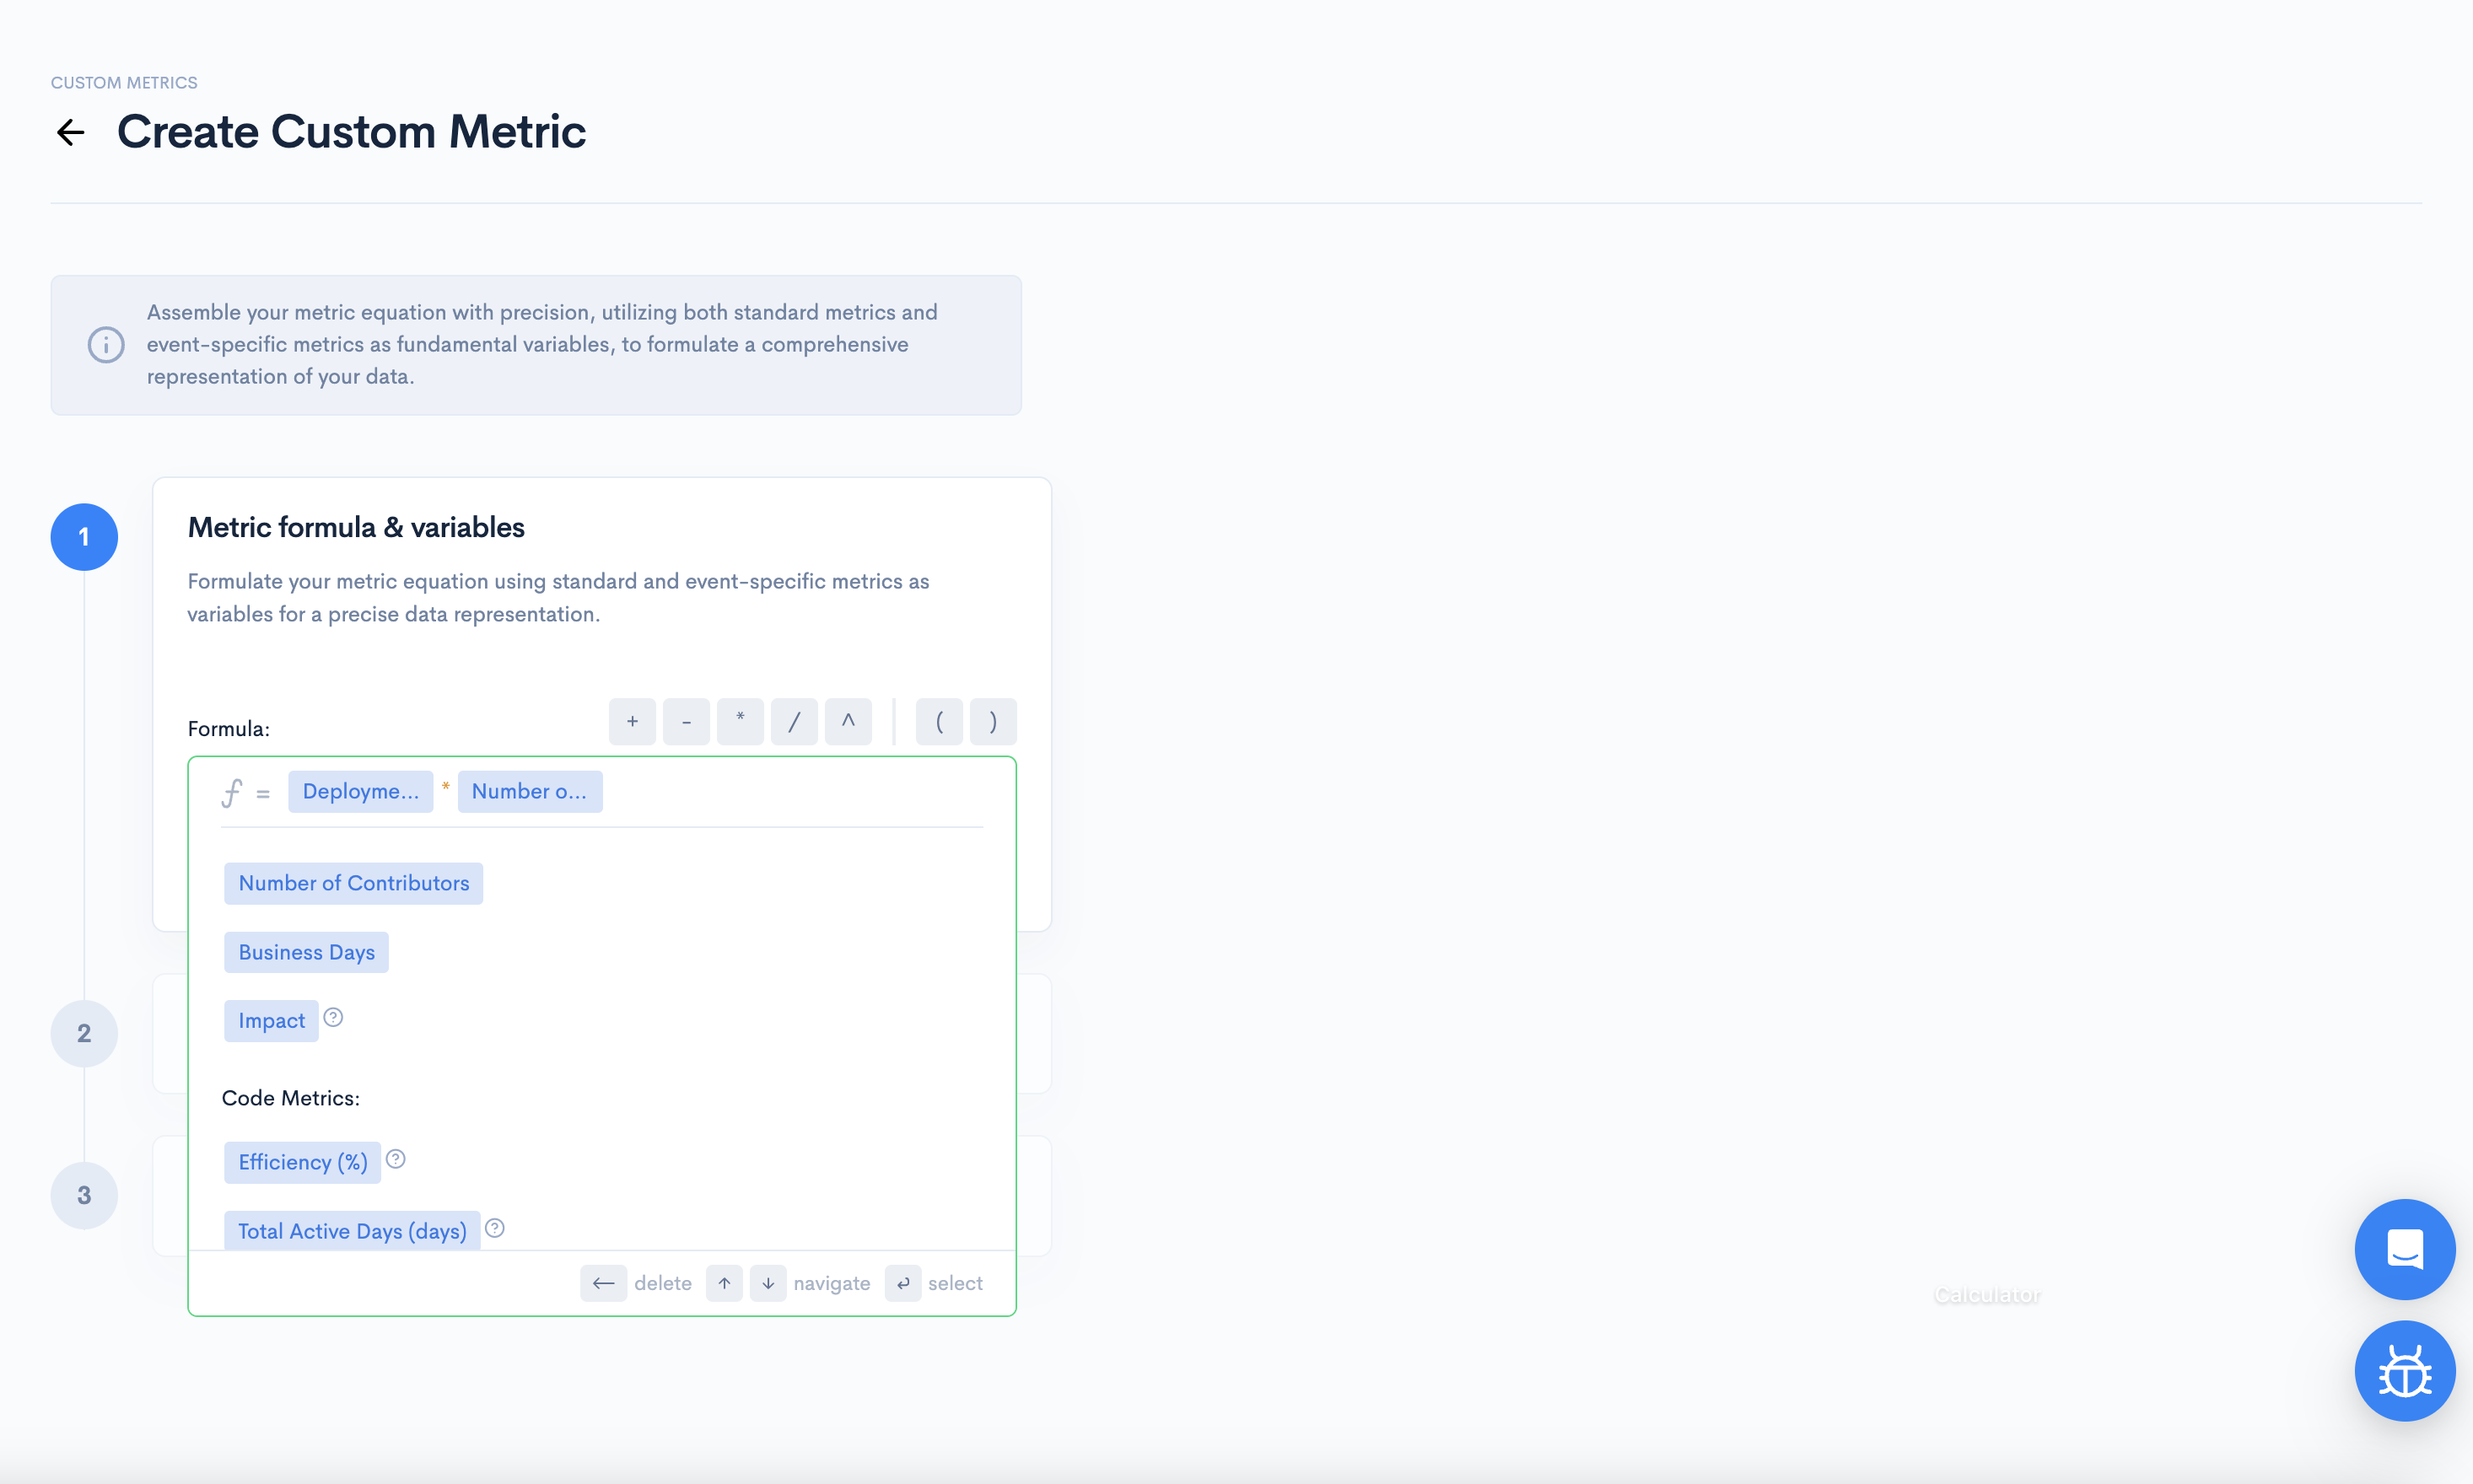
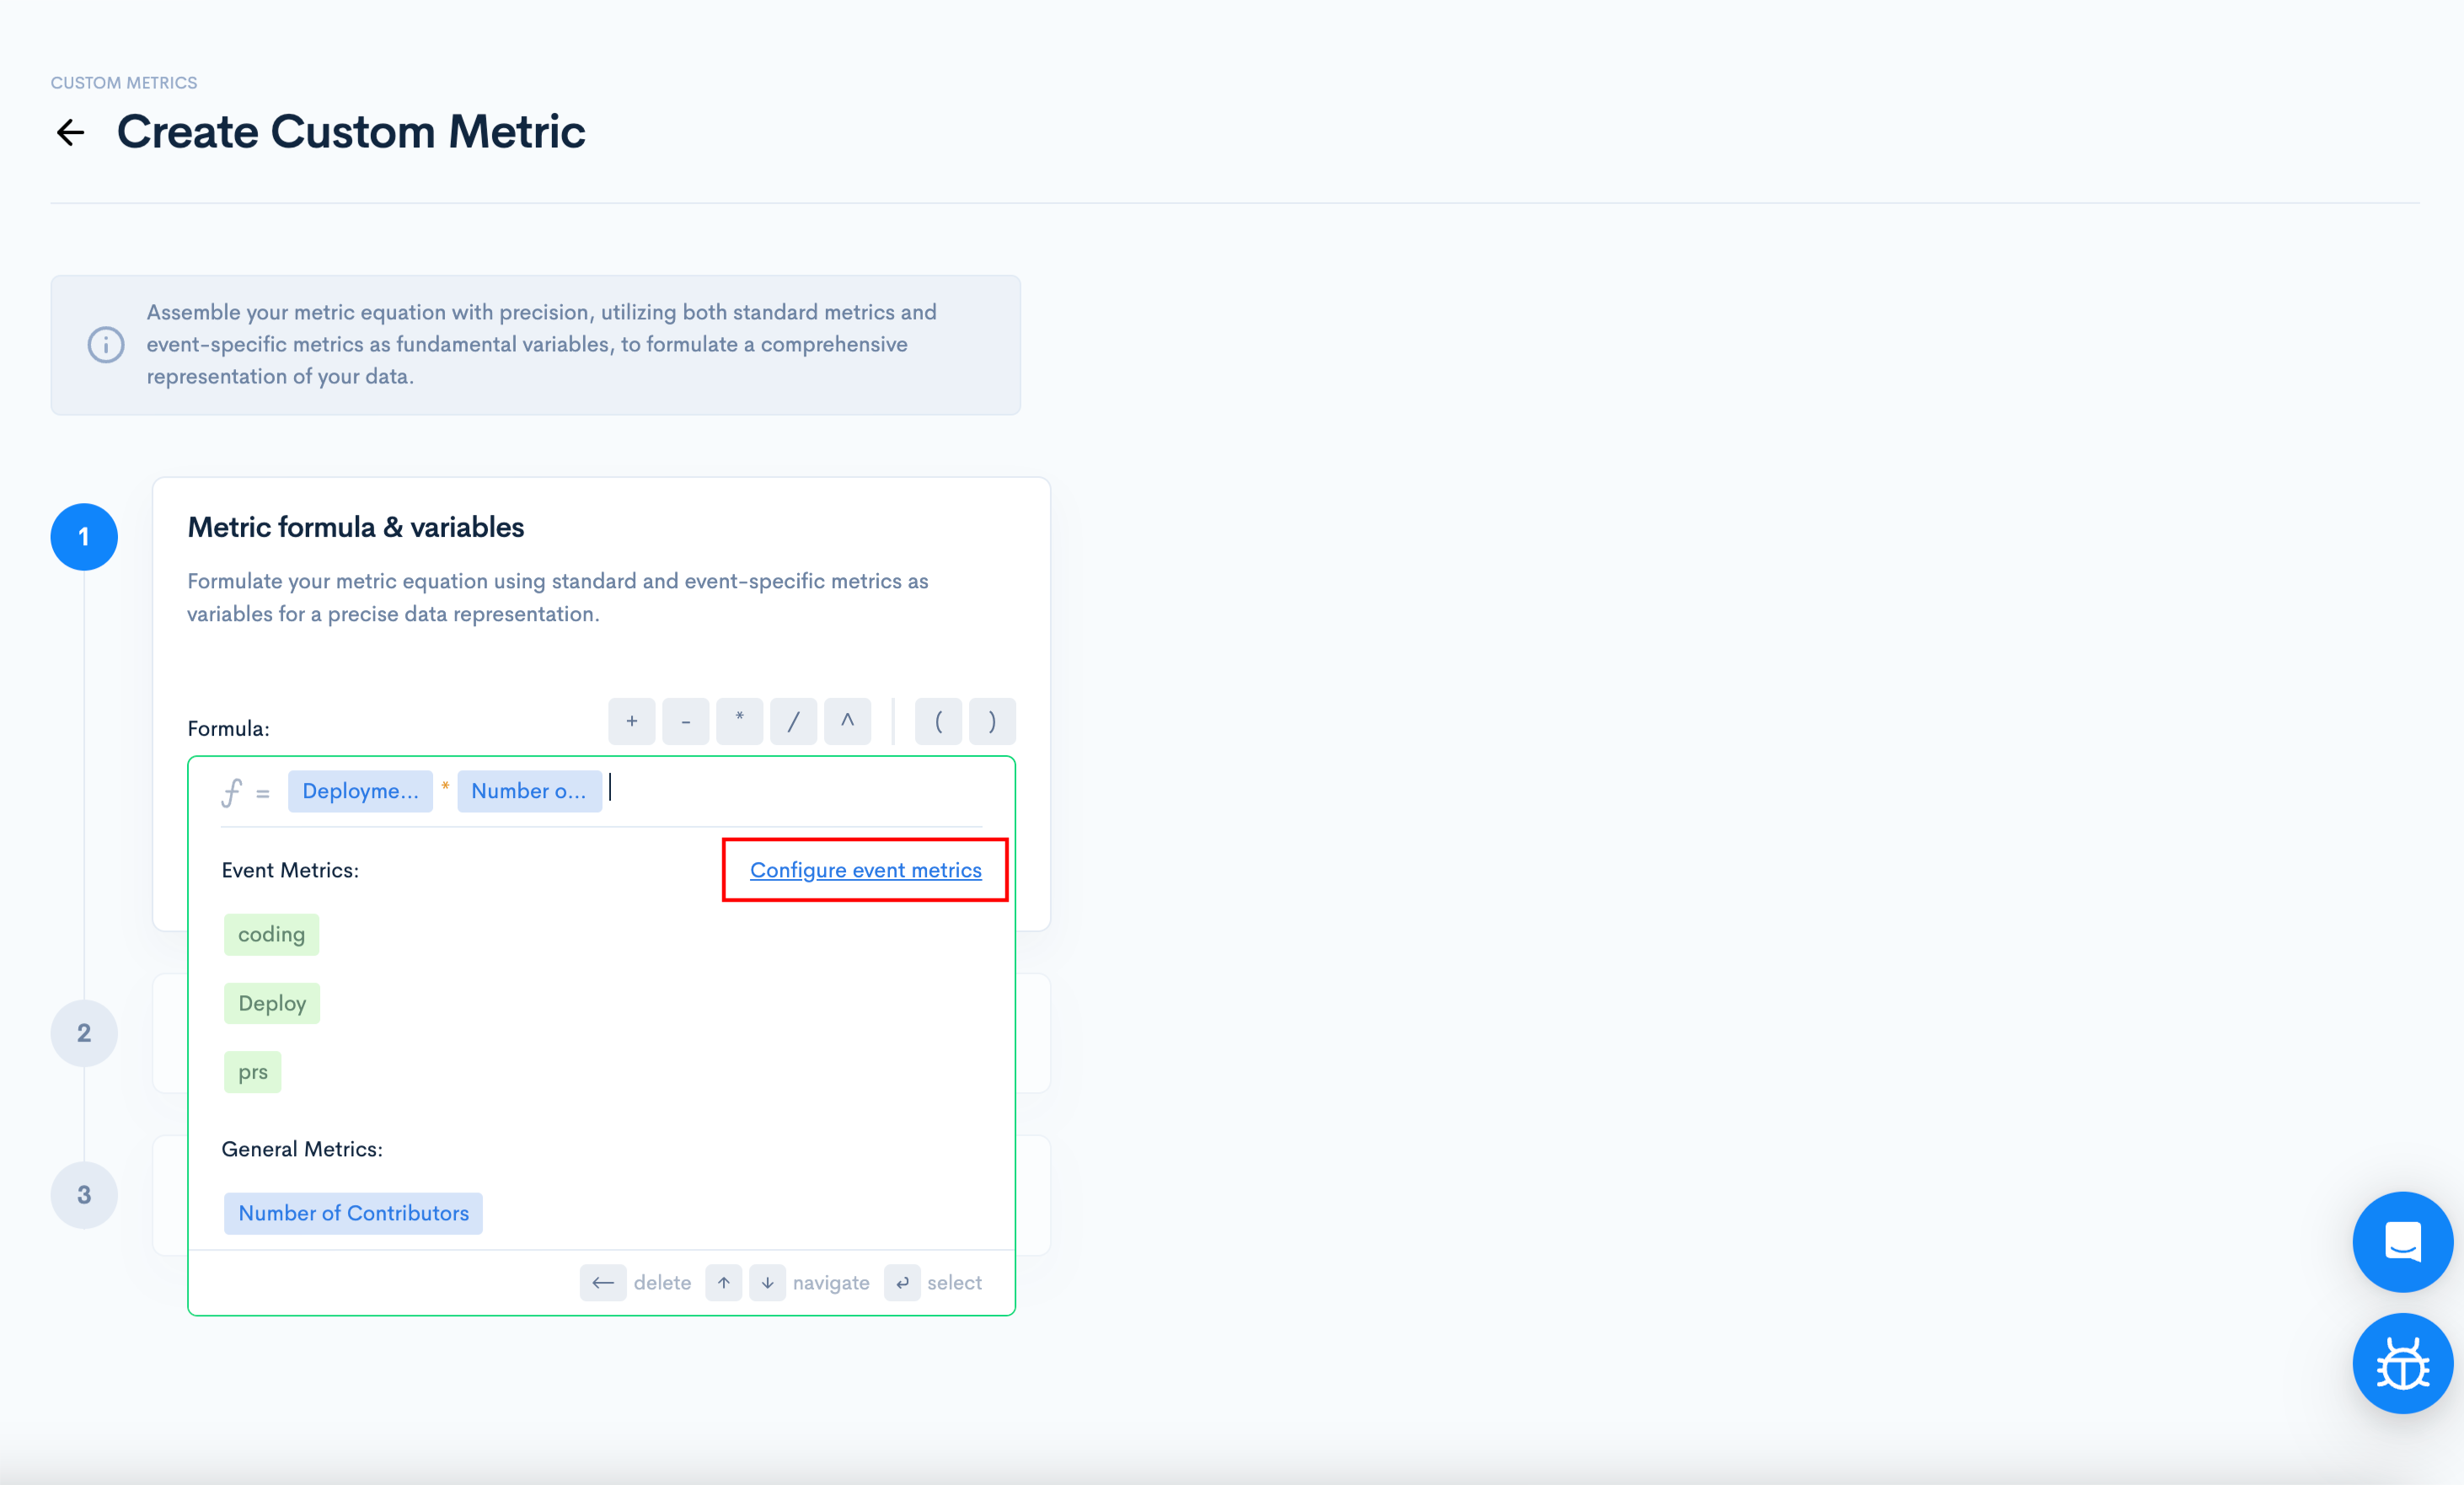
The first step in creating a custom metric is creating the formula. You can create your metric equation using standard and event-specific metrics as variables for a precise data representation.
You can use the following operations in your formula:
- "+" plus
- "-" minus
- "*" multiply
- "/" divide
- "^" raise
You can only select up to 7 variables in defining your custom metric.
After creating your formula, click Next
Now, name your metric and give it a unit and a direction for the expected value.
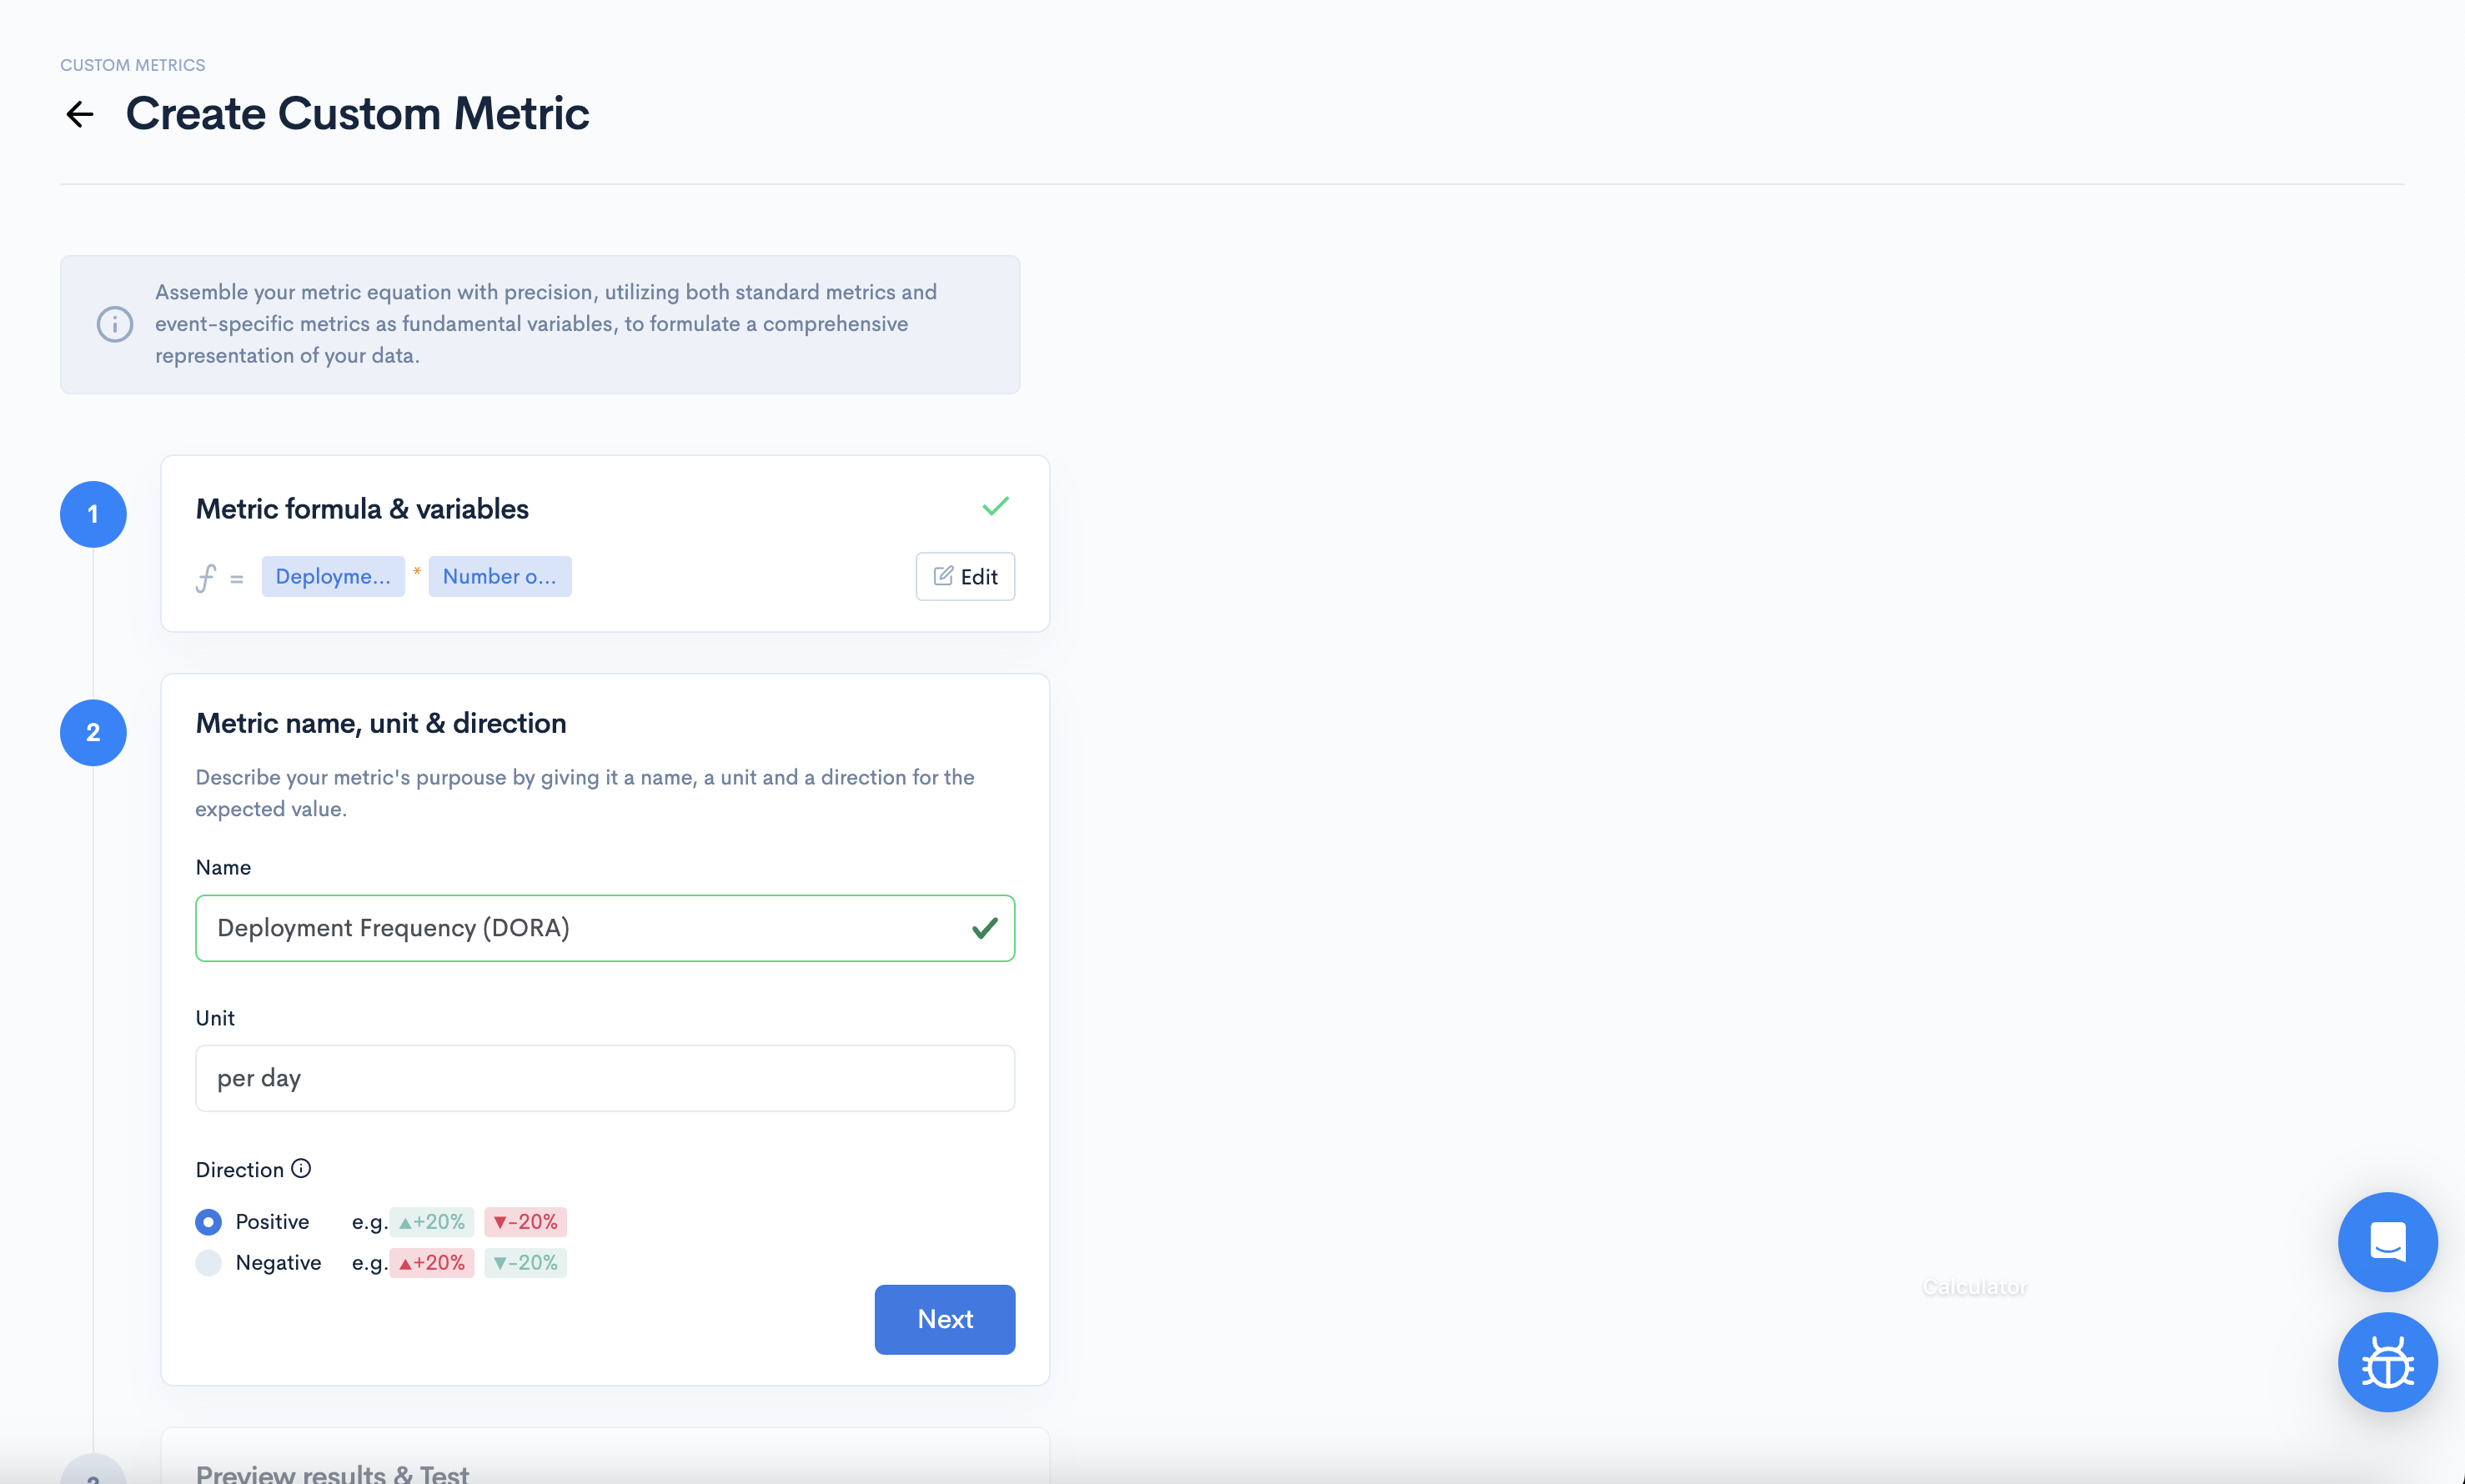
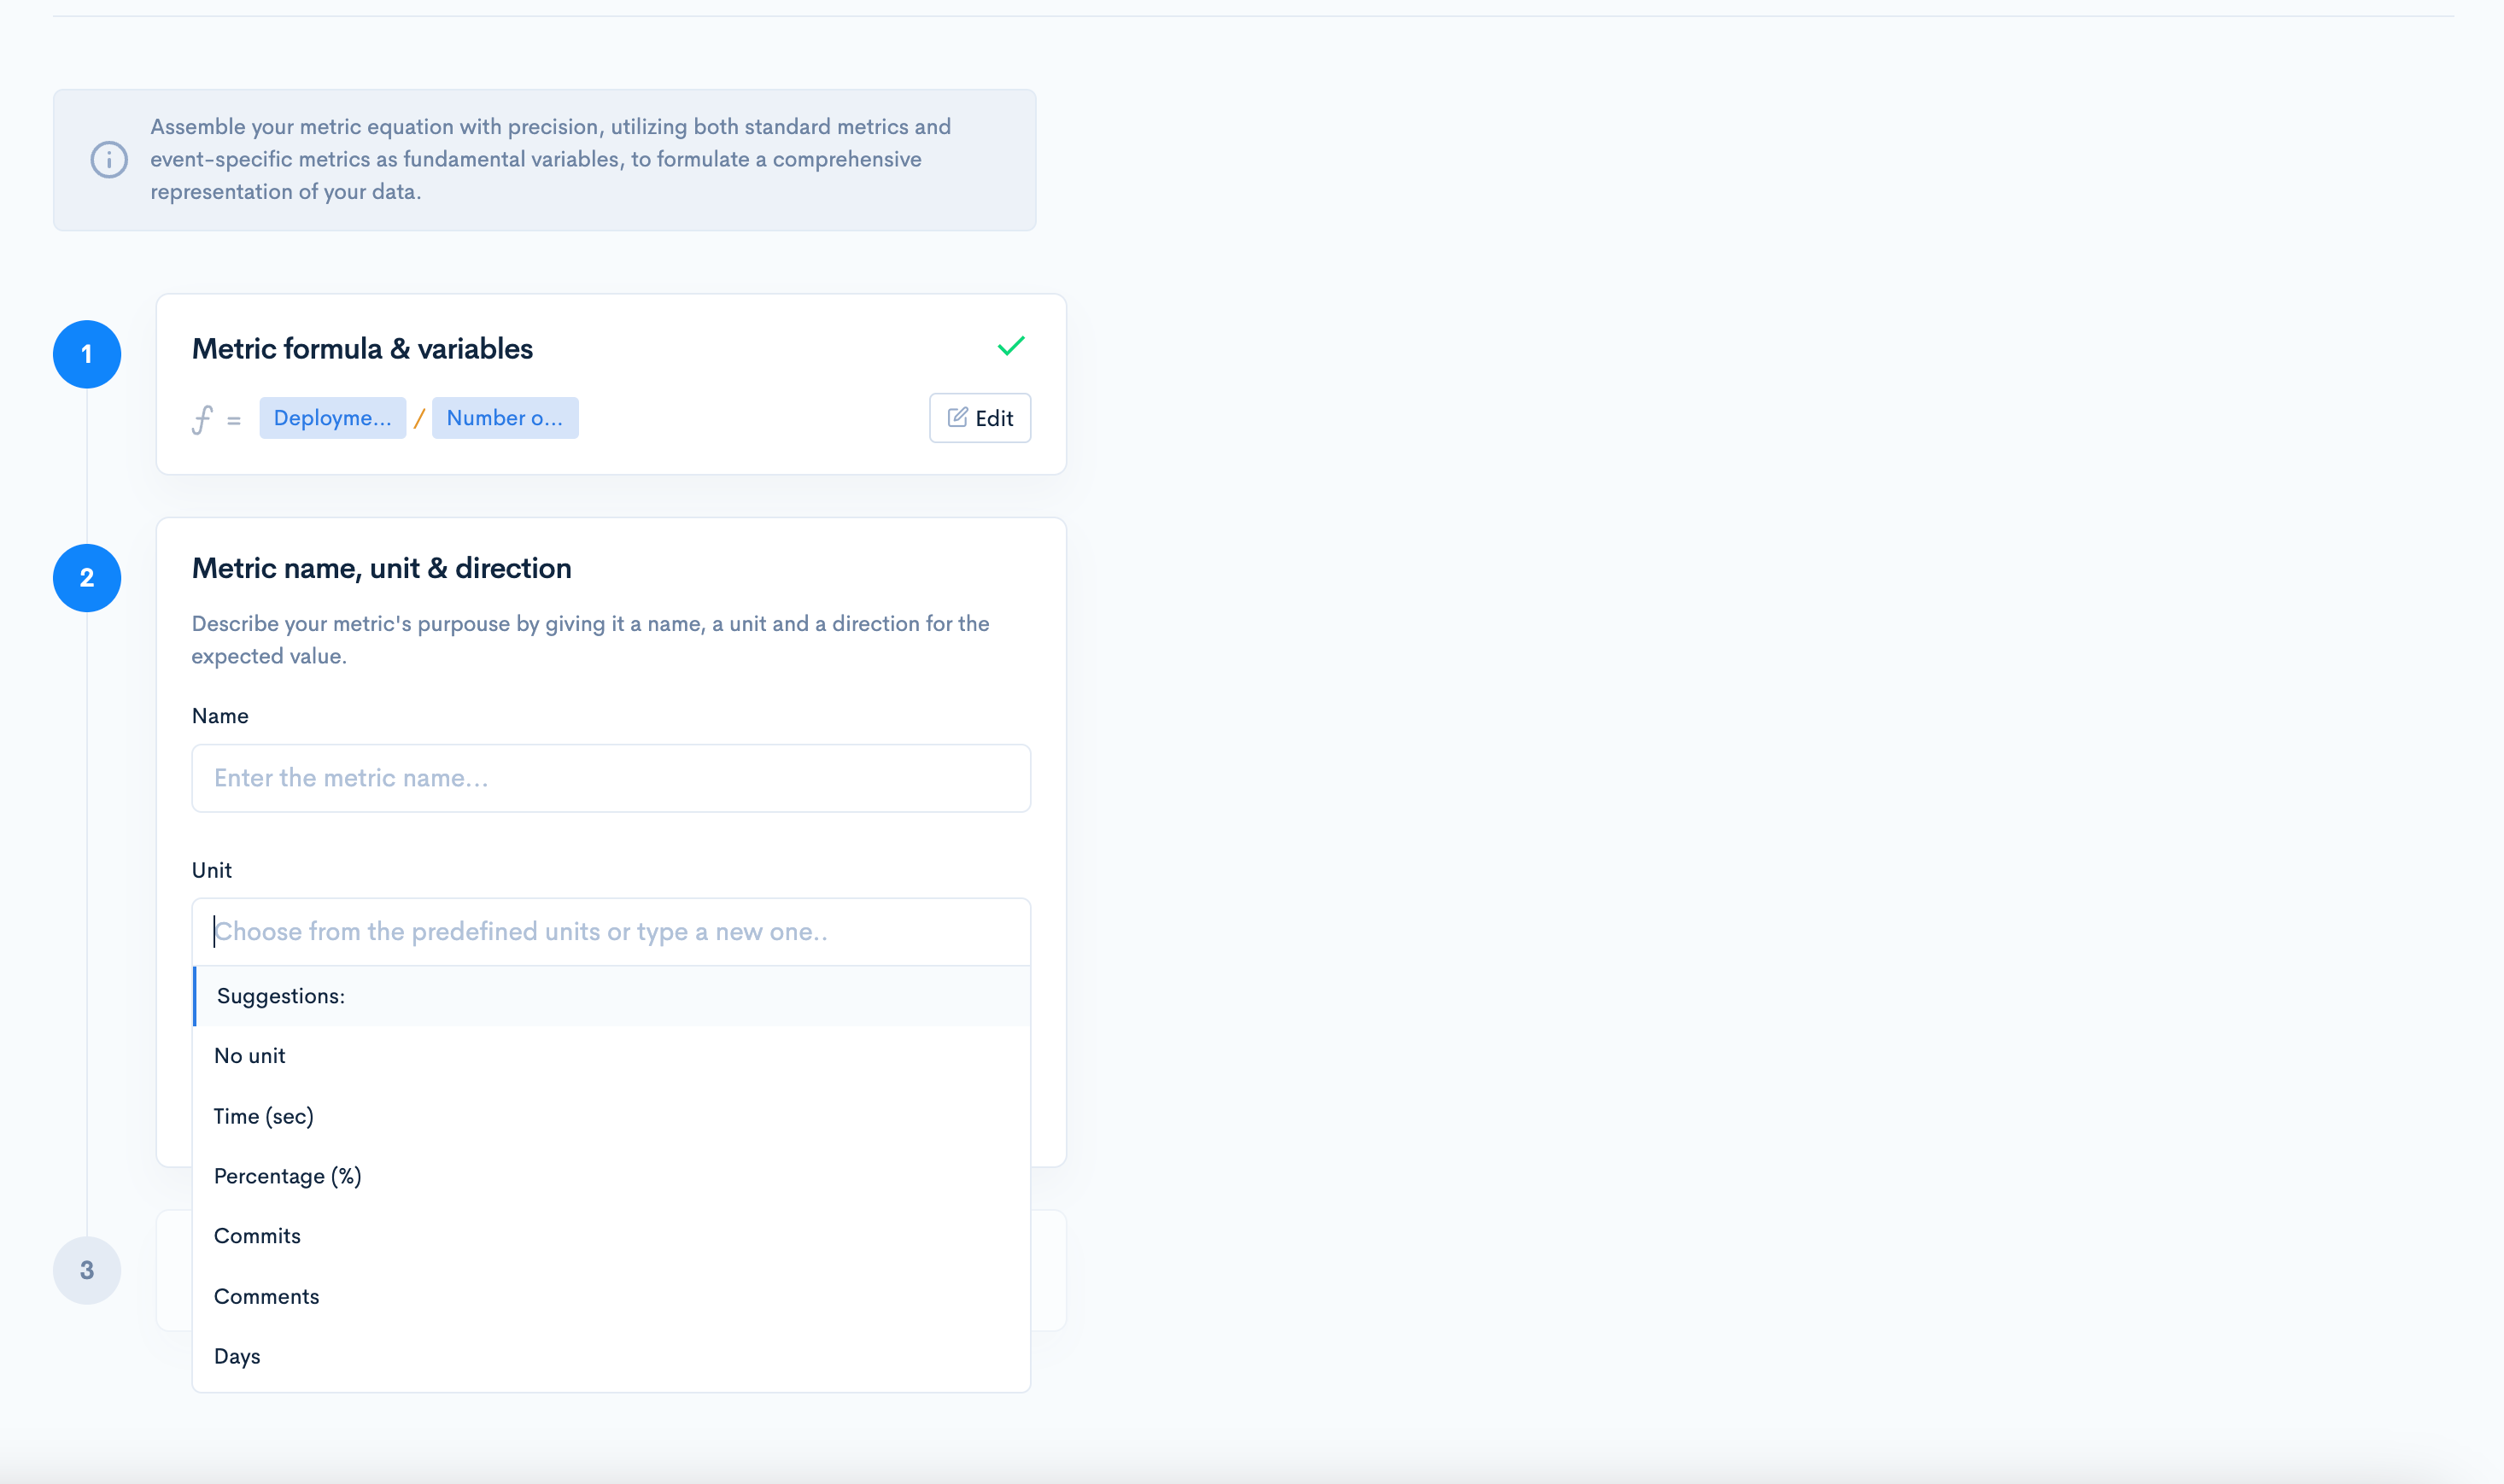
What should be the direction of my metric?
When the direction is Positive, that means it positively influences your team for the metric to increase in value.
When the direction is Negative, it positively influences your team for the metric to decrease in value.
Example: When Churn decreases, it positively affects your team's performance, so it should fall. When Efficiency increases, it positively affects your team, so it should rise
When done, click Next Step.
The last step of creating a Custom metric is previewing the results.
Here, you'll have to select the widget type (Number Widget/ Card Widget)
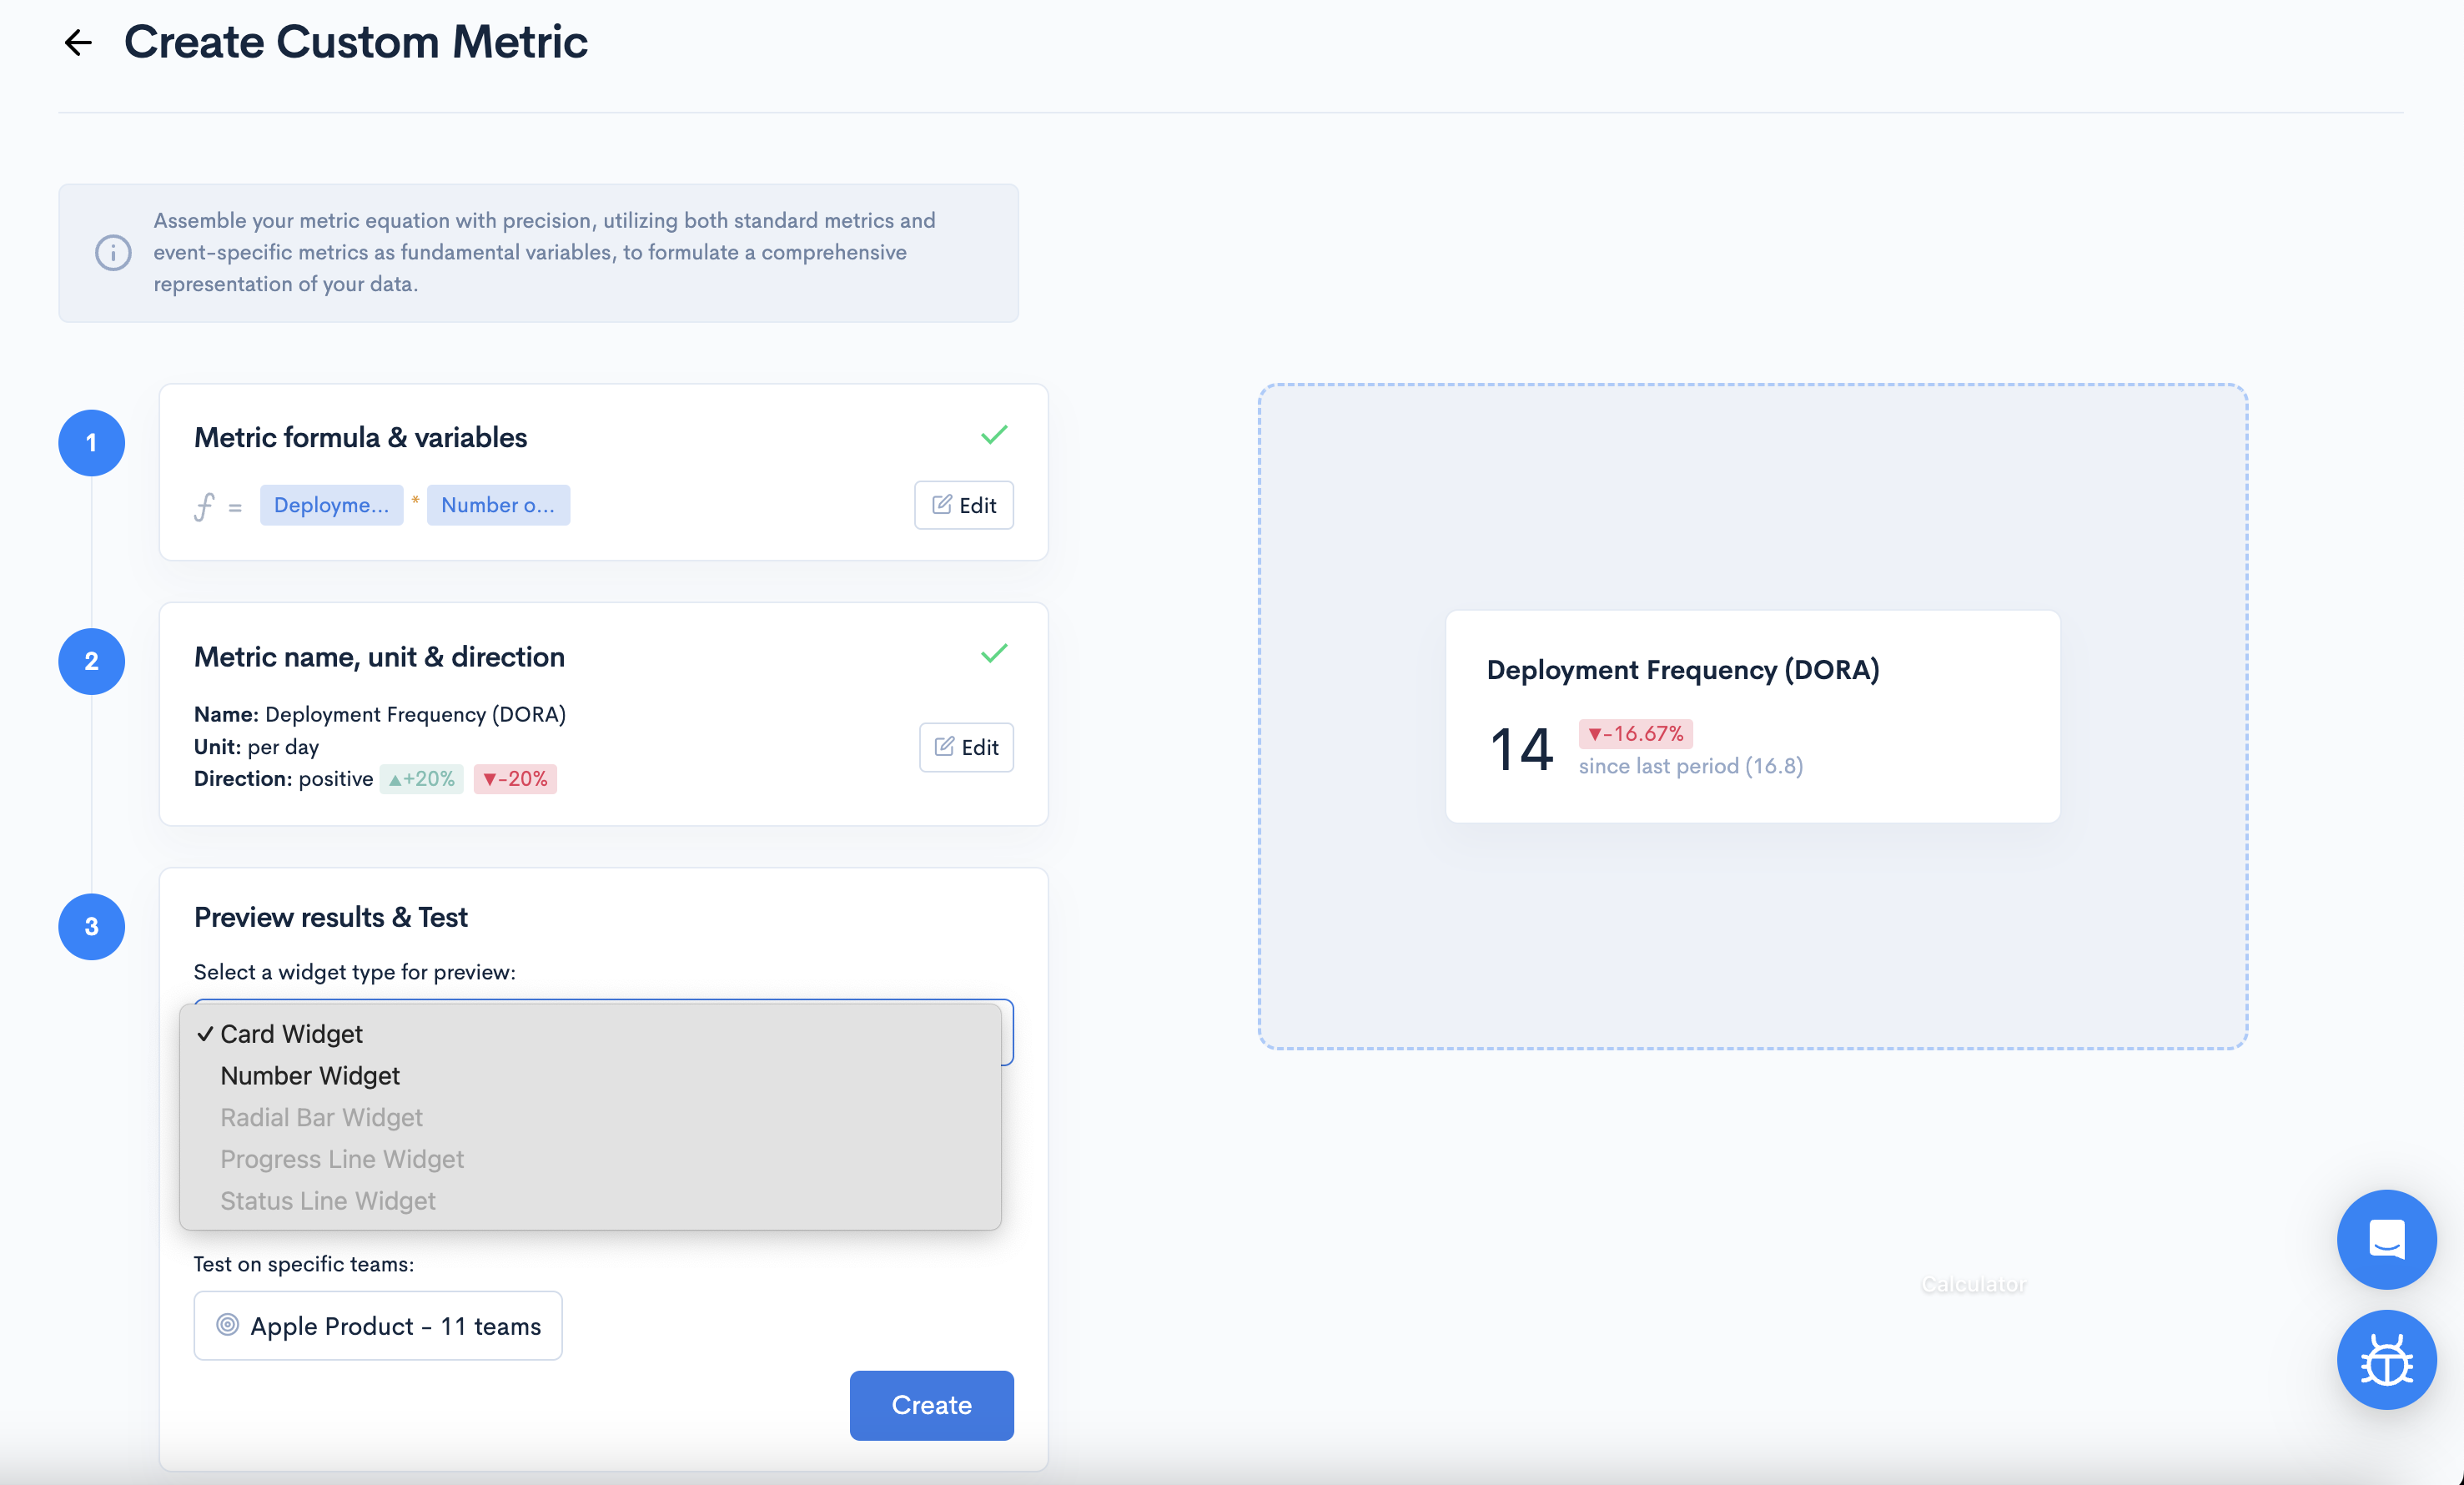
After selecting the widget type, select the time frame of this preview.
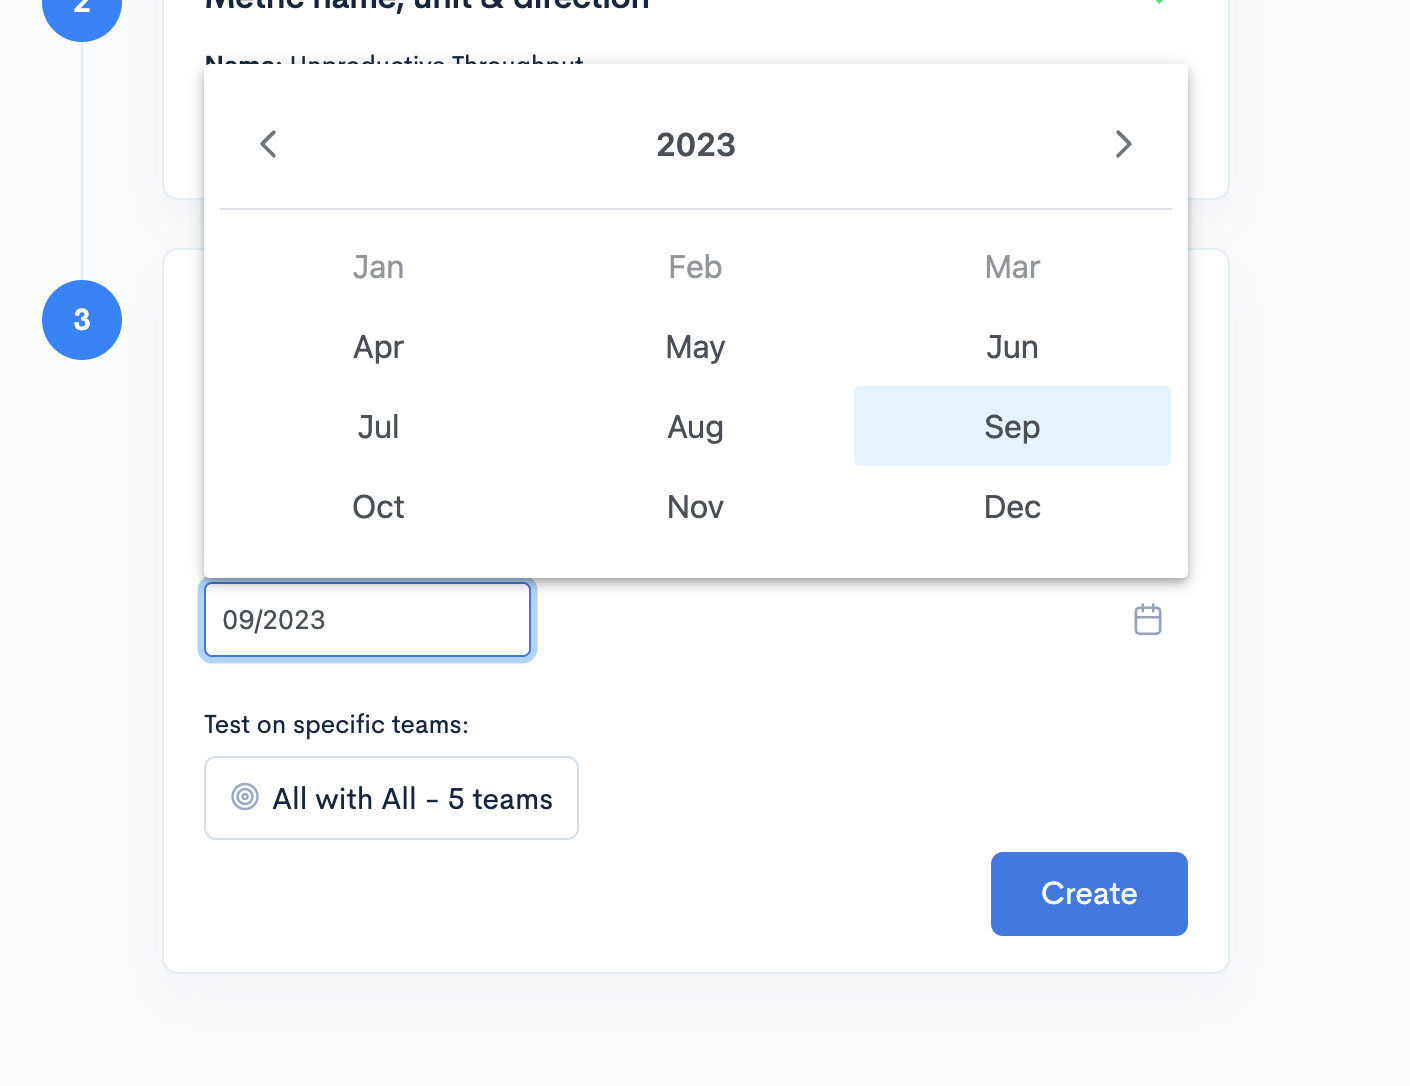
In the end, select the teams for which you want to preview your custom metric.
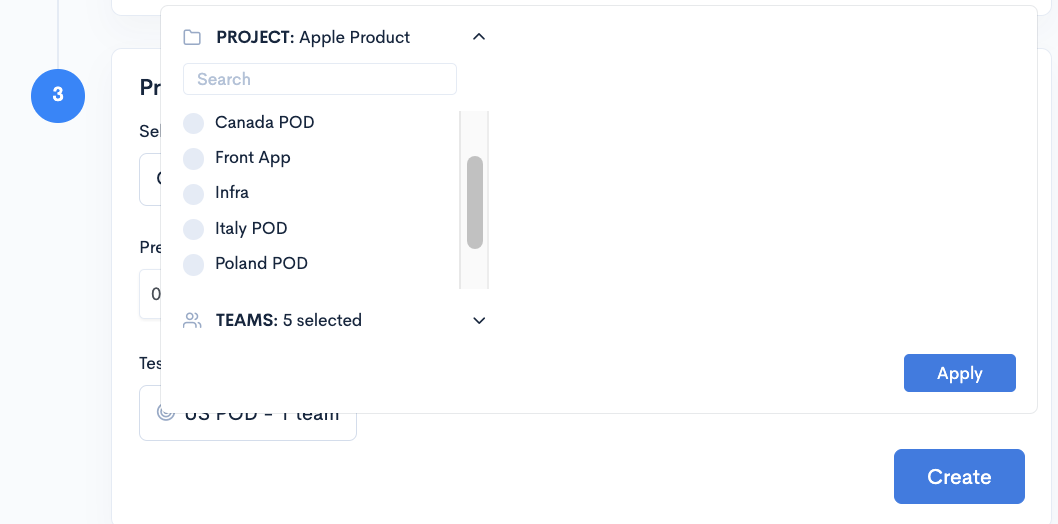
Once you have previewed the metric and you are happy with the result, click the Create button.
Create Custom Events
To configure custom events, click the Configure event metrics button from the metric dropdown.
When the Event Types modal shows up, you can Create event type and you can configure custom event types that you can send to Waydev via the API. Choose the Event Types and an event name. Once done, click create.
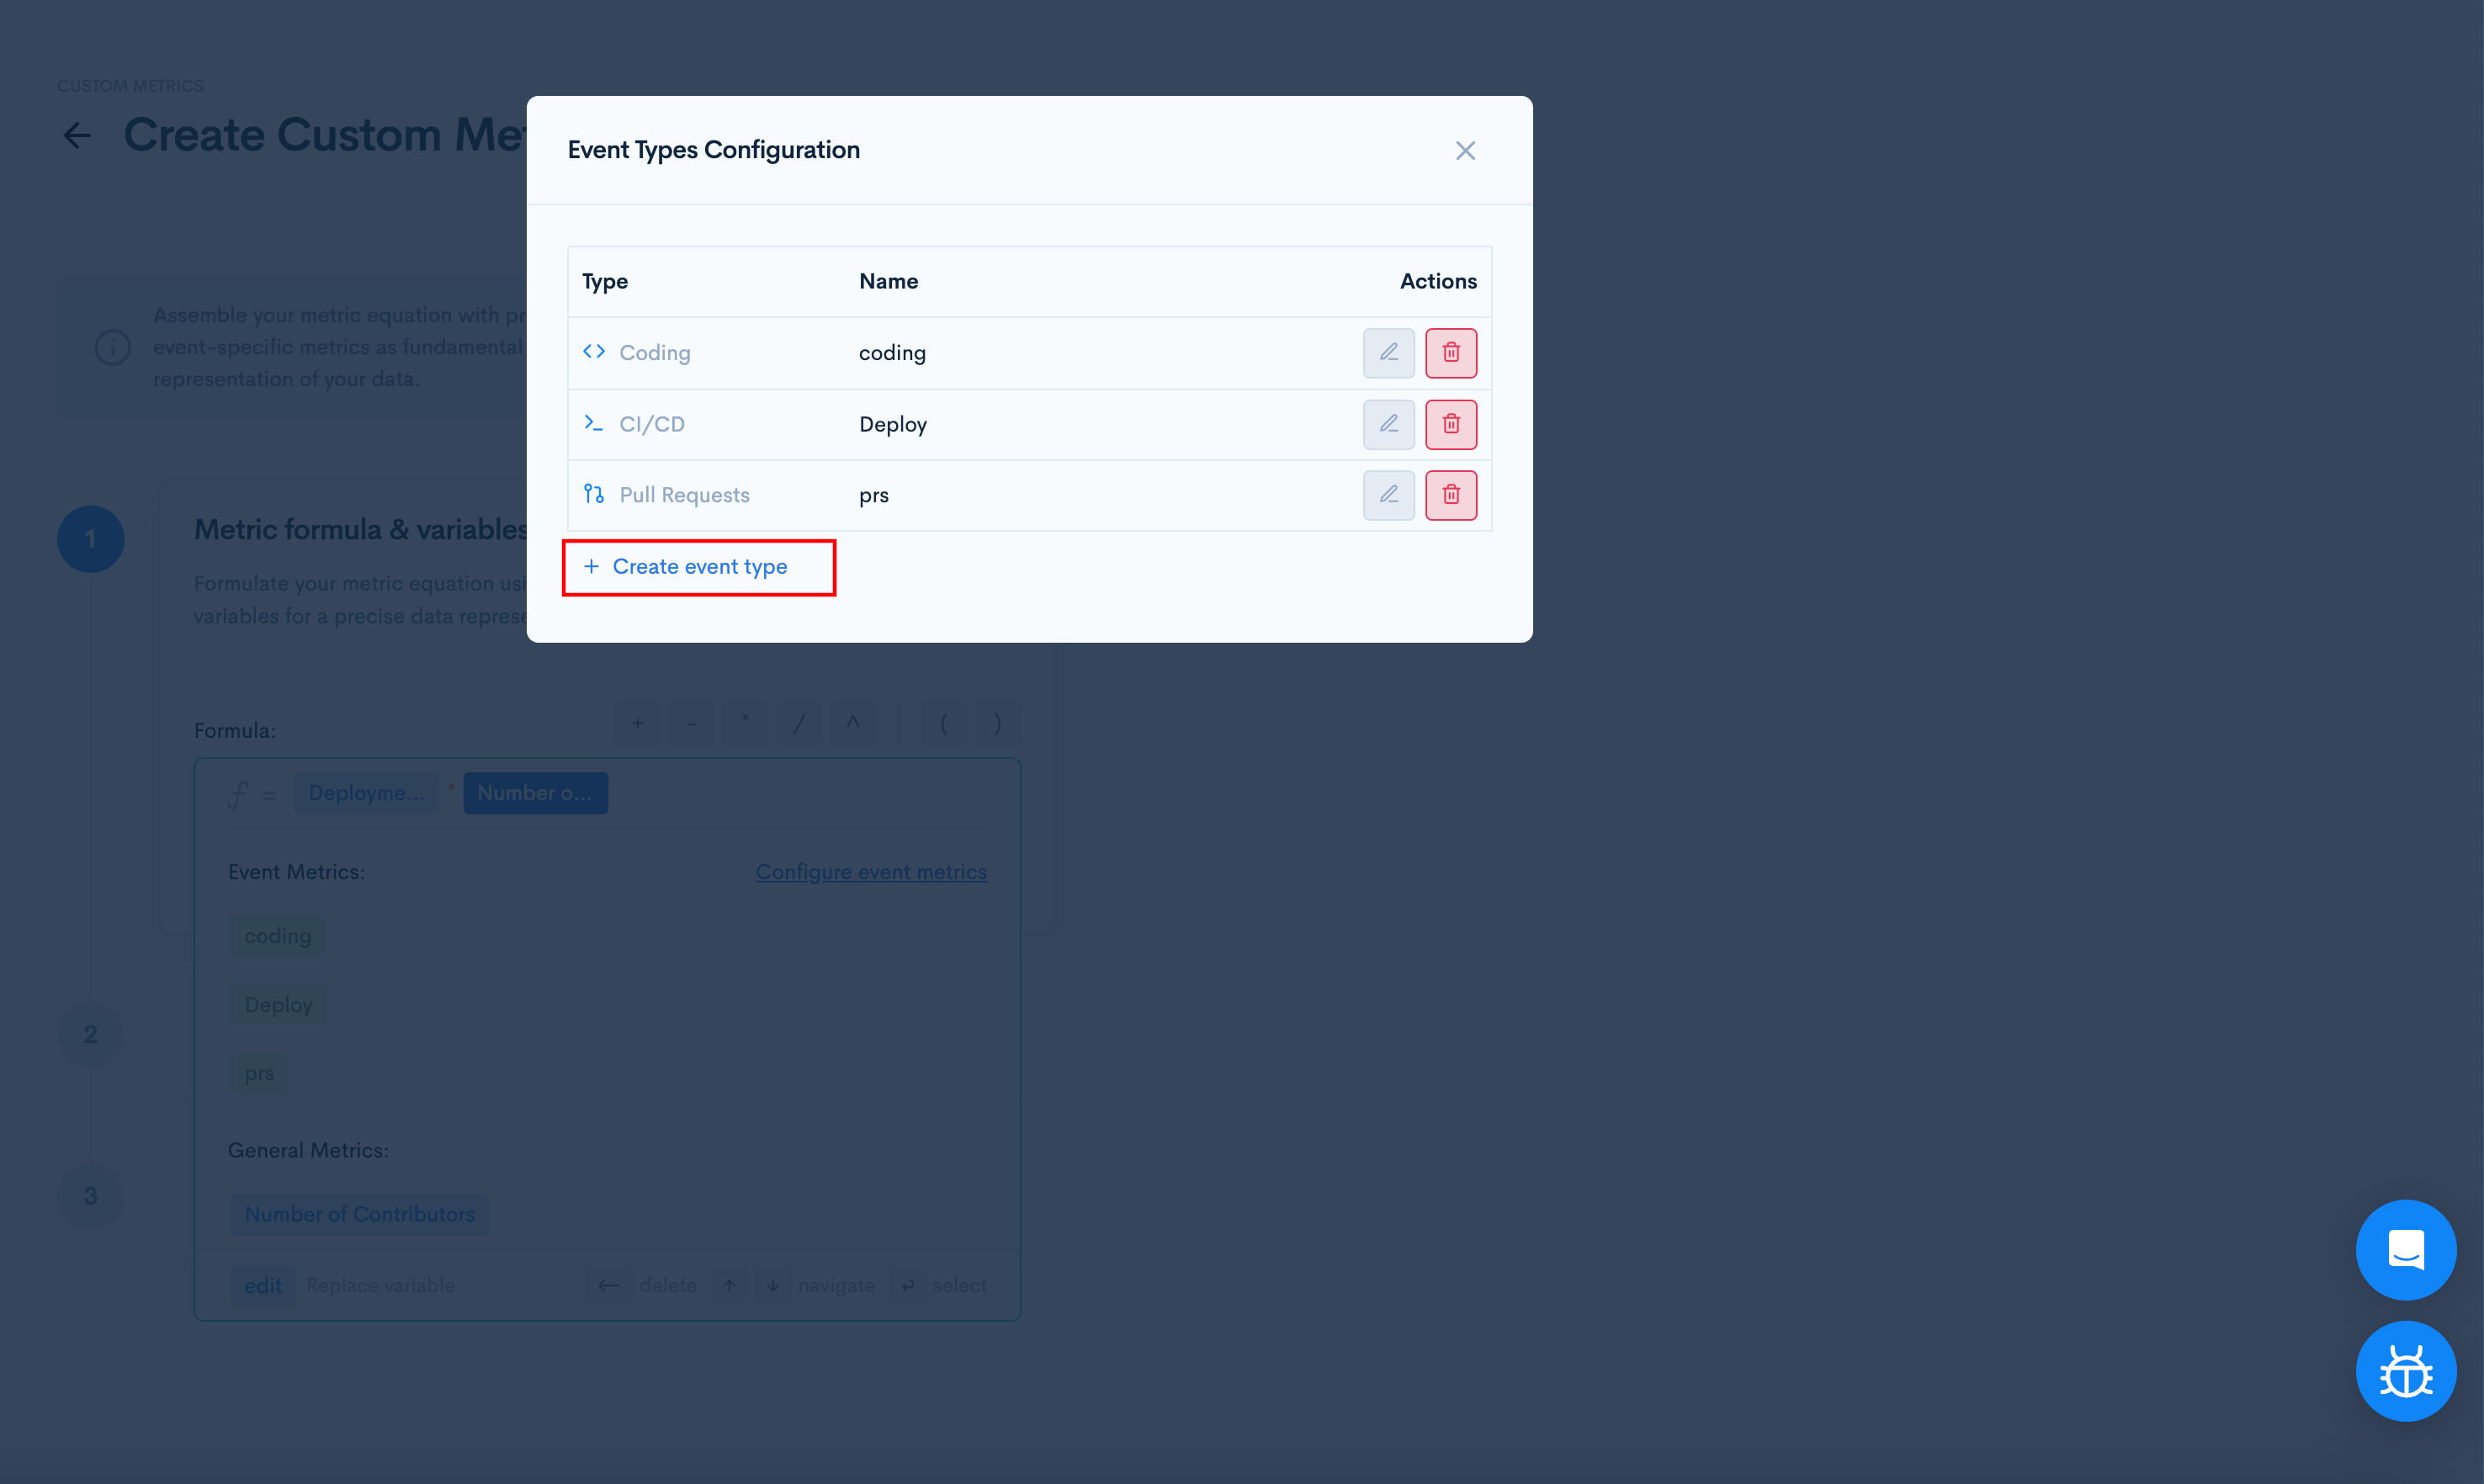
Since the event metrics are based on multiple events, you can apply aggregation functions to them (count; sum; min; max; first; last), so that they result in a single value, for the selected filters.

Once done, click the Create button
See your Custom Metrics
To see your Custom Metrics, you need to add them to a Dashboard.
- To add metric cards for each metric you created, select "Customize", in the Dashboards section from the side bar menu.
- Create a new dashboard by clicking “New Dashboard” or edit an existing dashboard by clicking the "Edit Dashboard" button from the one you want to edit.

- Select "Metric Card" or "Metric Number."
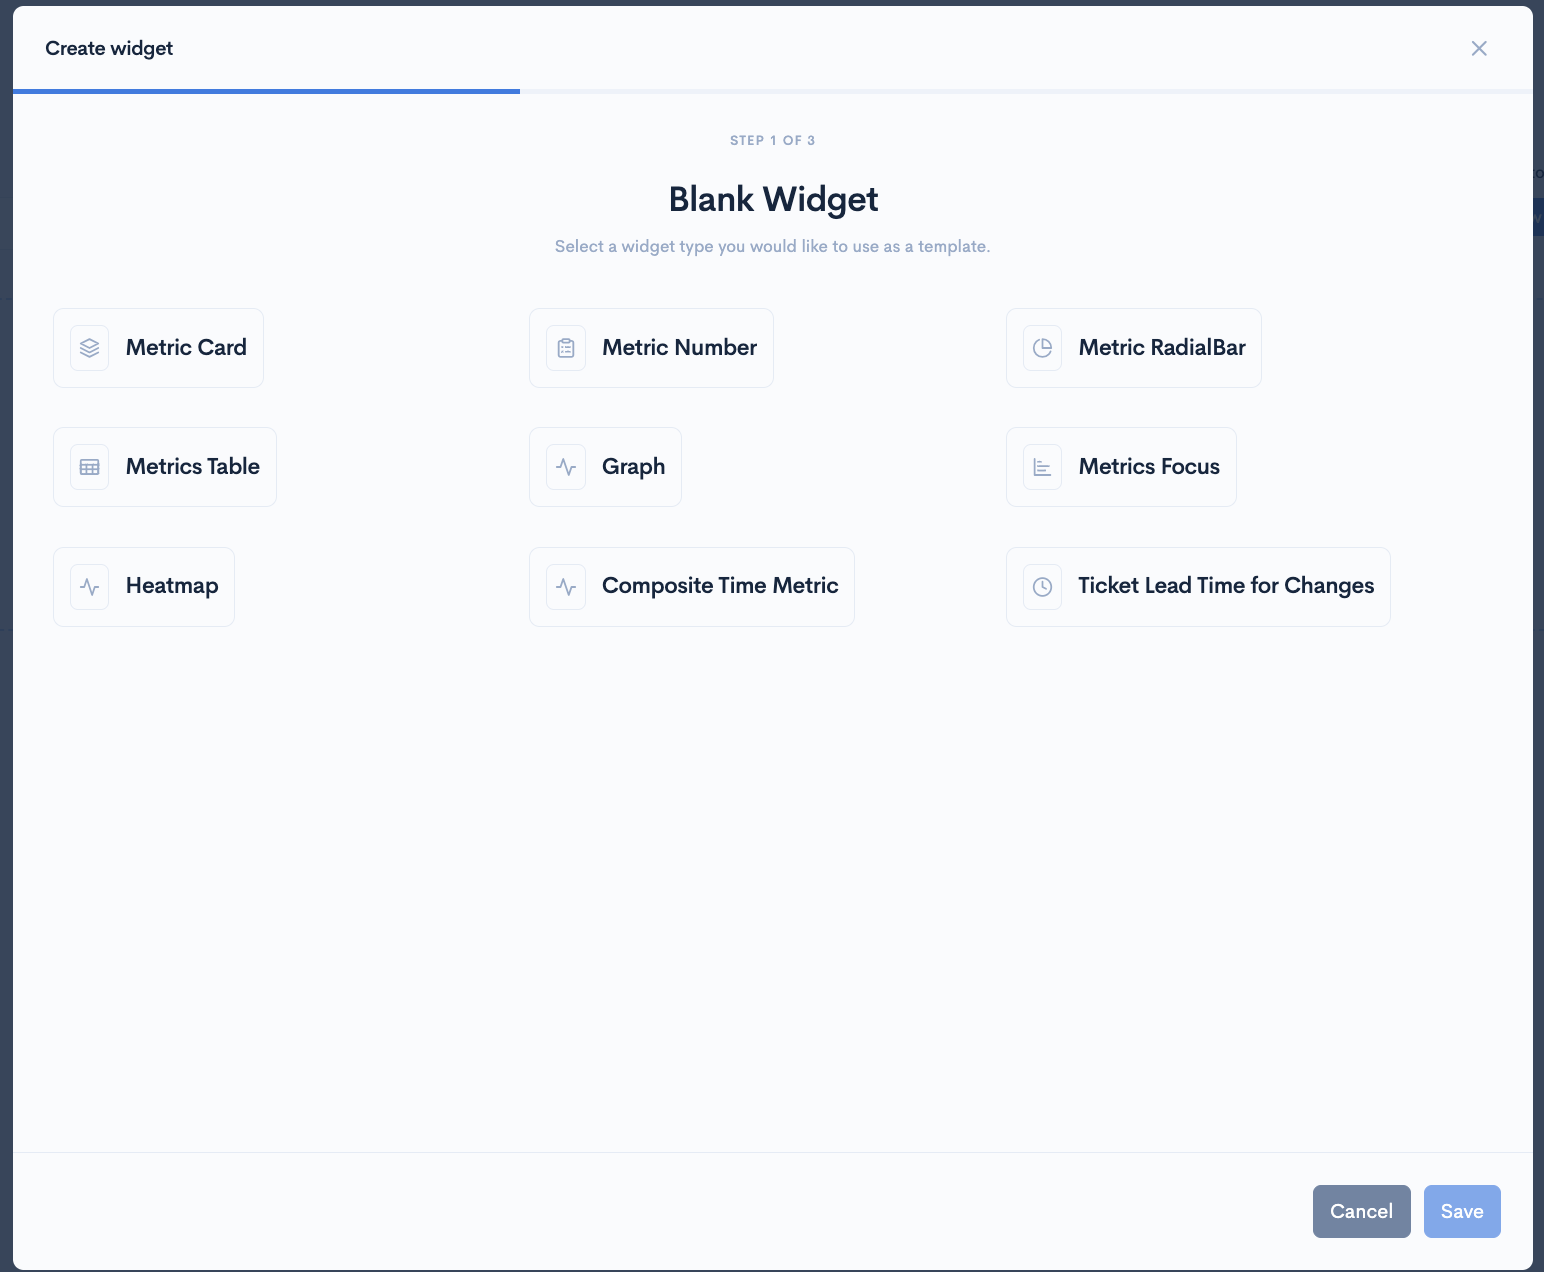
"Metric Card" and "Metric Number" are currently the only widgets custom metrics can be displayed in.
-
After selecting the widget, search for your custom metric in the "Selected Metrics" dropdown and choose the custom metric you want to see in your dashboard.
-
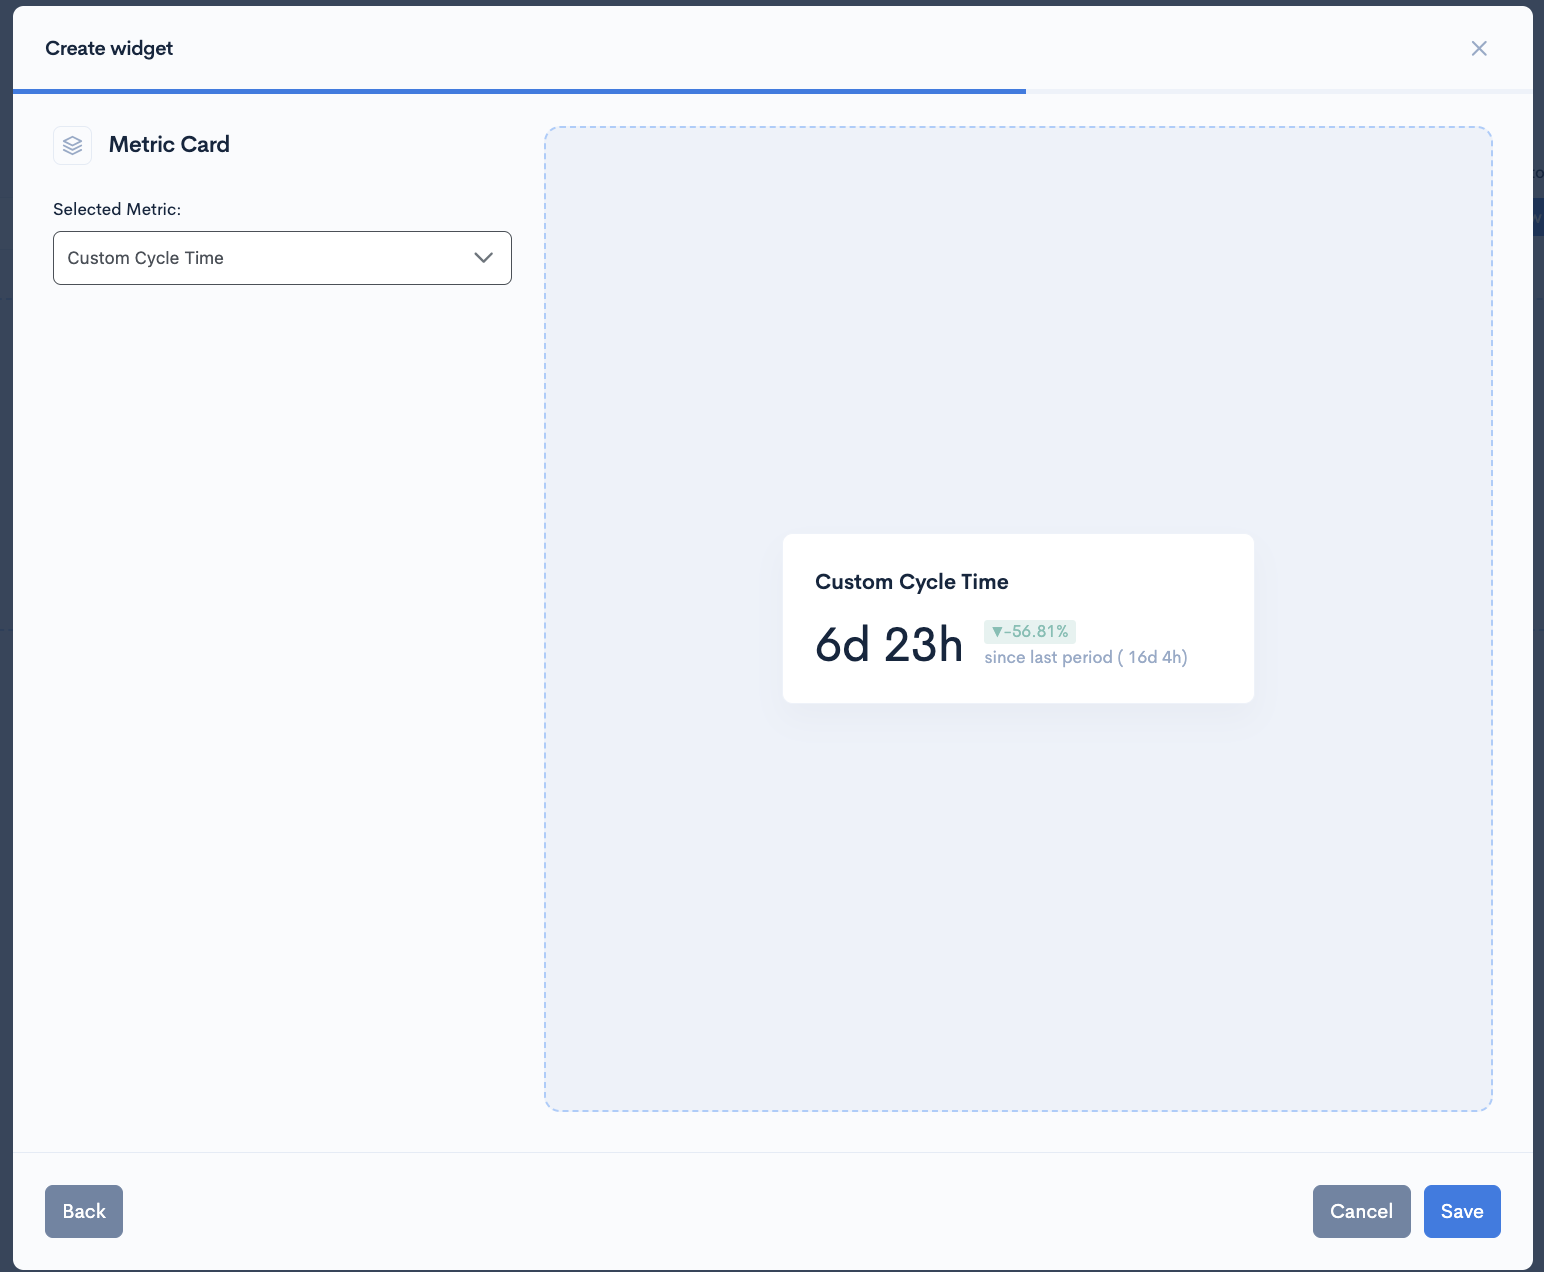
After you configure your widget, click "Save", and the widget will appear in the Dashboard.

Updated about 2 months ago