
Benchmark
This feature enhances your ability to comprehensively assess team and individual performance. Visualize data effectively using cards, tables, scatter plots, and radar charts.
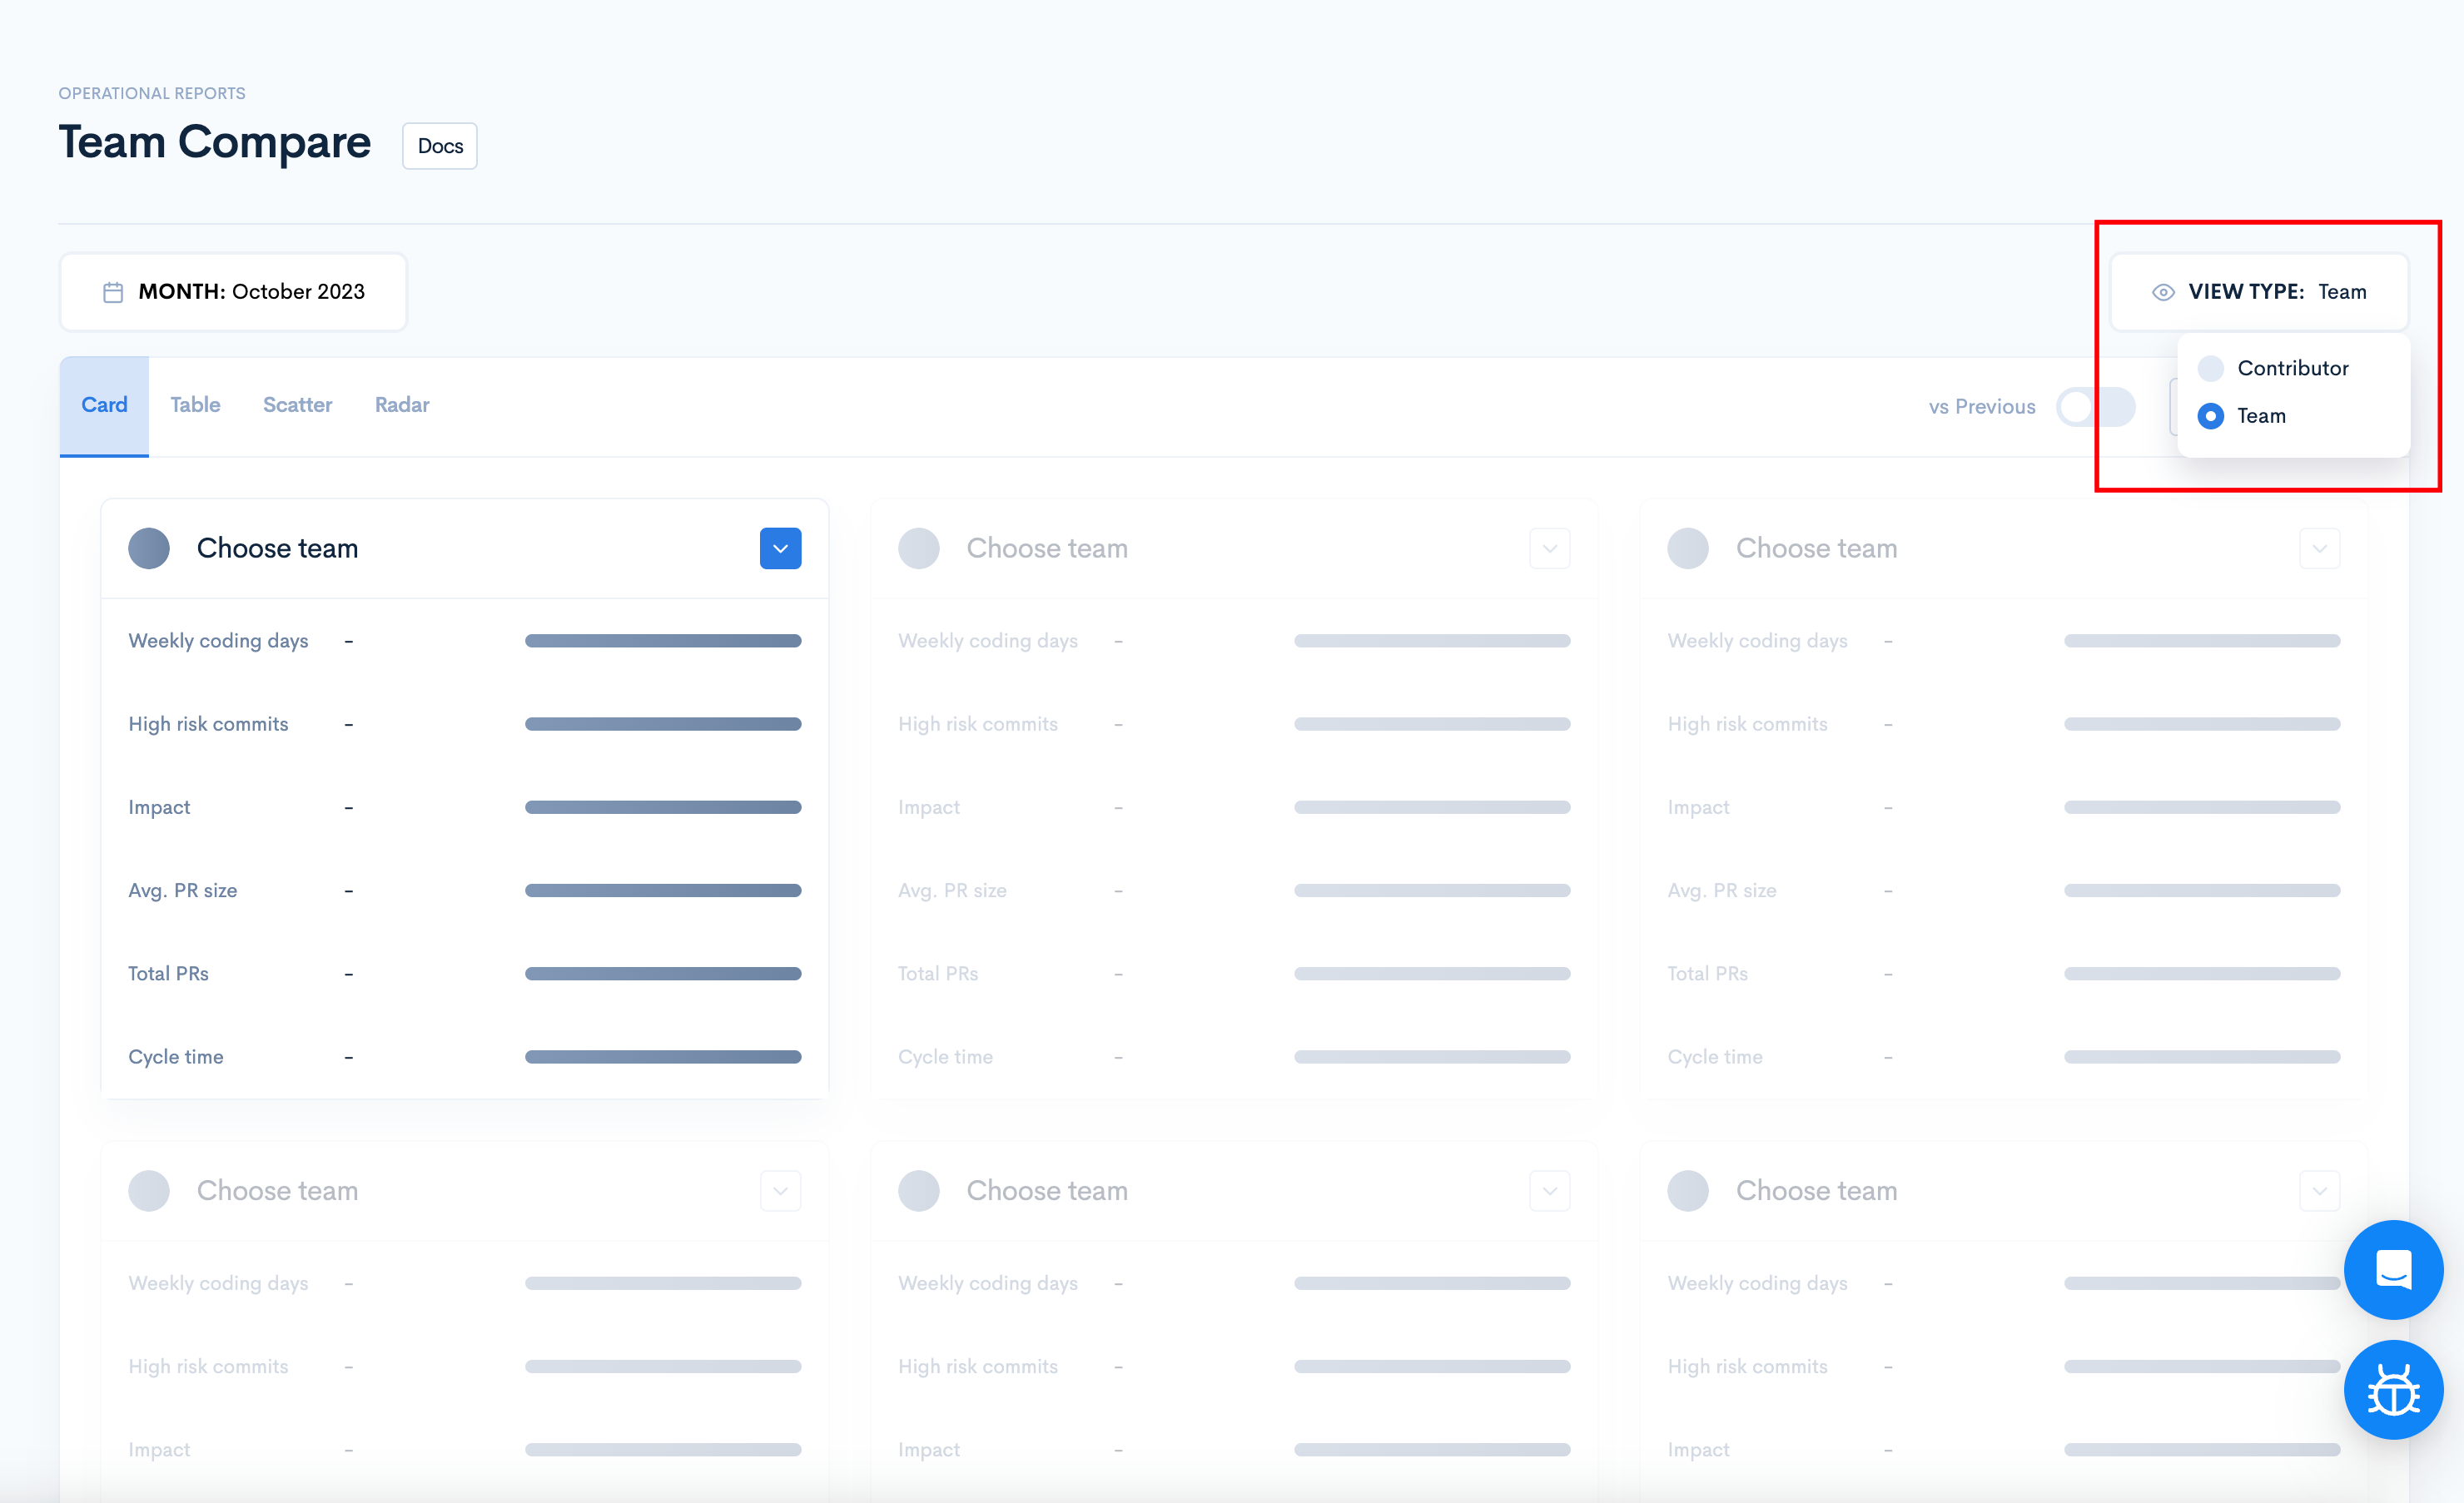
To use this feature, first select the time frame and the view type.
If you have the contributor names hidden, you will not have the "view type" option.
After selecting teams, they will appear on each tab.
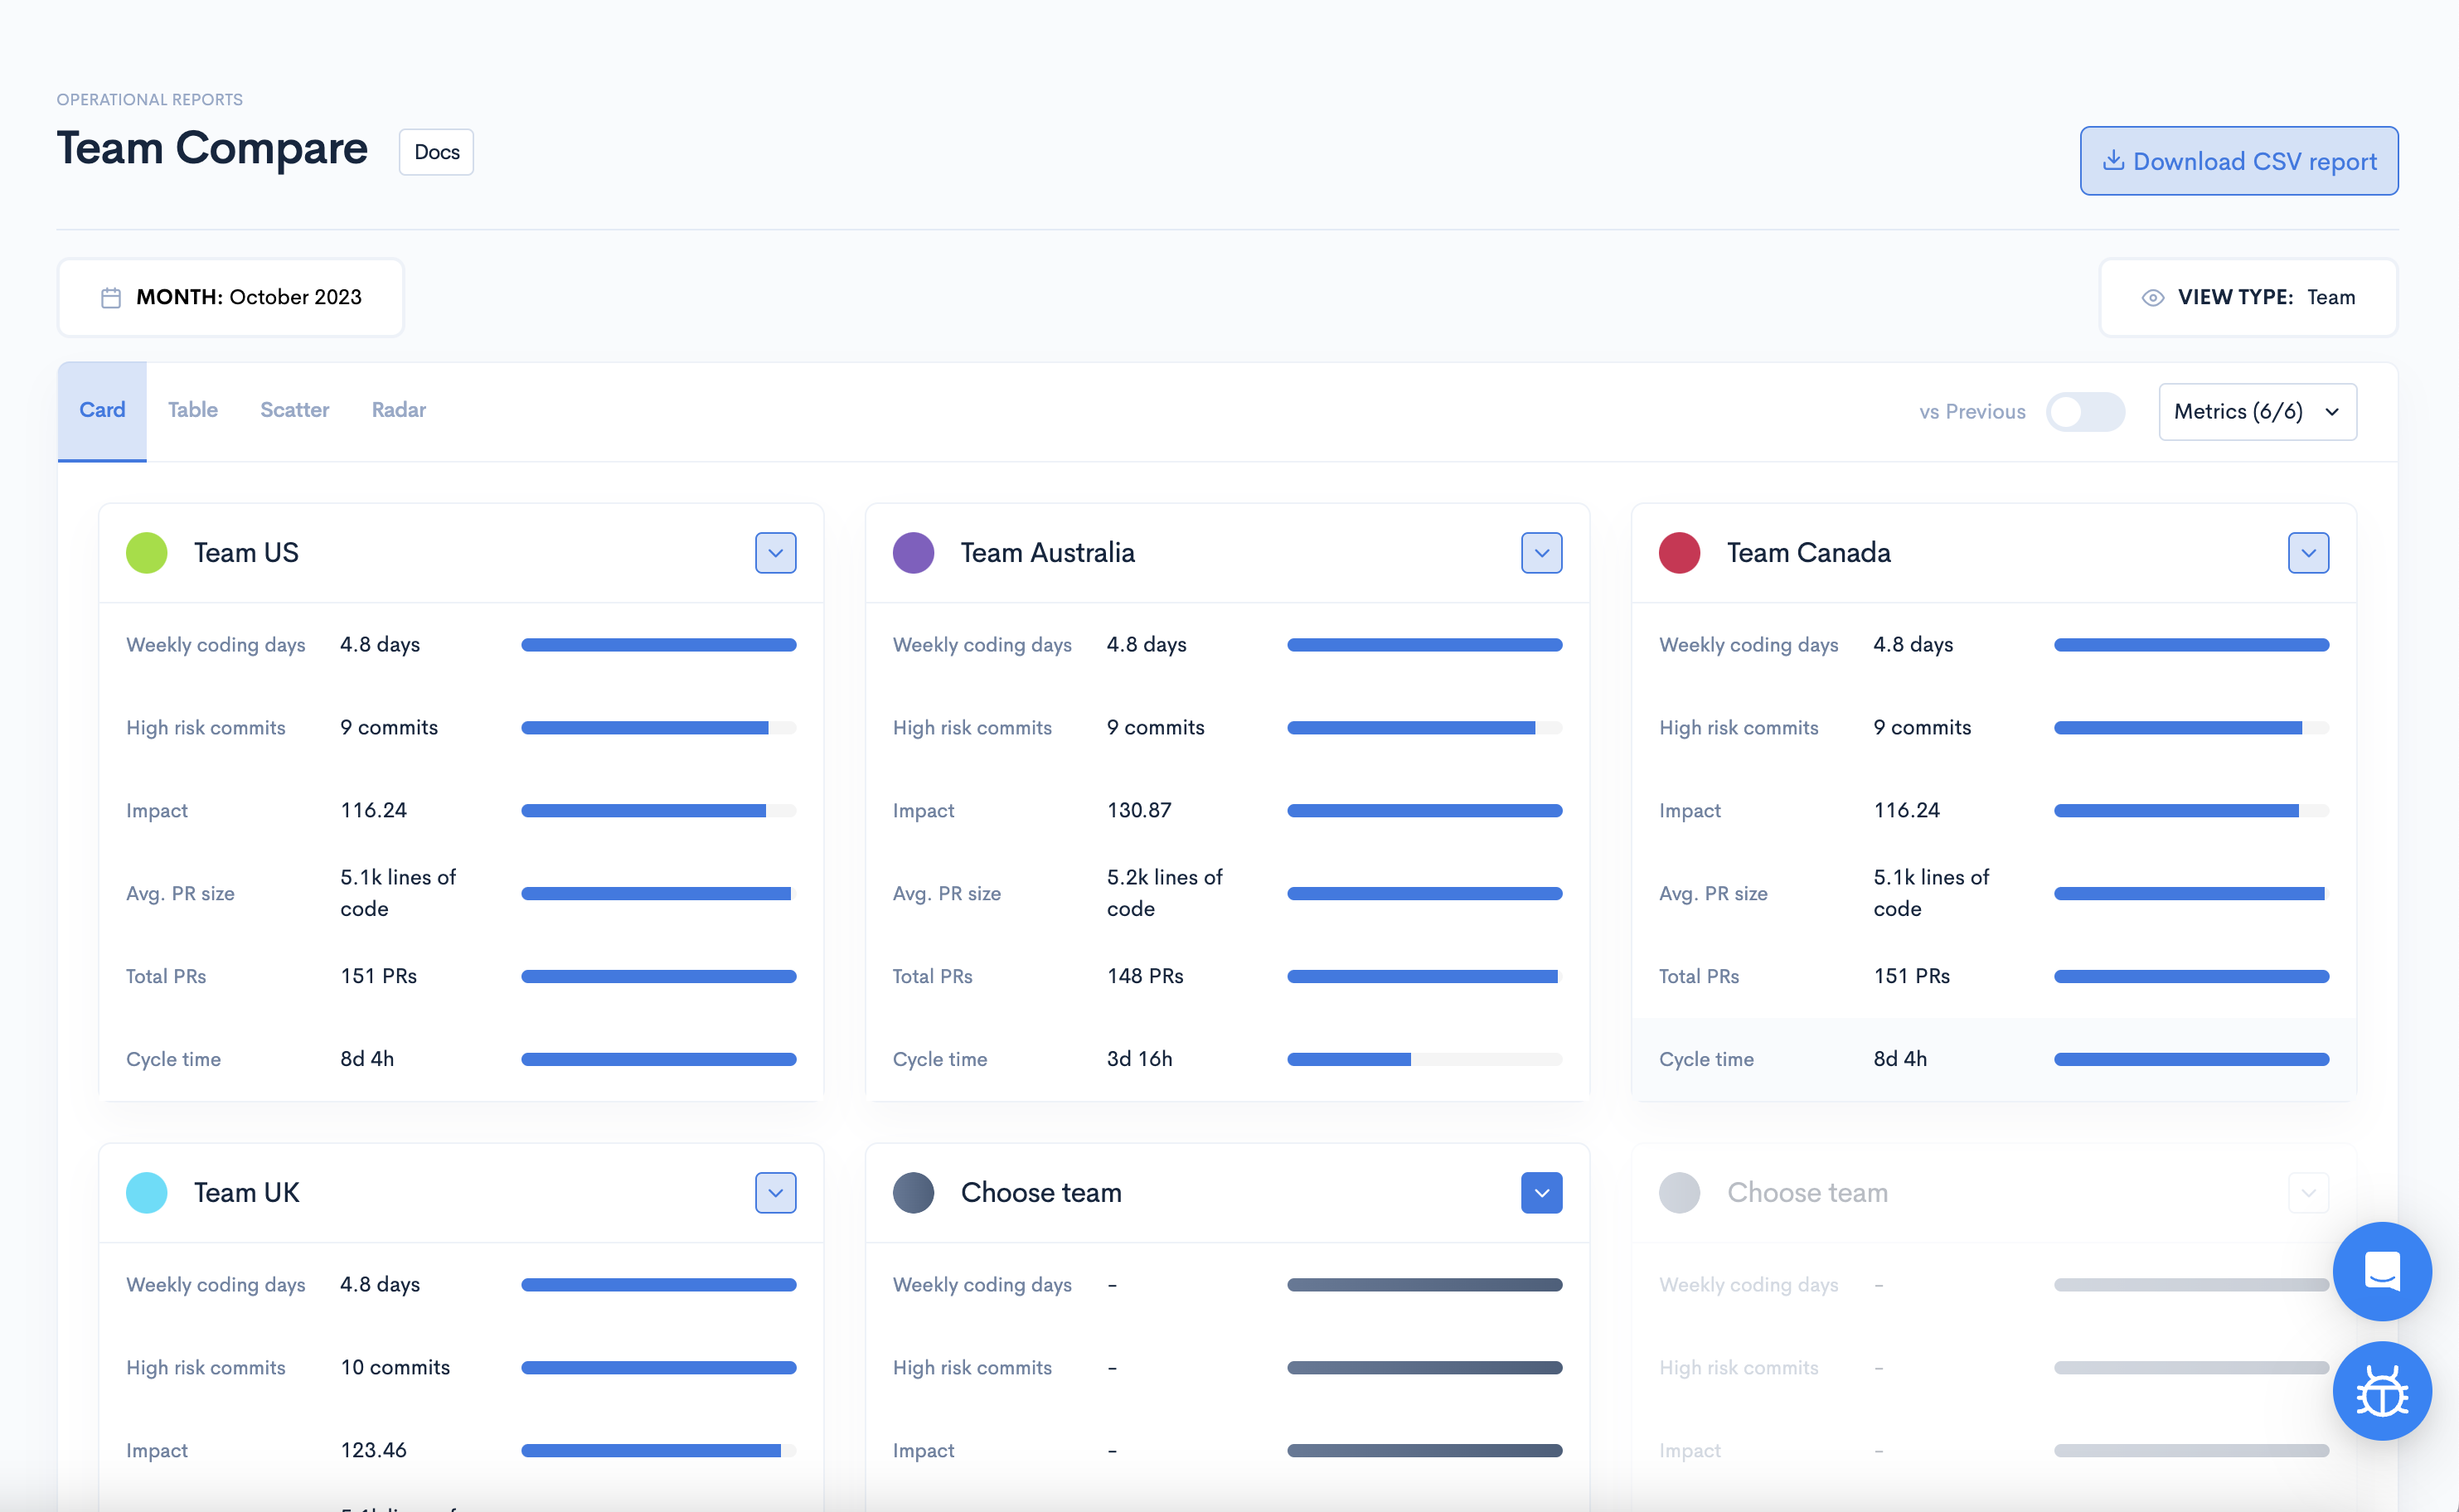
Card
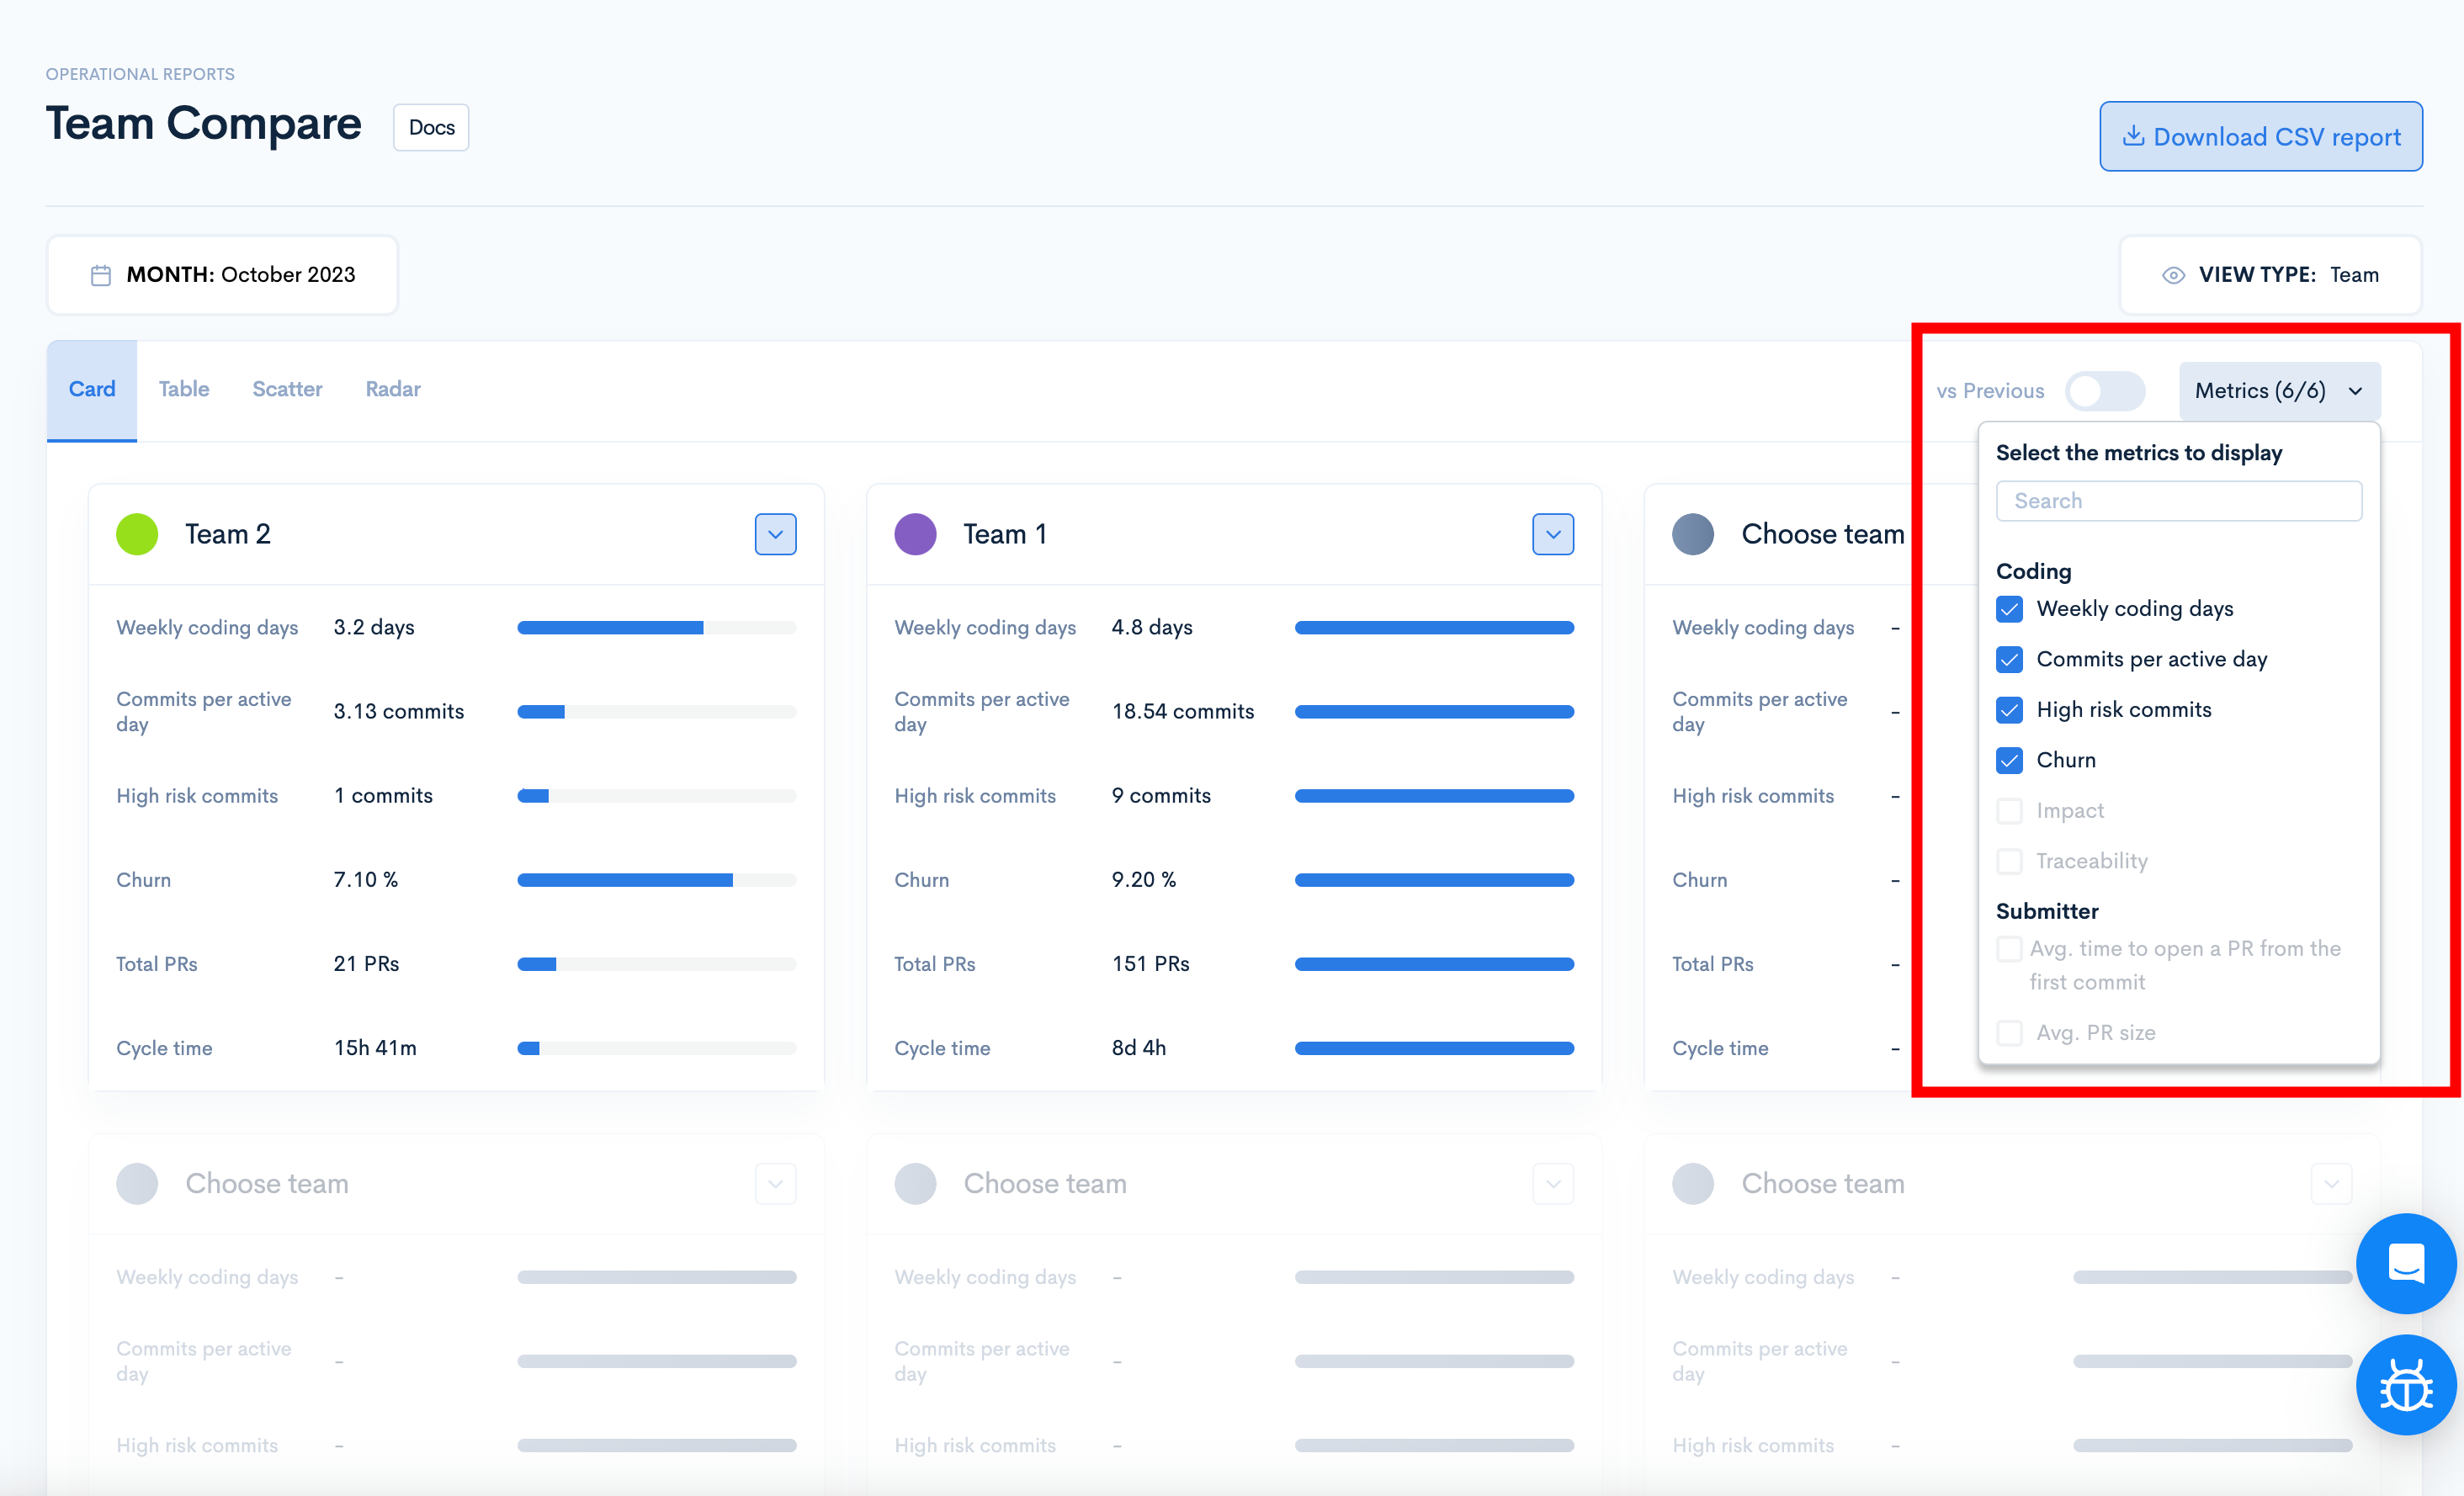
The card visualization feature enables a side-by-side comparison of up to six teams or contributors, displaying their performance metrics on individual cards for easy analysis.
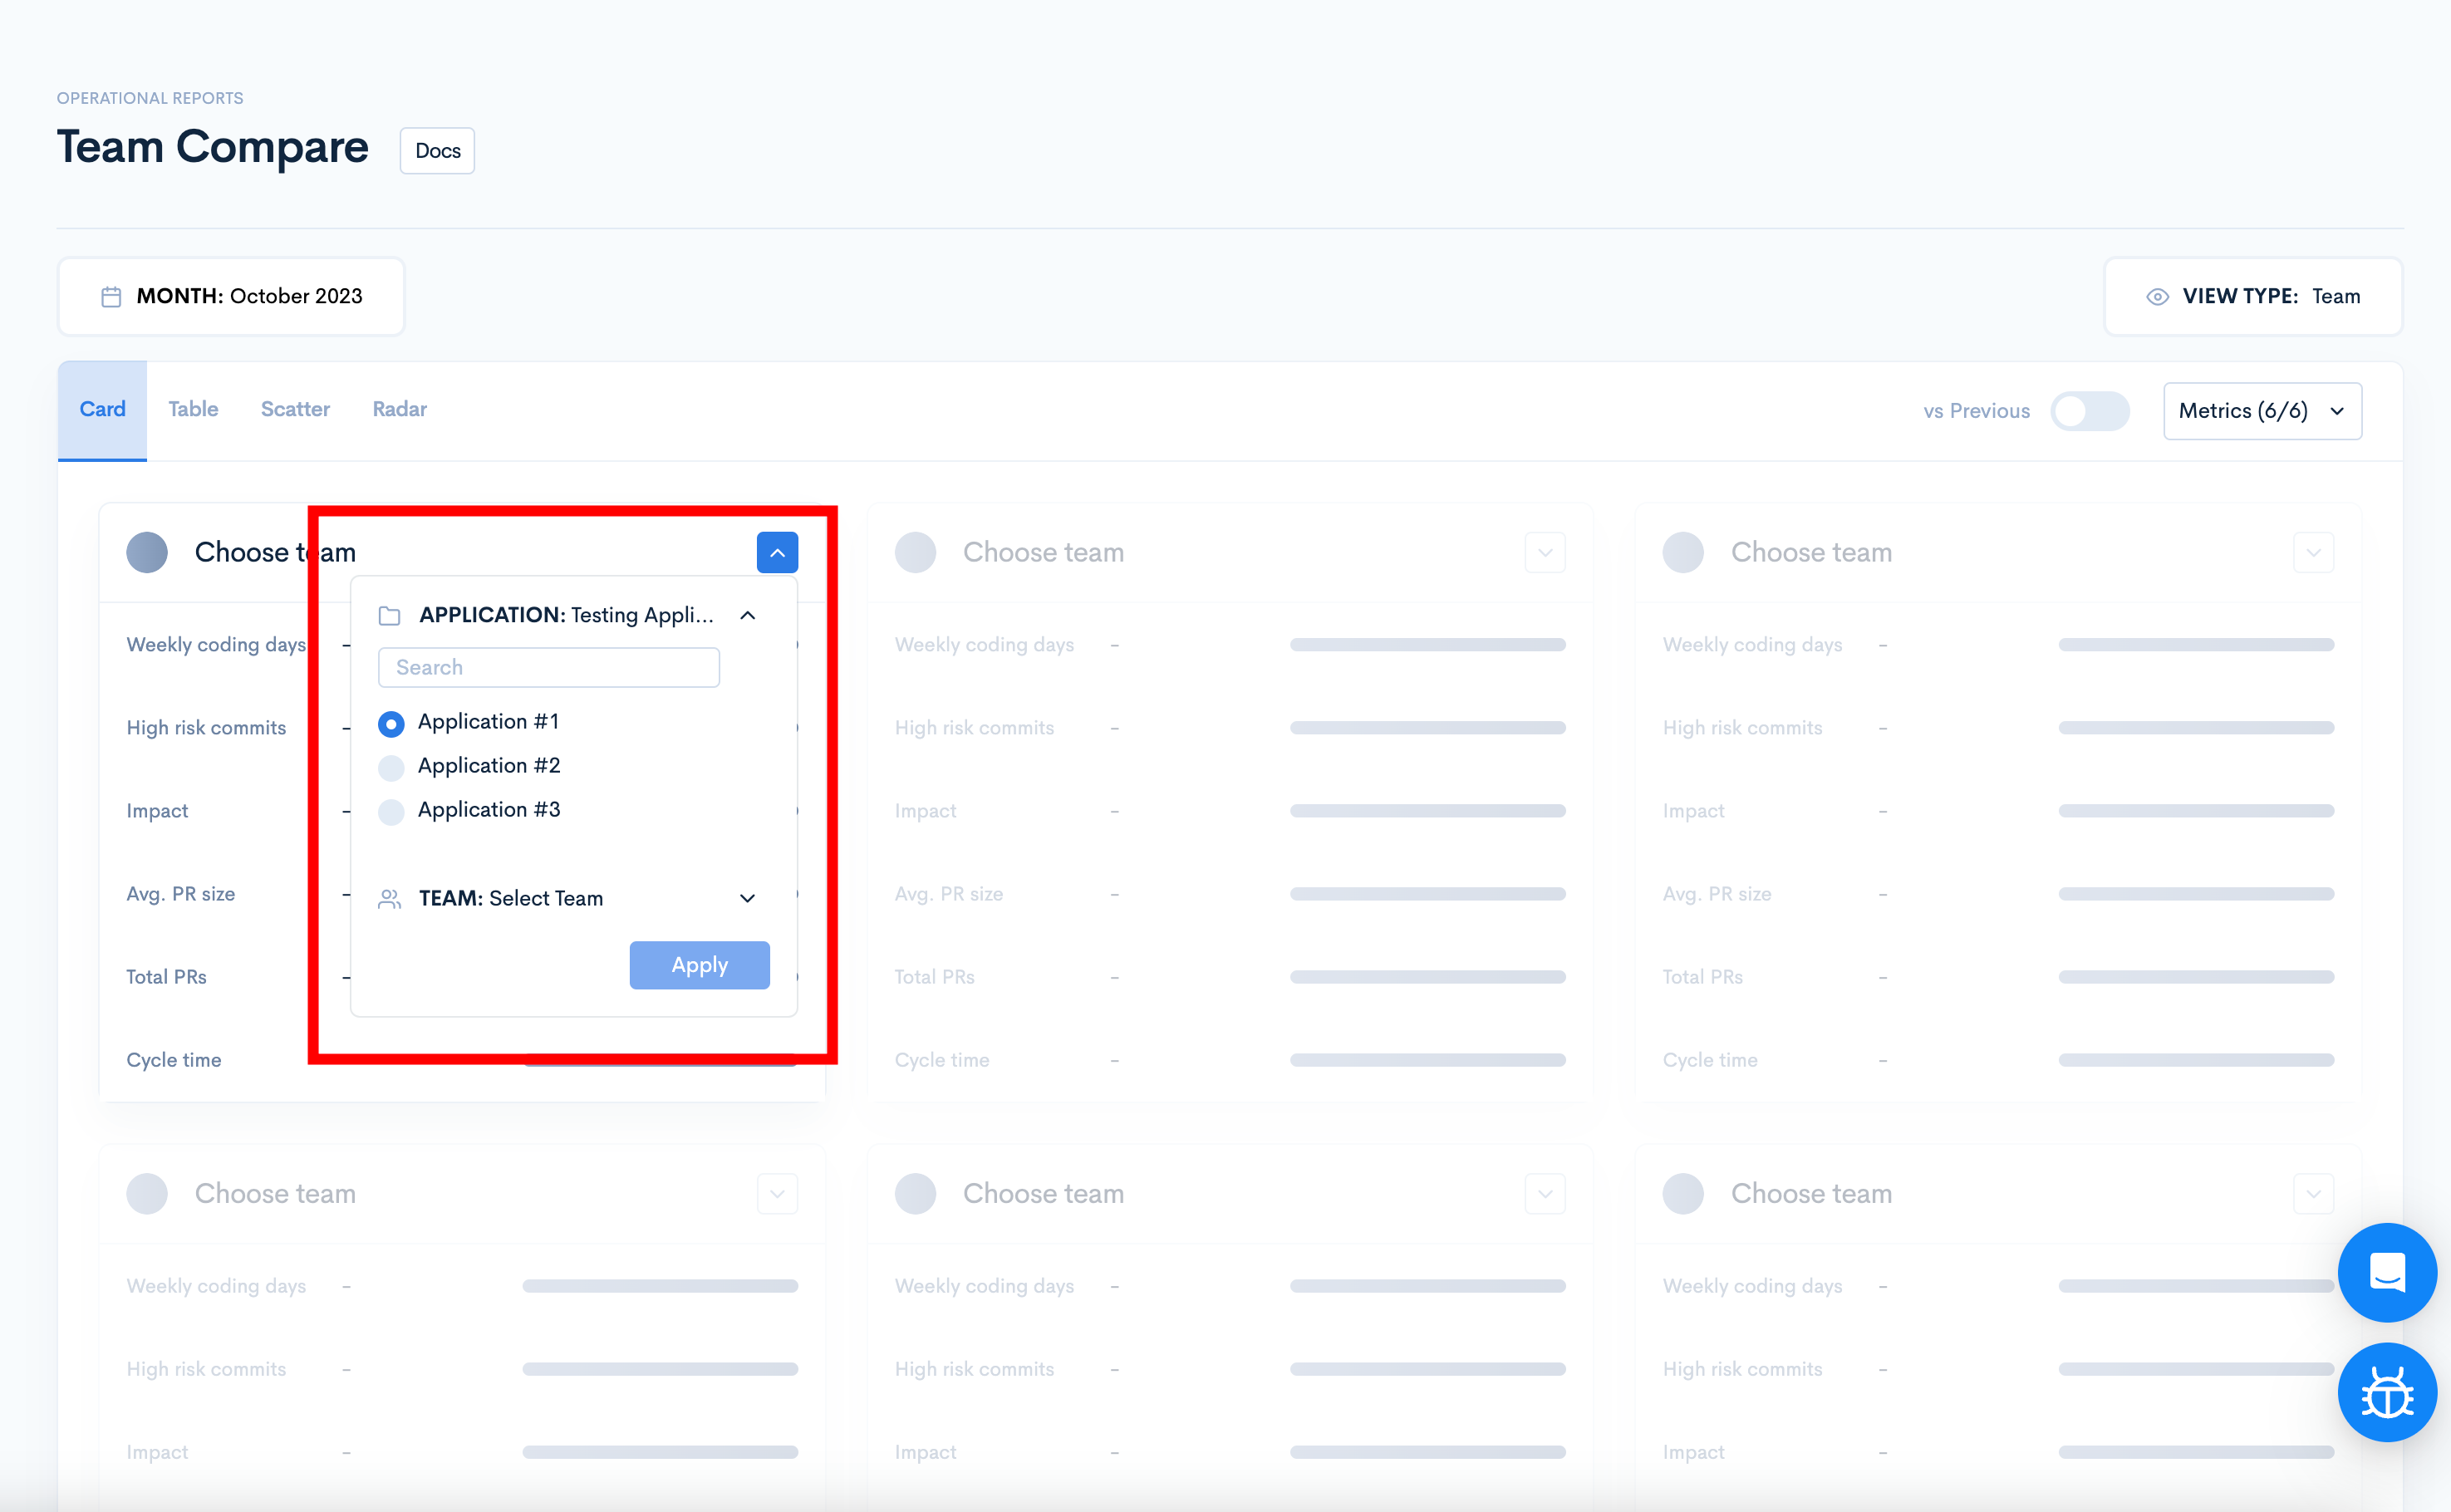
To choose teams or contributors, click the arrow button located at the upper right corner of the card and select the Application and the team. If you selected the "View by Contributor" visualization, you'll have to select the contributor too.
By clicking the "vs. Previous" toggle, you'll see the metrics compared to the last period.
Before switching on the toggle, you will only see the blue bars. For the team with the highest value for that metric, the blue bar will be full, and that will be the reference.
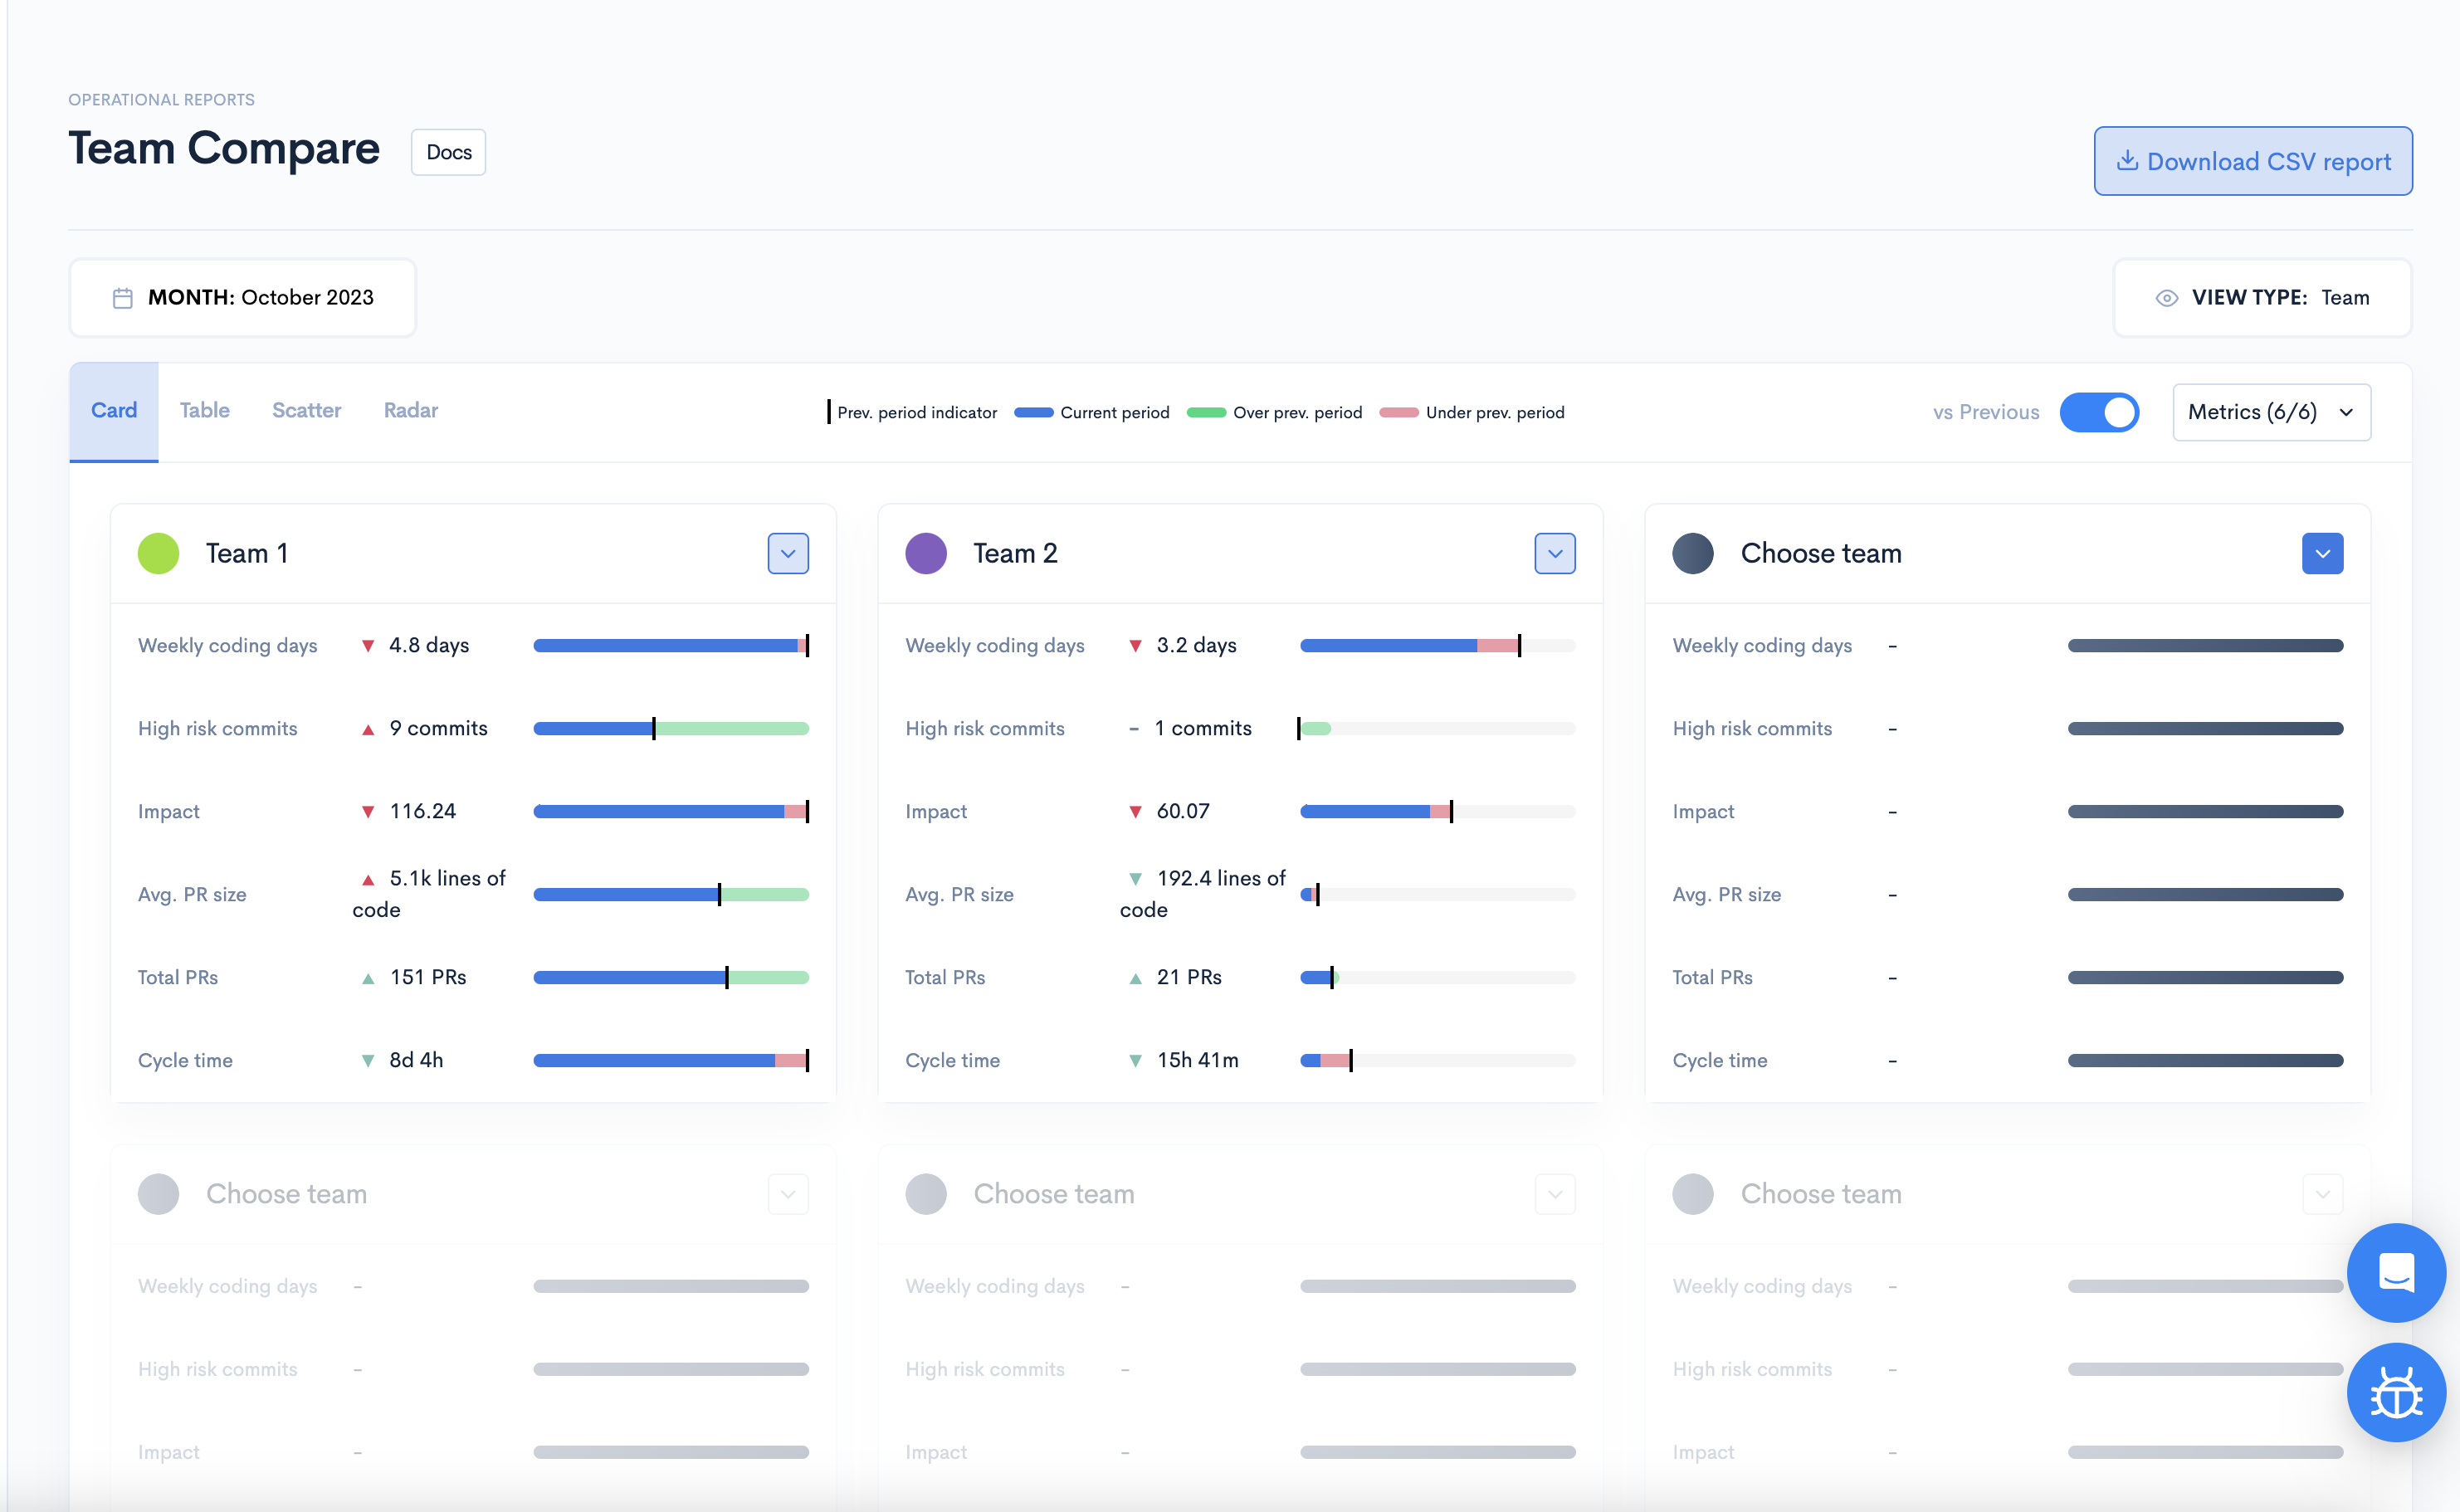
The blue bars are the current value. The green portions are if the value is over the previous period. The red shows that the value is under the previous period.
You can change the metrics that are shown from the upper right-hand side dropdown. You can select up to 6 metrics.
Table
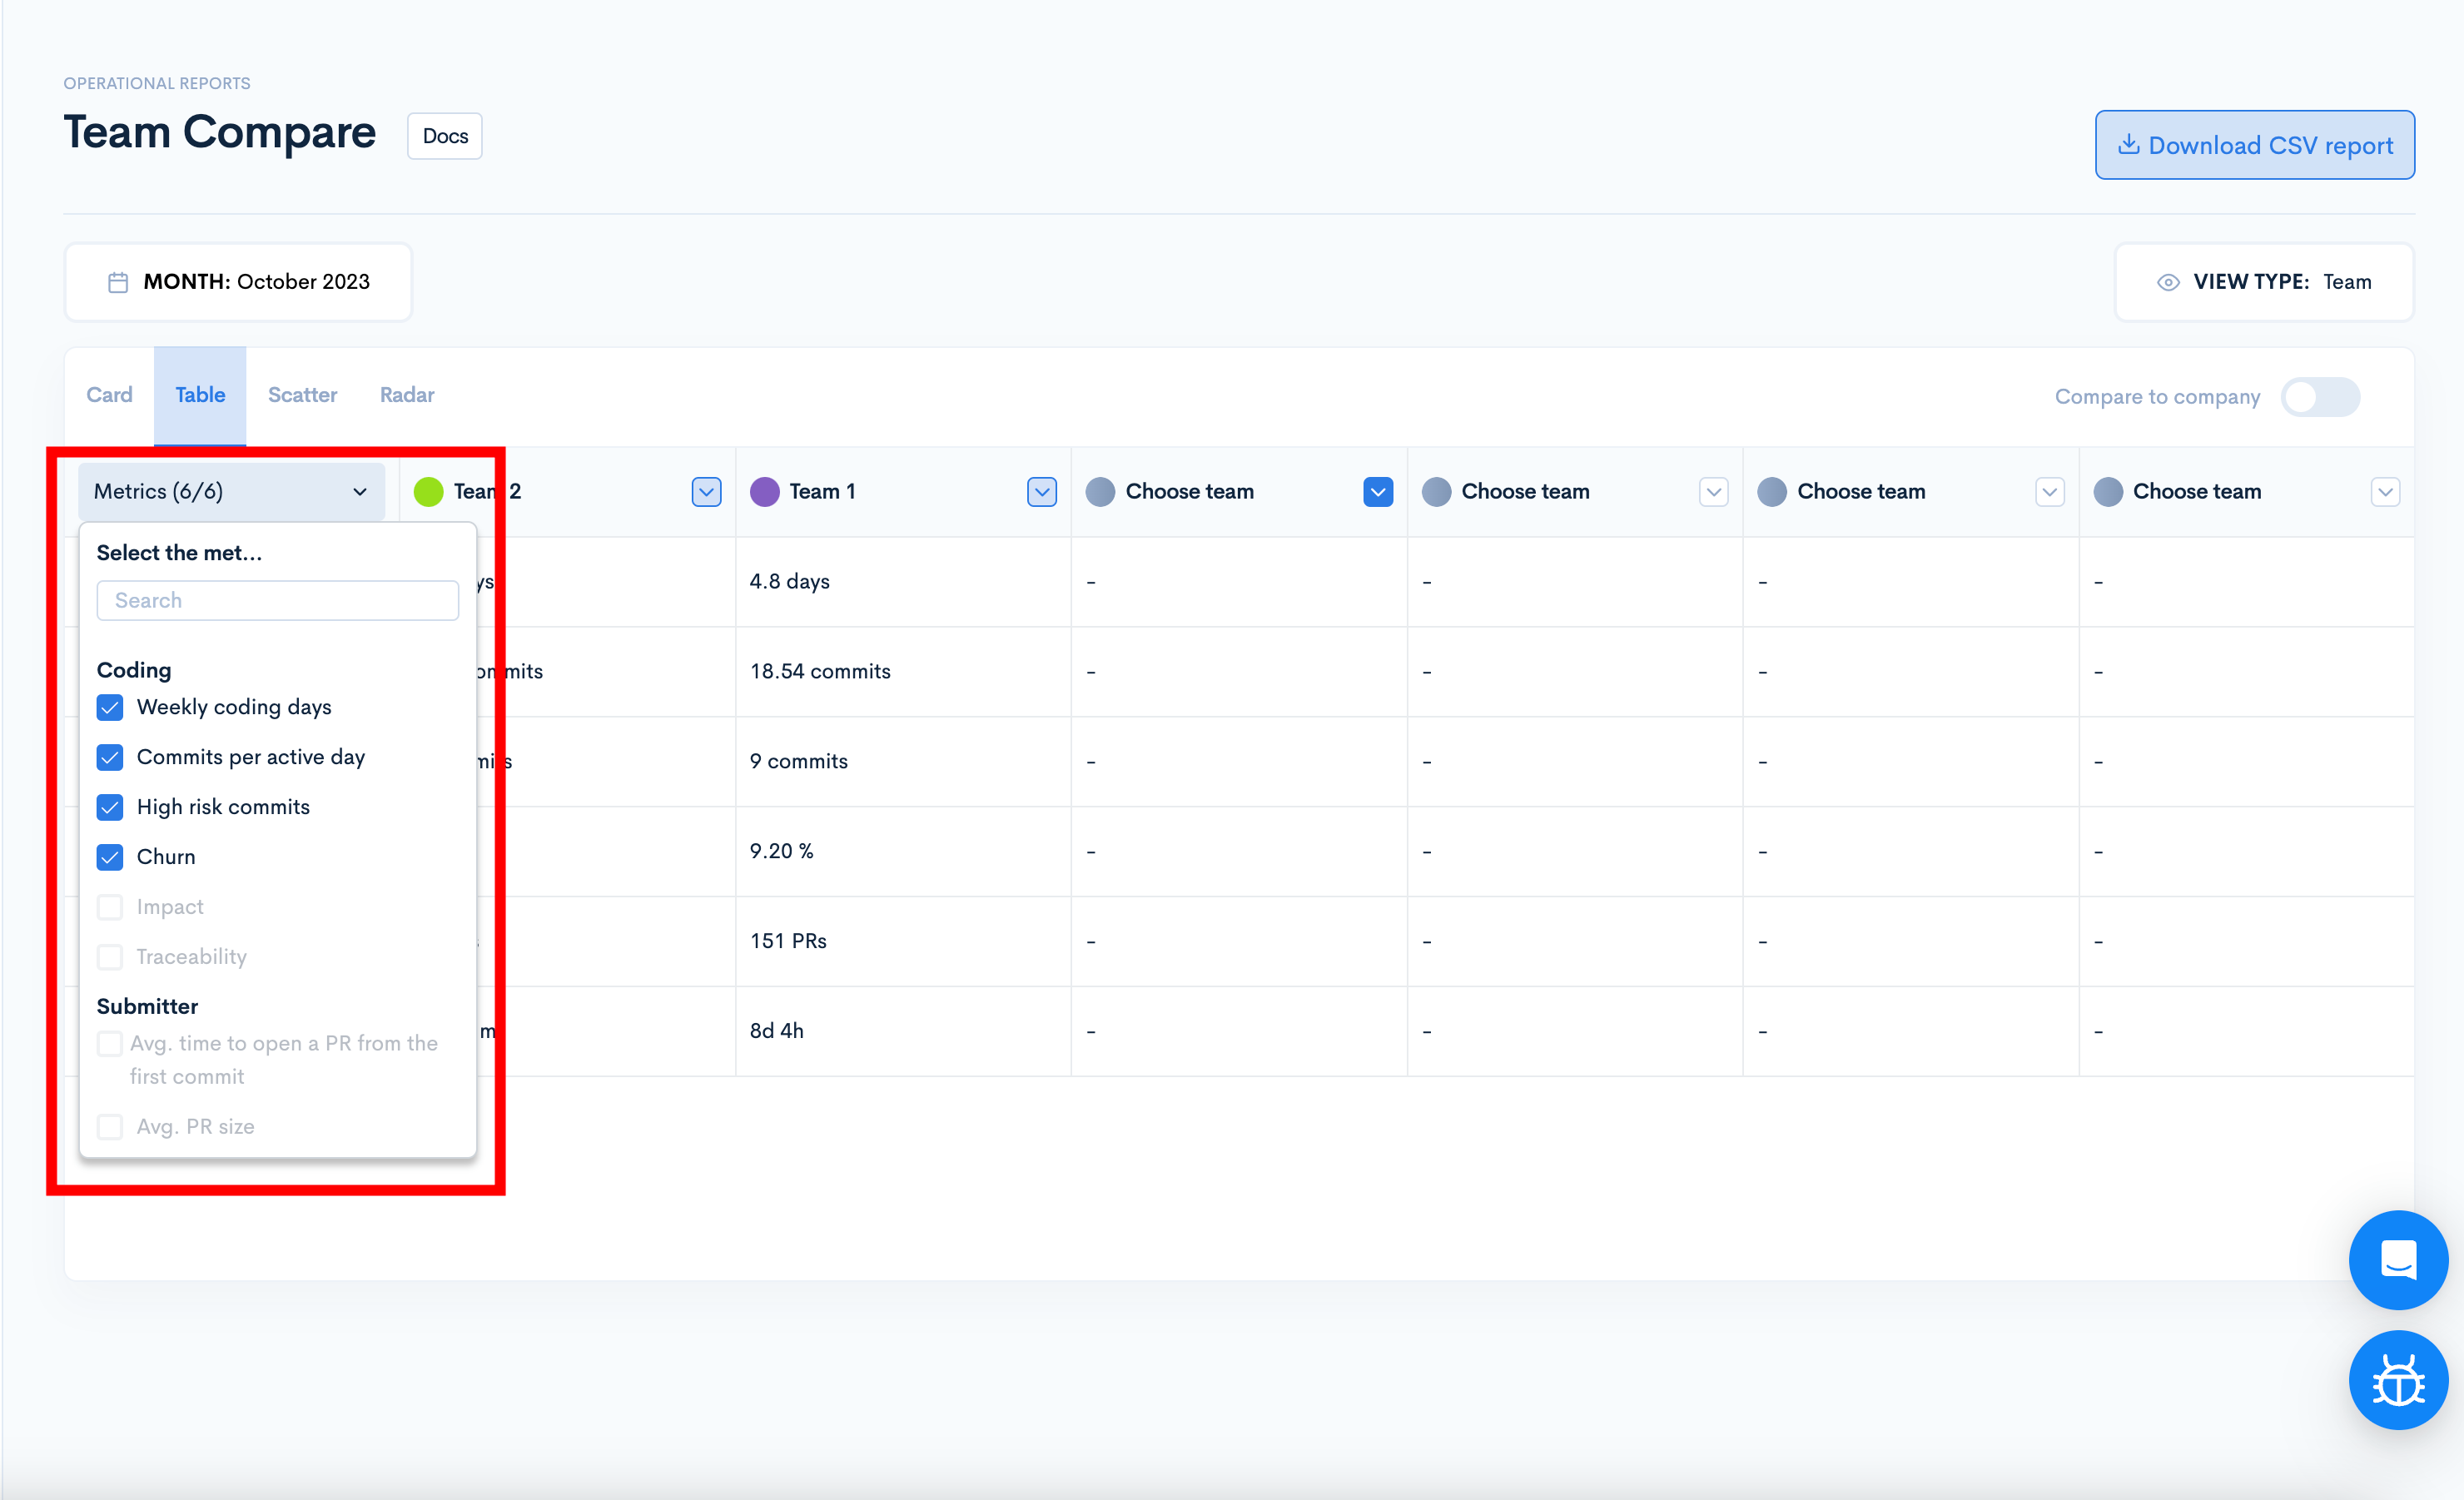
The table visualization offers a detailed view of metrics in a well-organized table format.
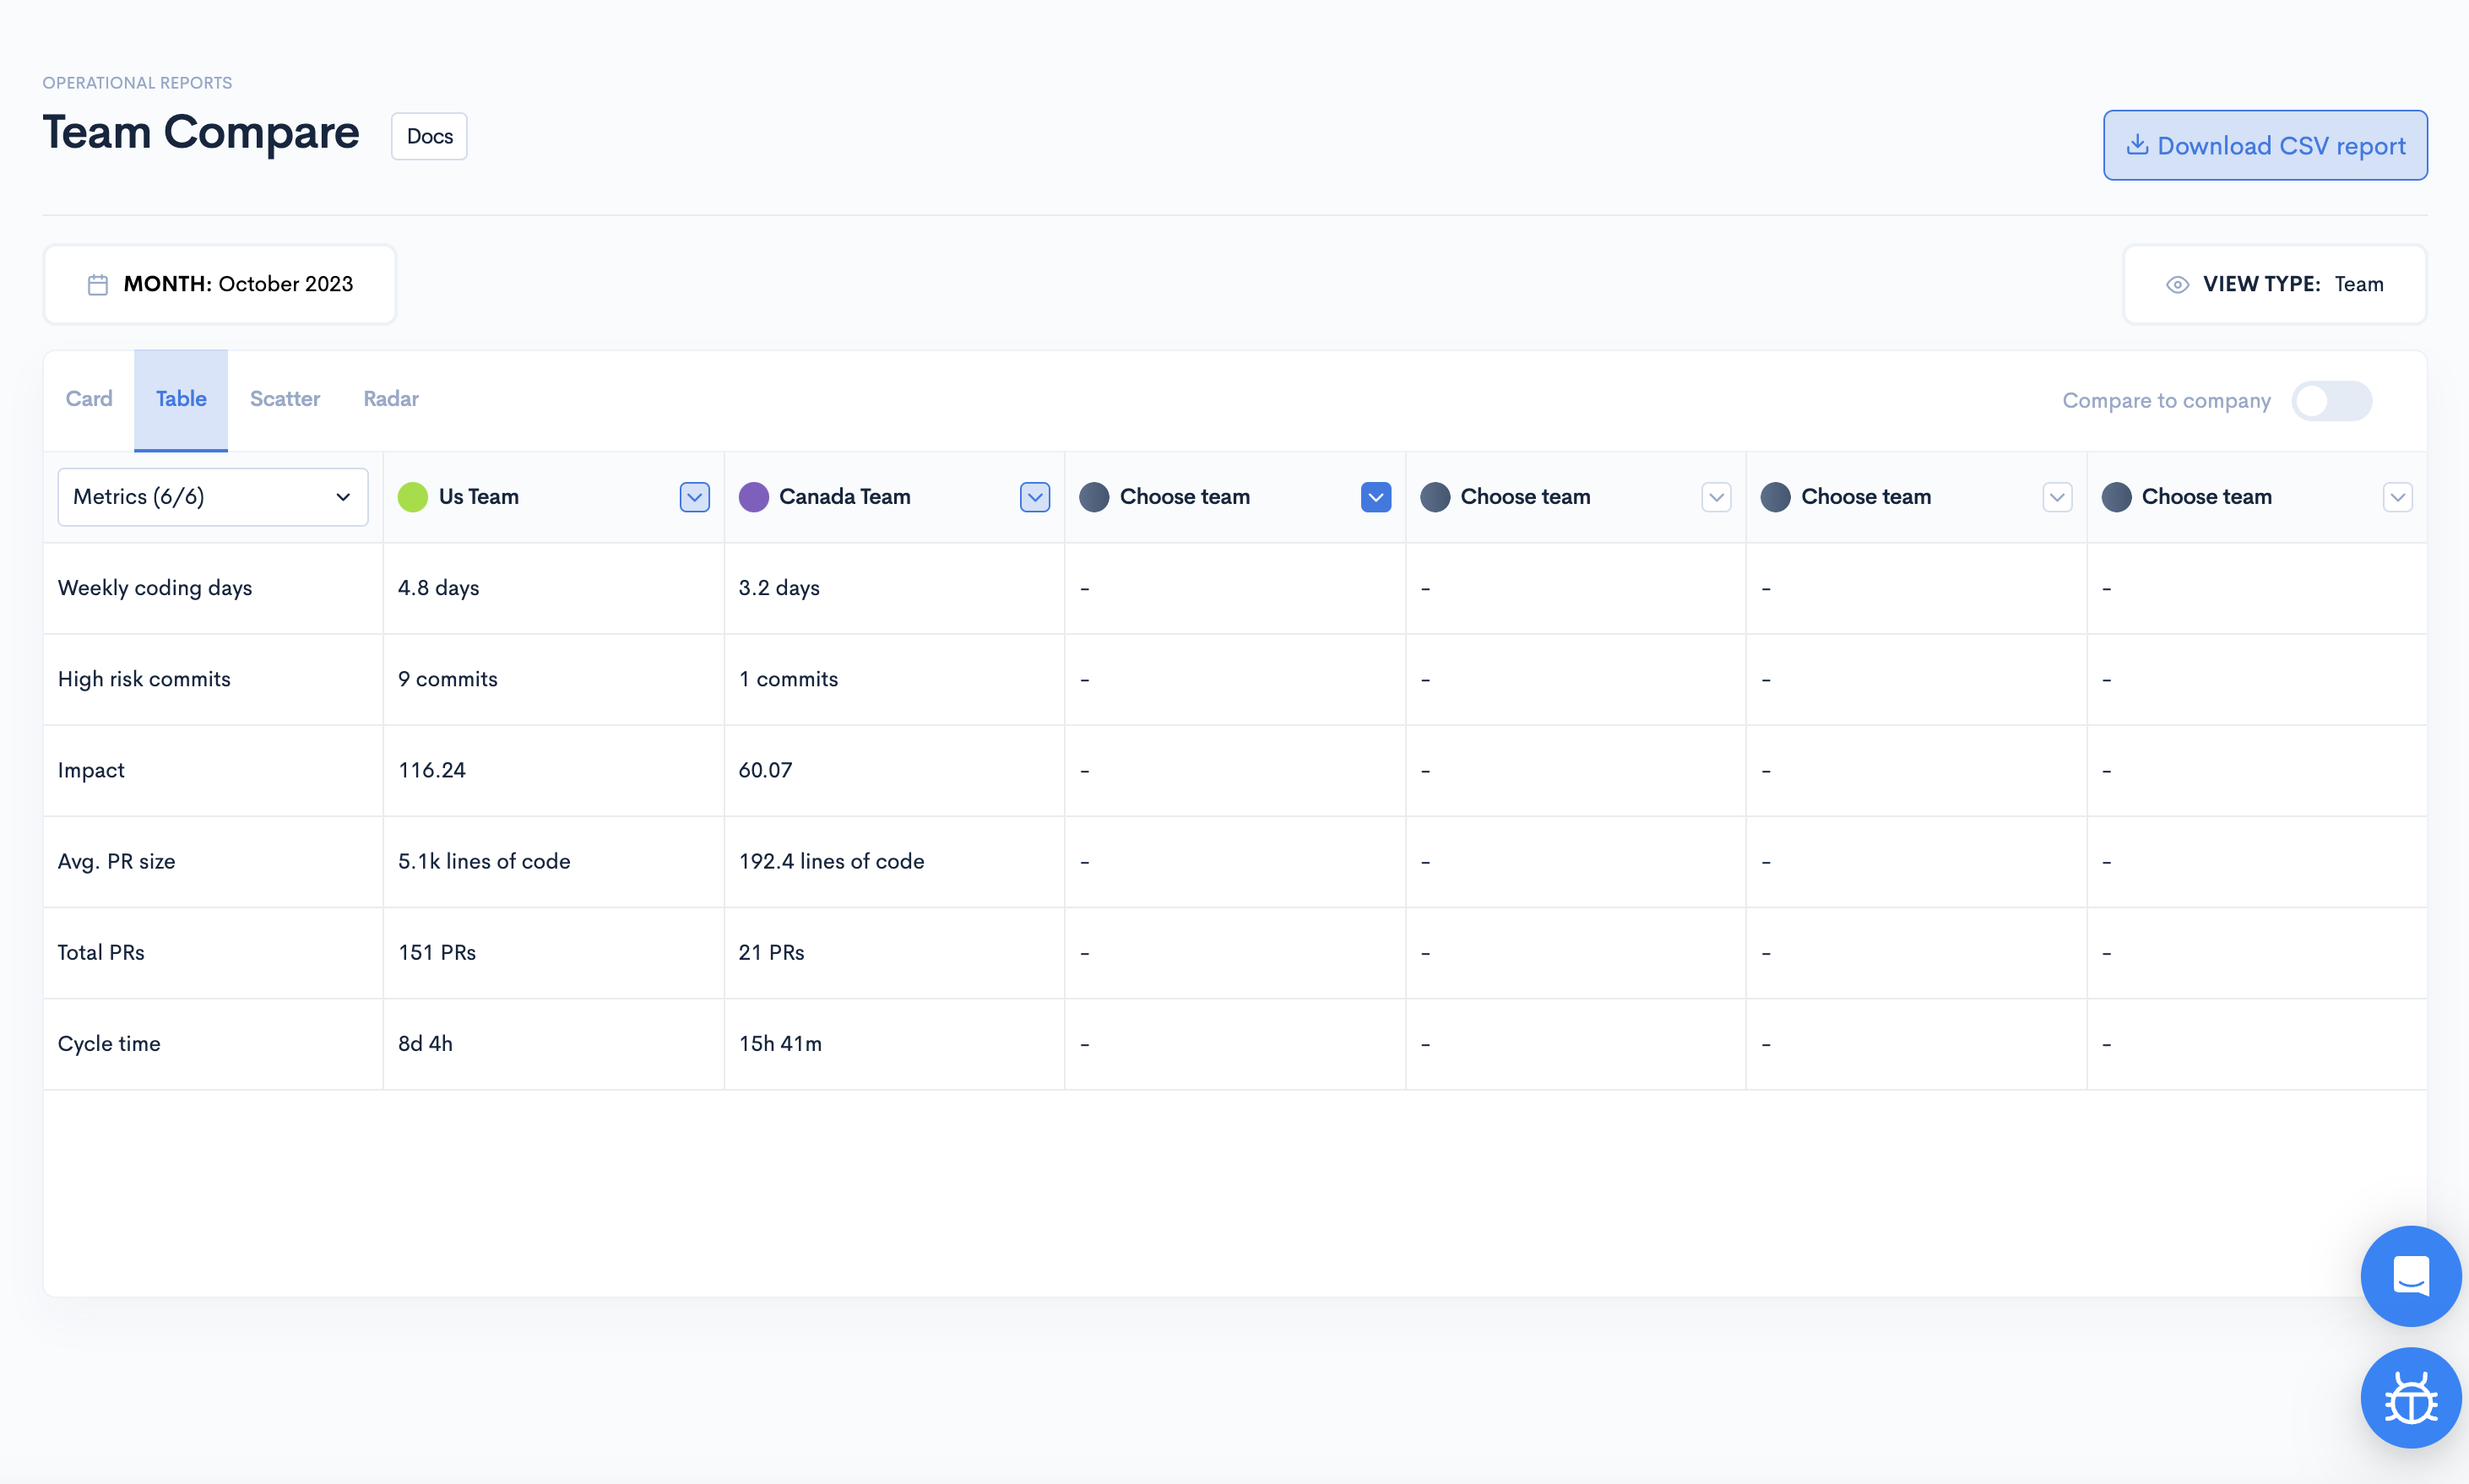
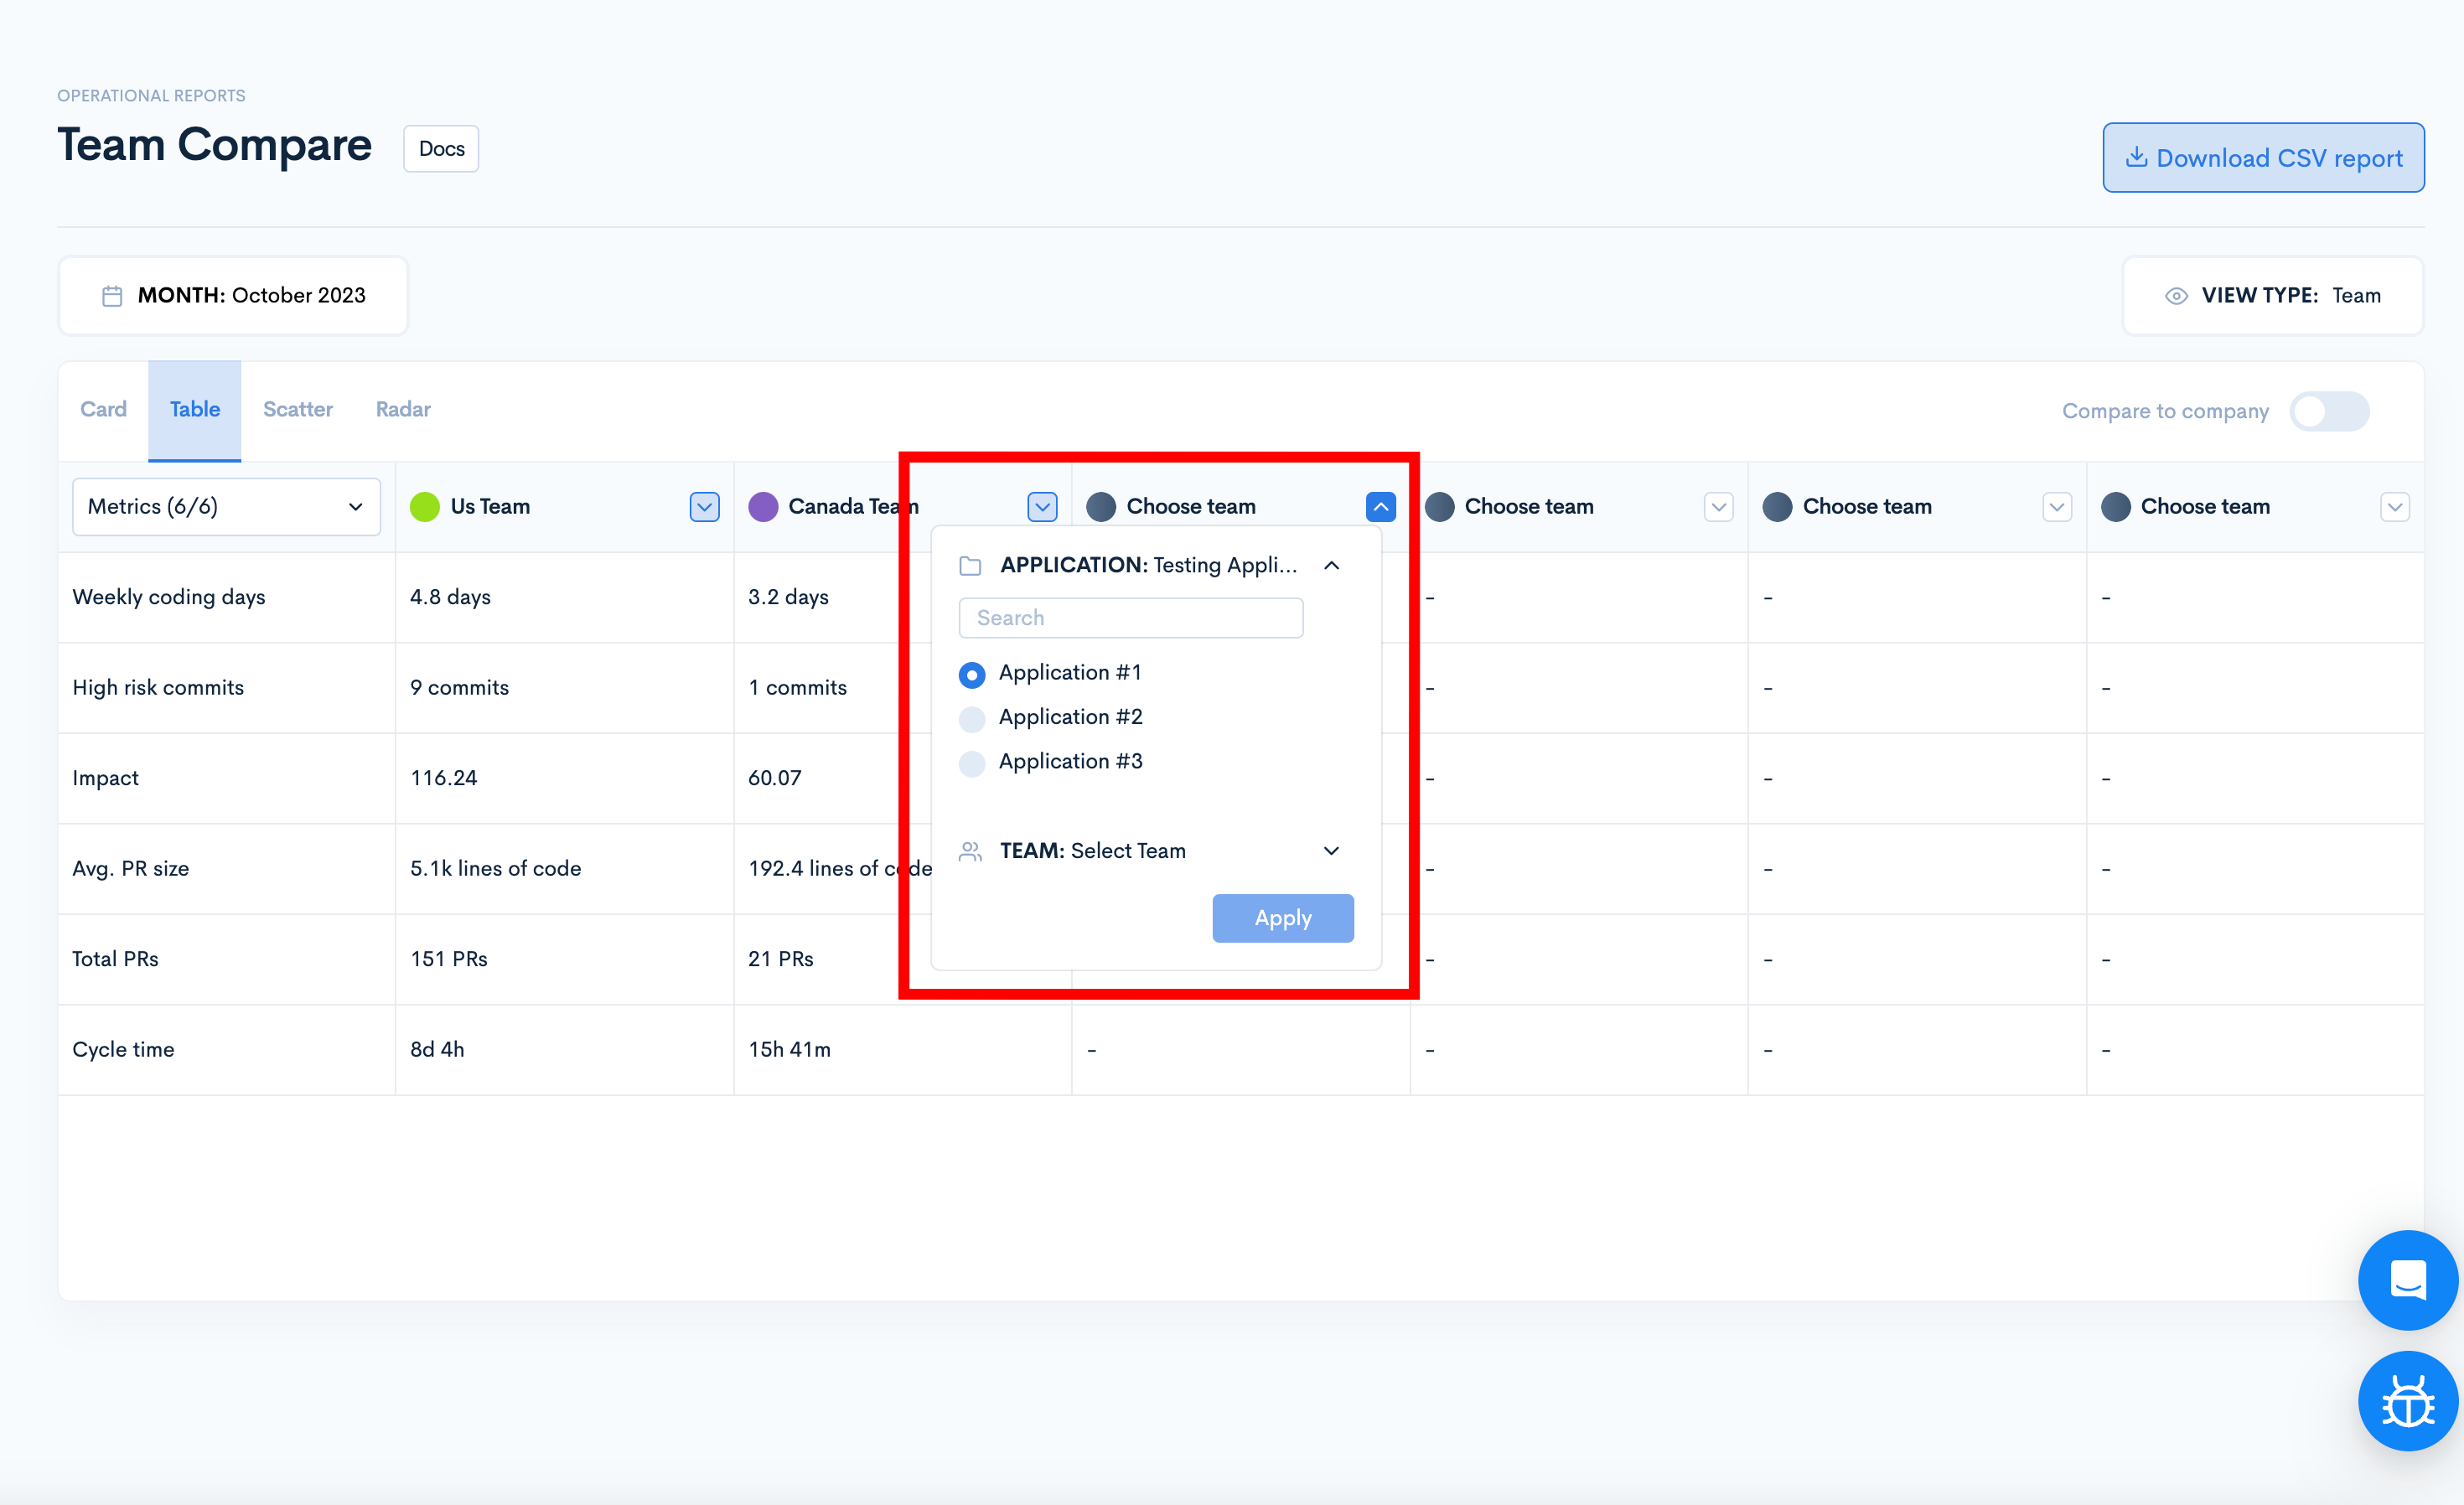
To choose new teams, simply click the arrow button located at the top of each column.
By switching the toggle for "Compare to company", you'll view the team's performance relative to the company average in a color-coded way, according to the percentile. If the metric is positive and the team/contributor has a better value than the average, the color will be green. If the metrics are under team average, the color will be red.
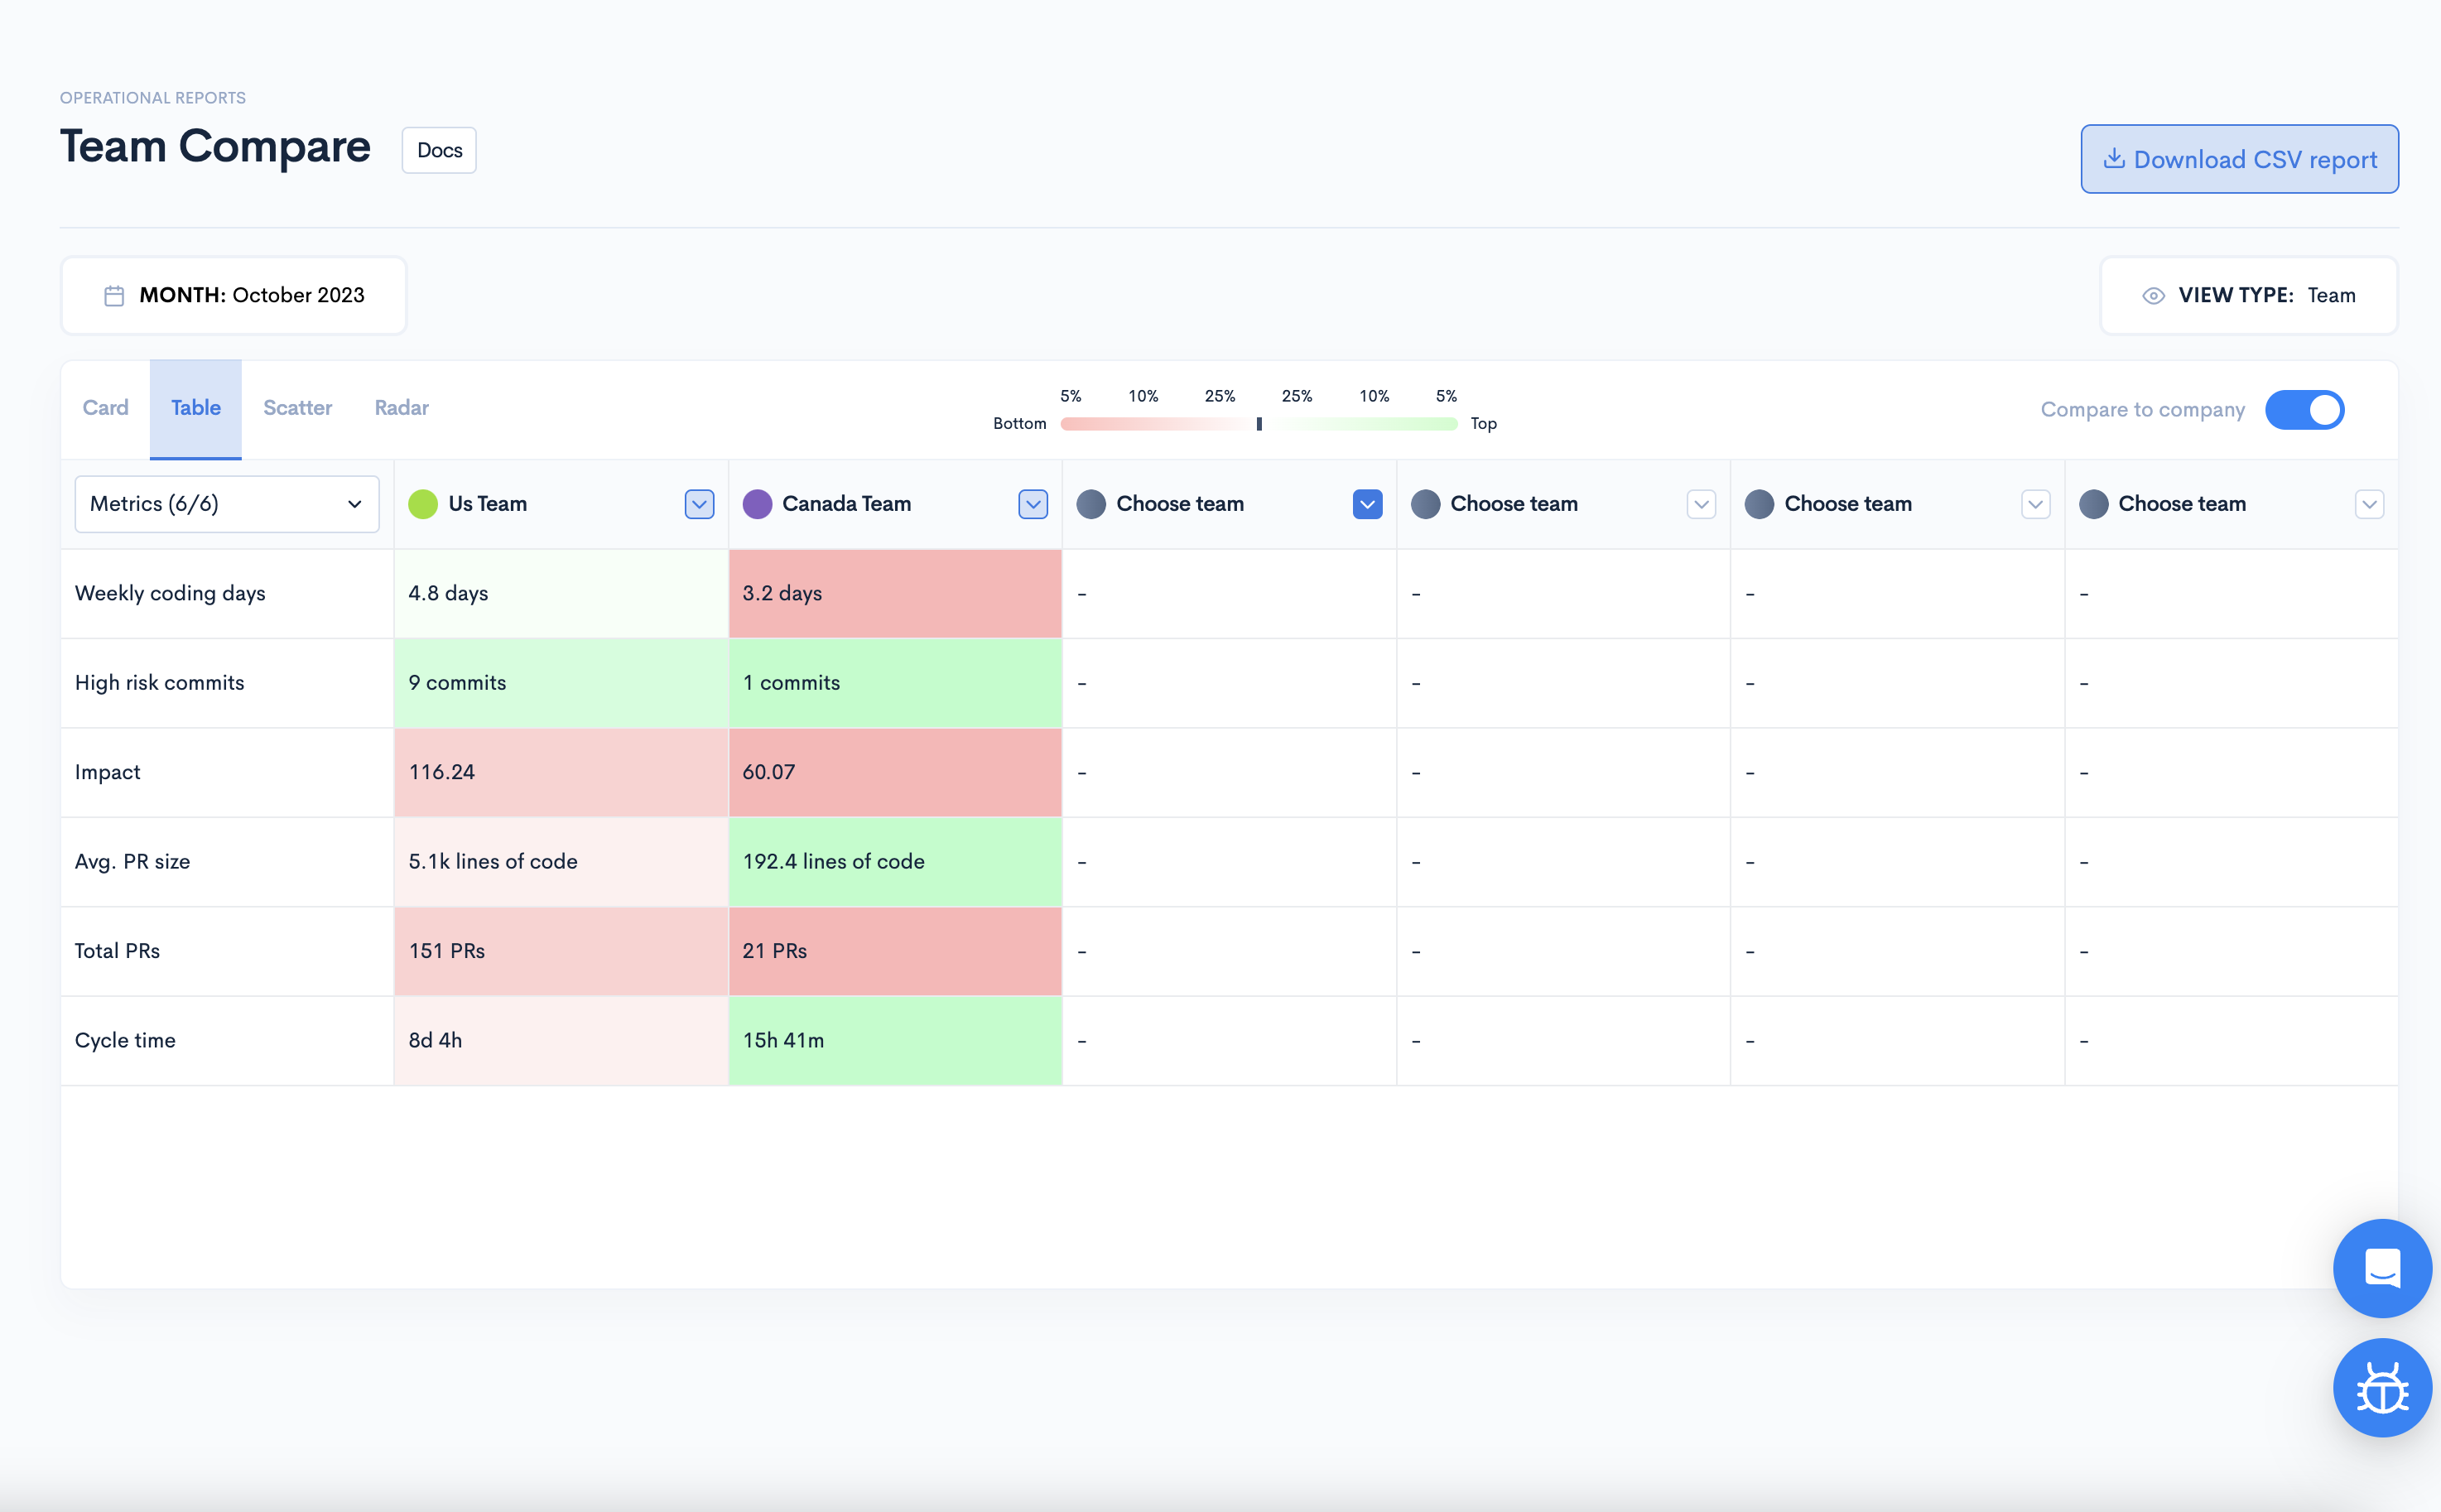
Change the metrics from the top of the metrics column. You can select up to 6 metrics.
Scatter
Our scatter feature visualizes and compares two variables for a dataset, offering a clear, graphical representation of team or contributor performance metrics.
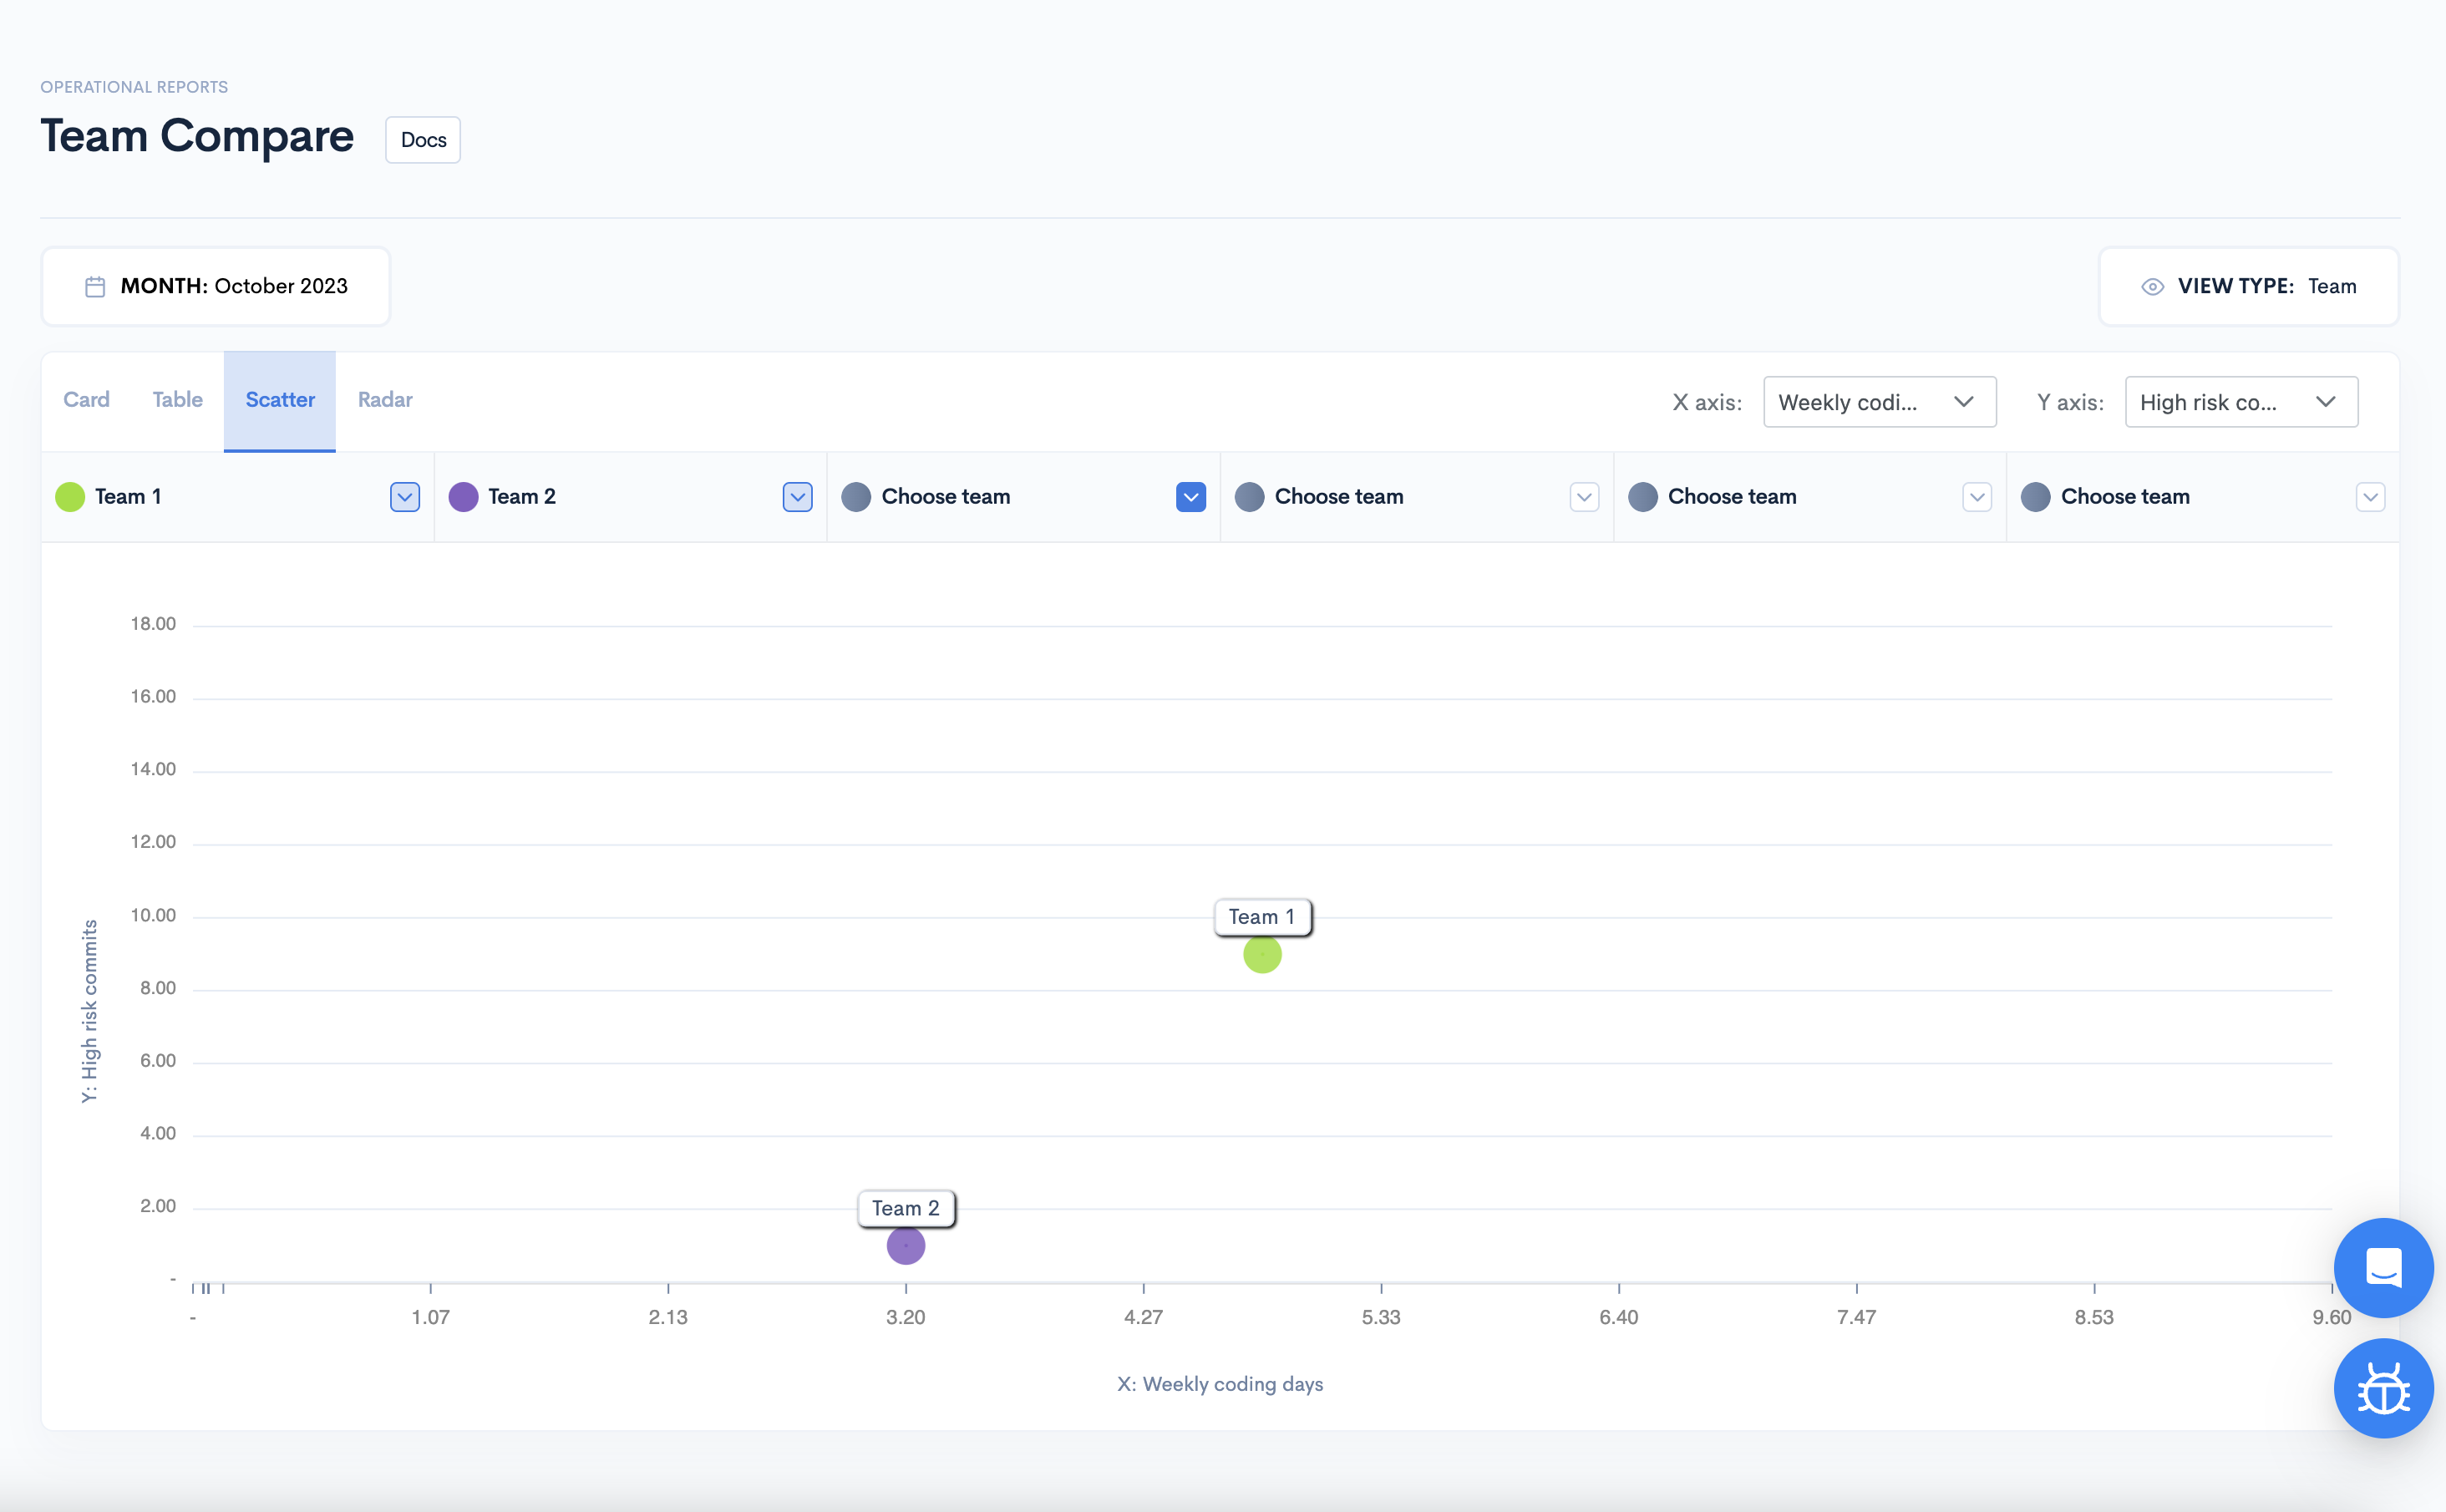
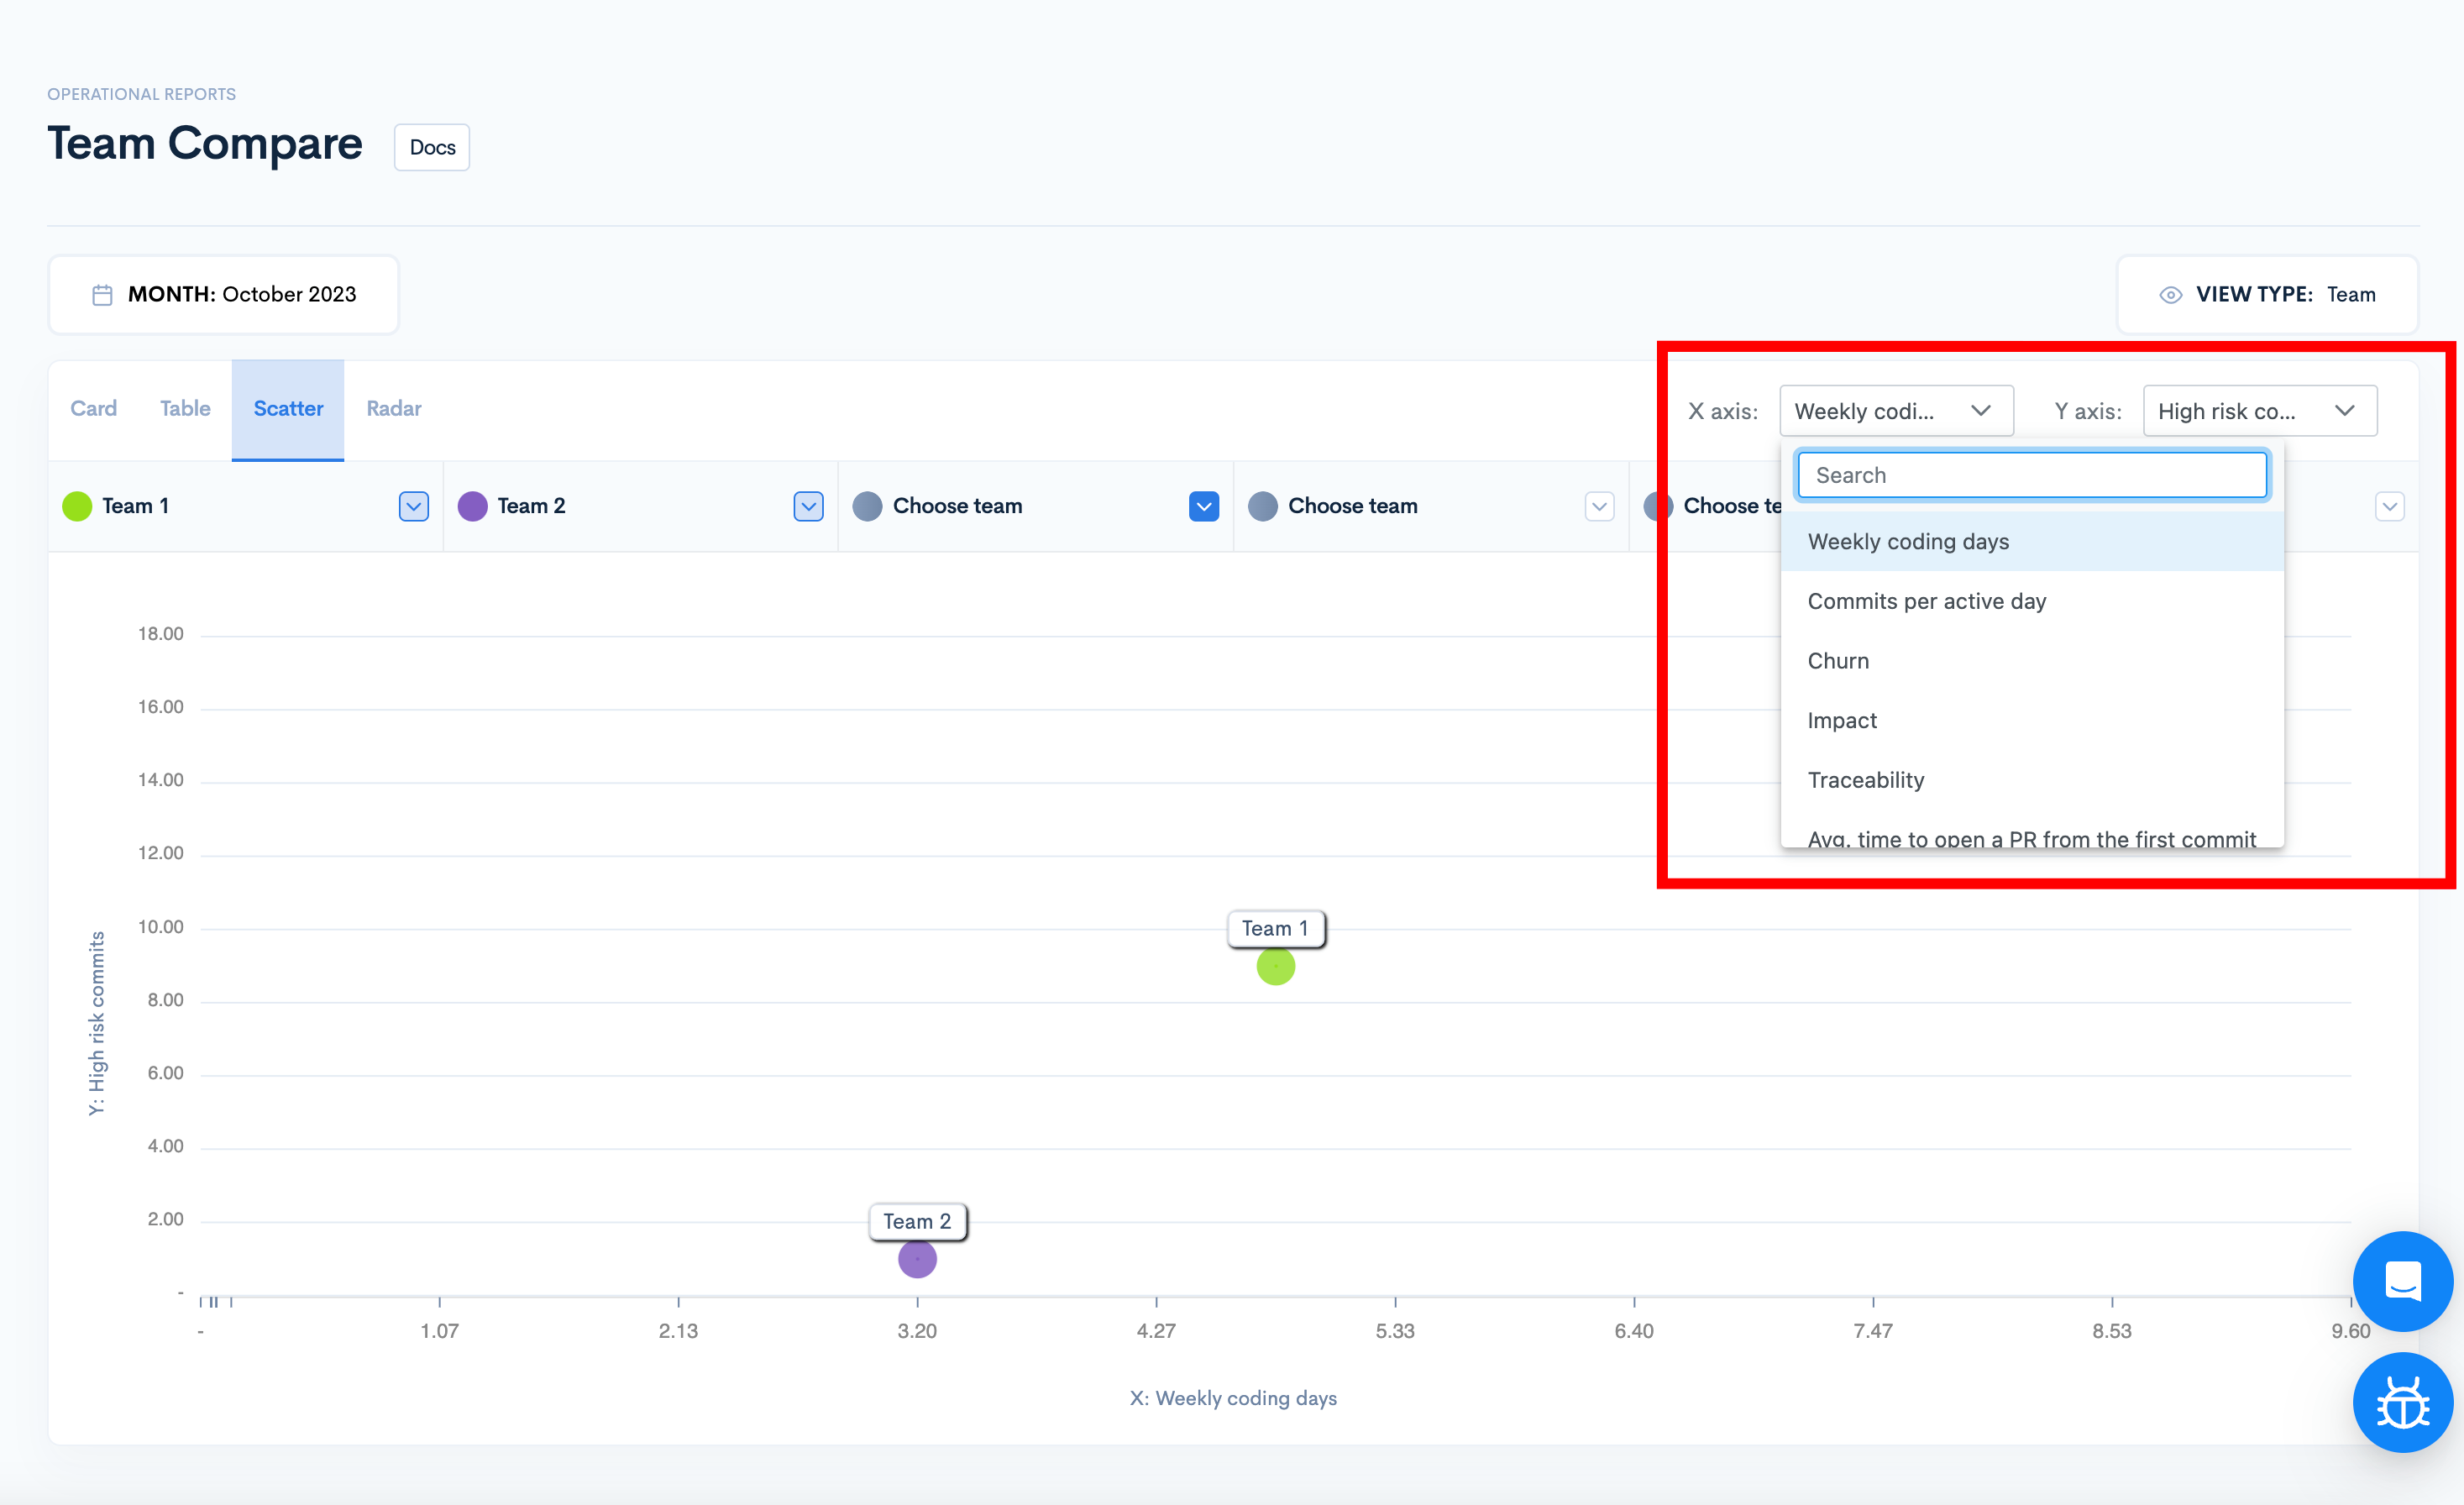
Select the metrics for both axes in the upper right side of the scatter.
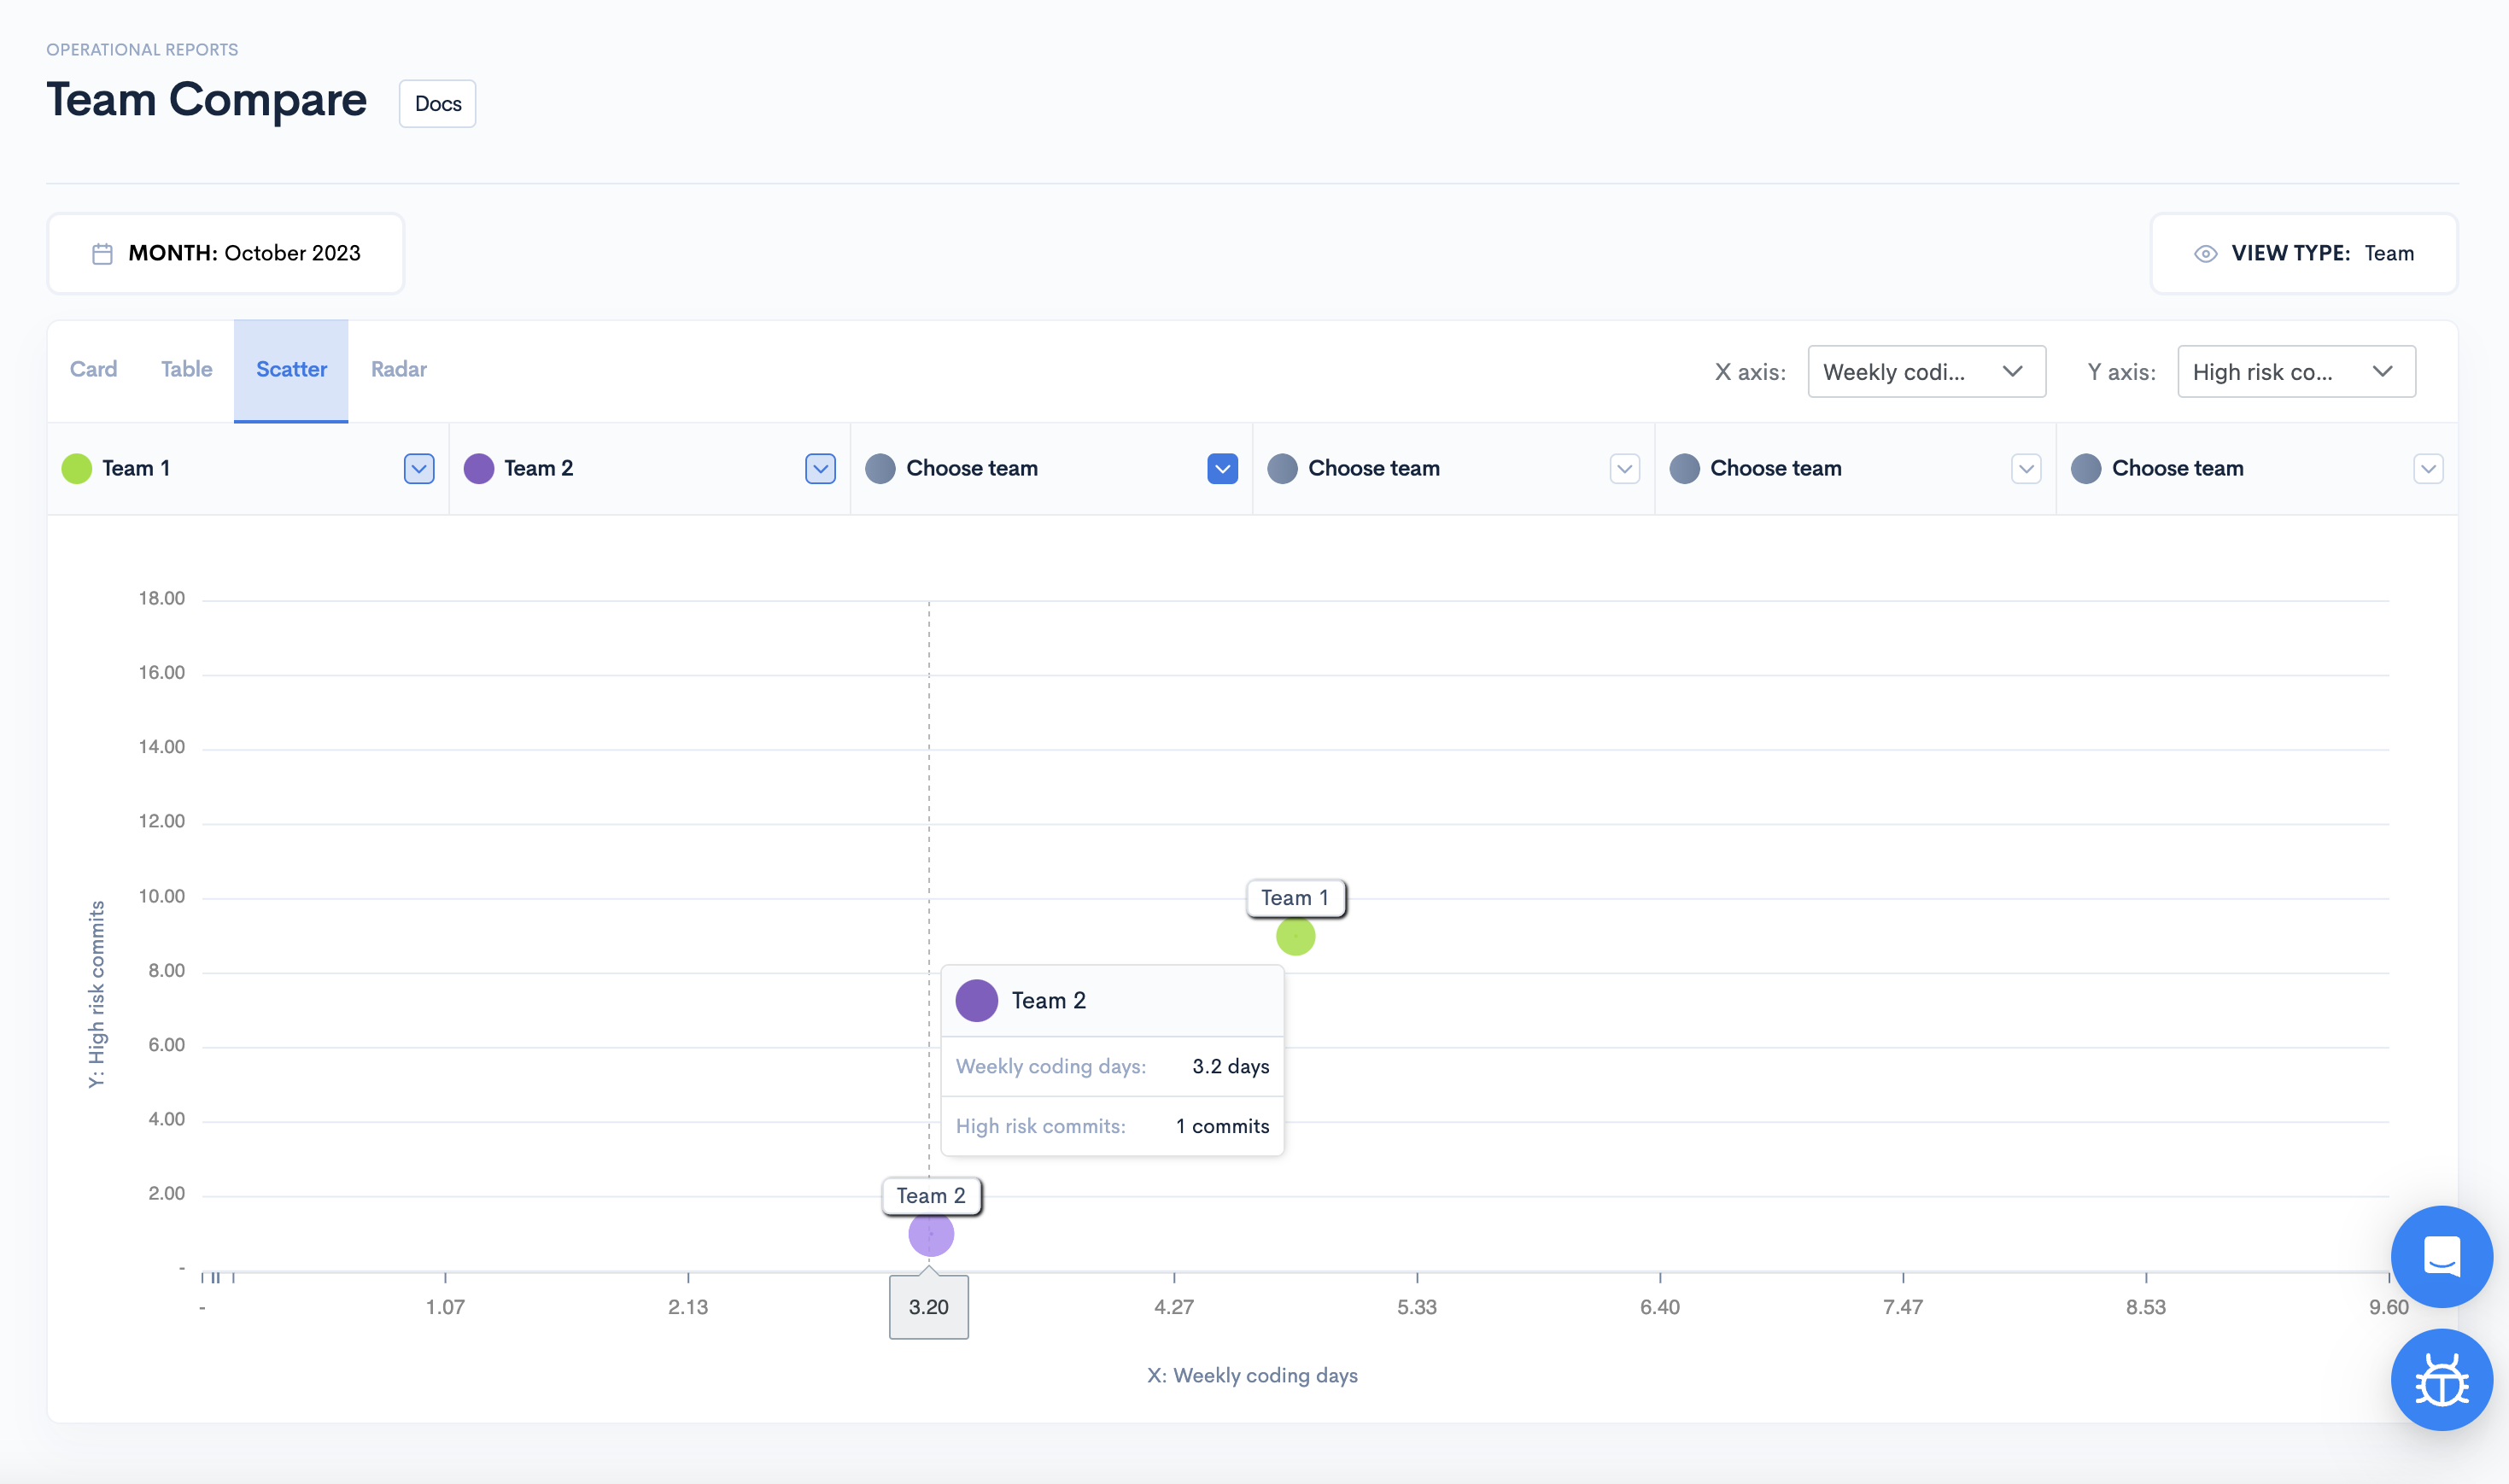
Hover over each team to see how the selected metrics look.
Radar
See a radar representation of the selected teams and selected metrics.
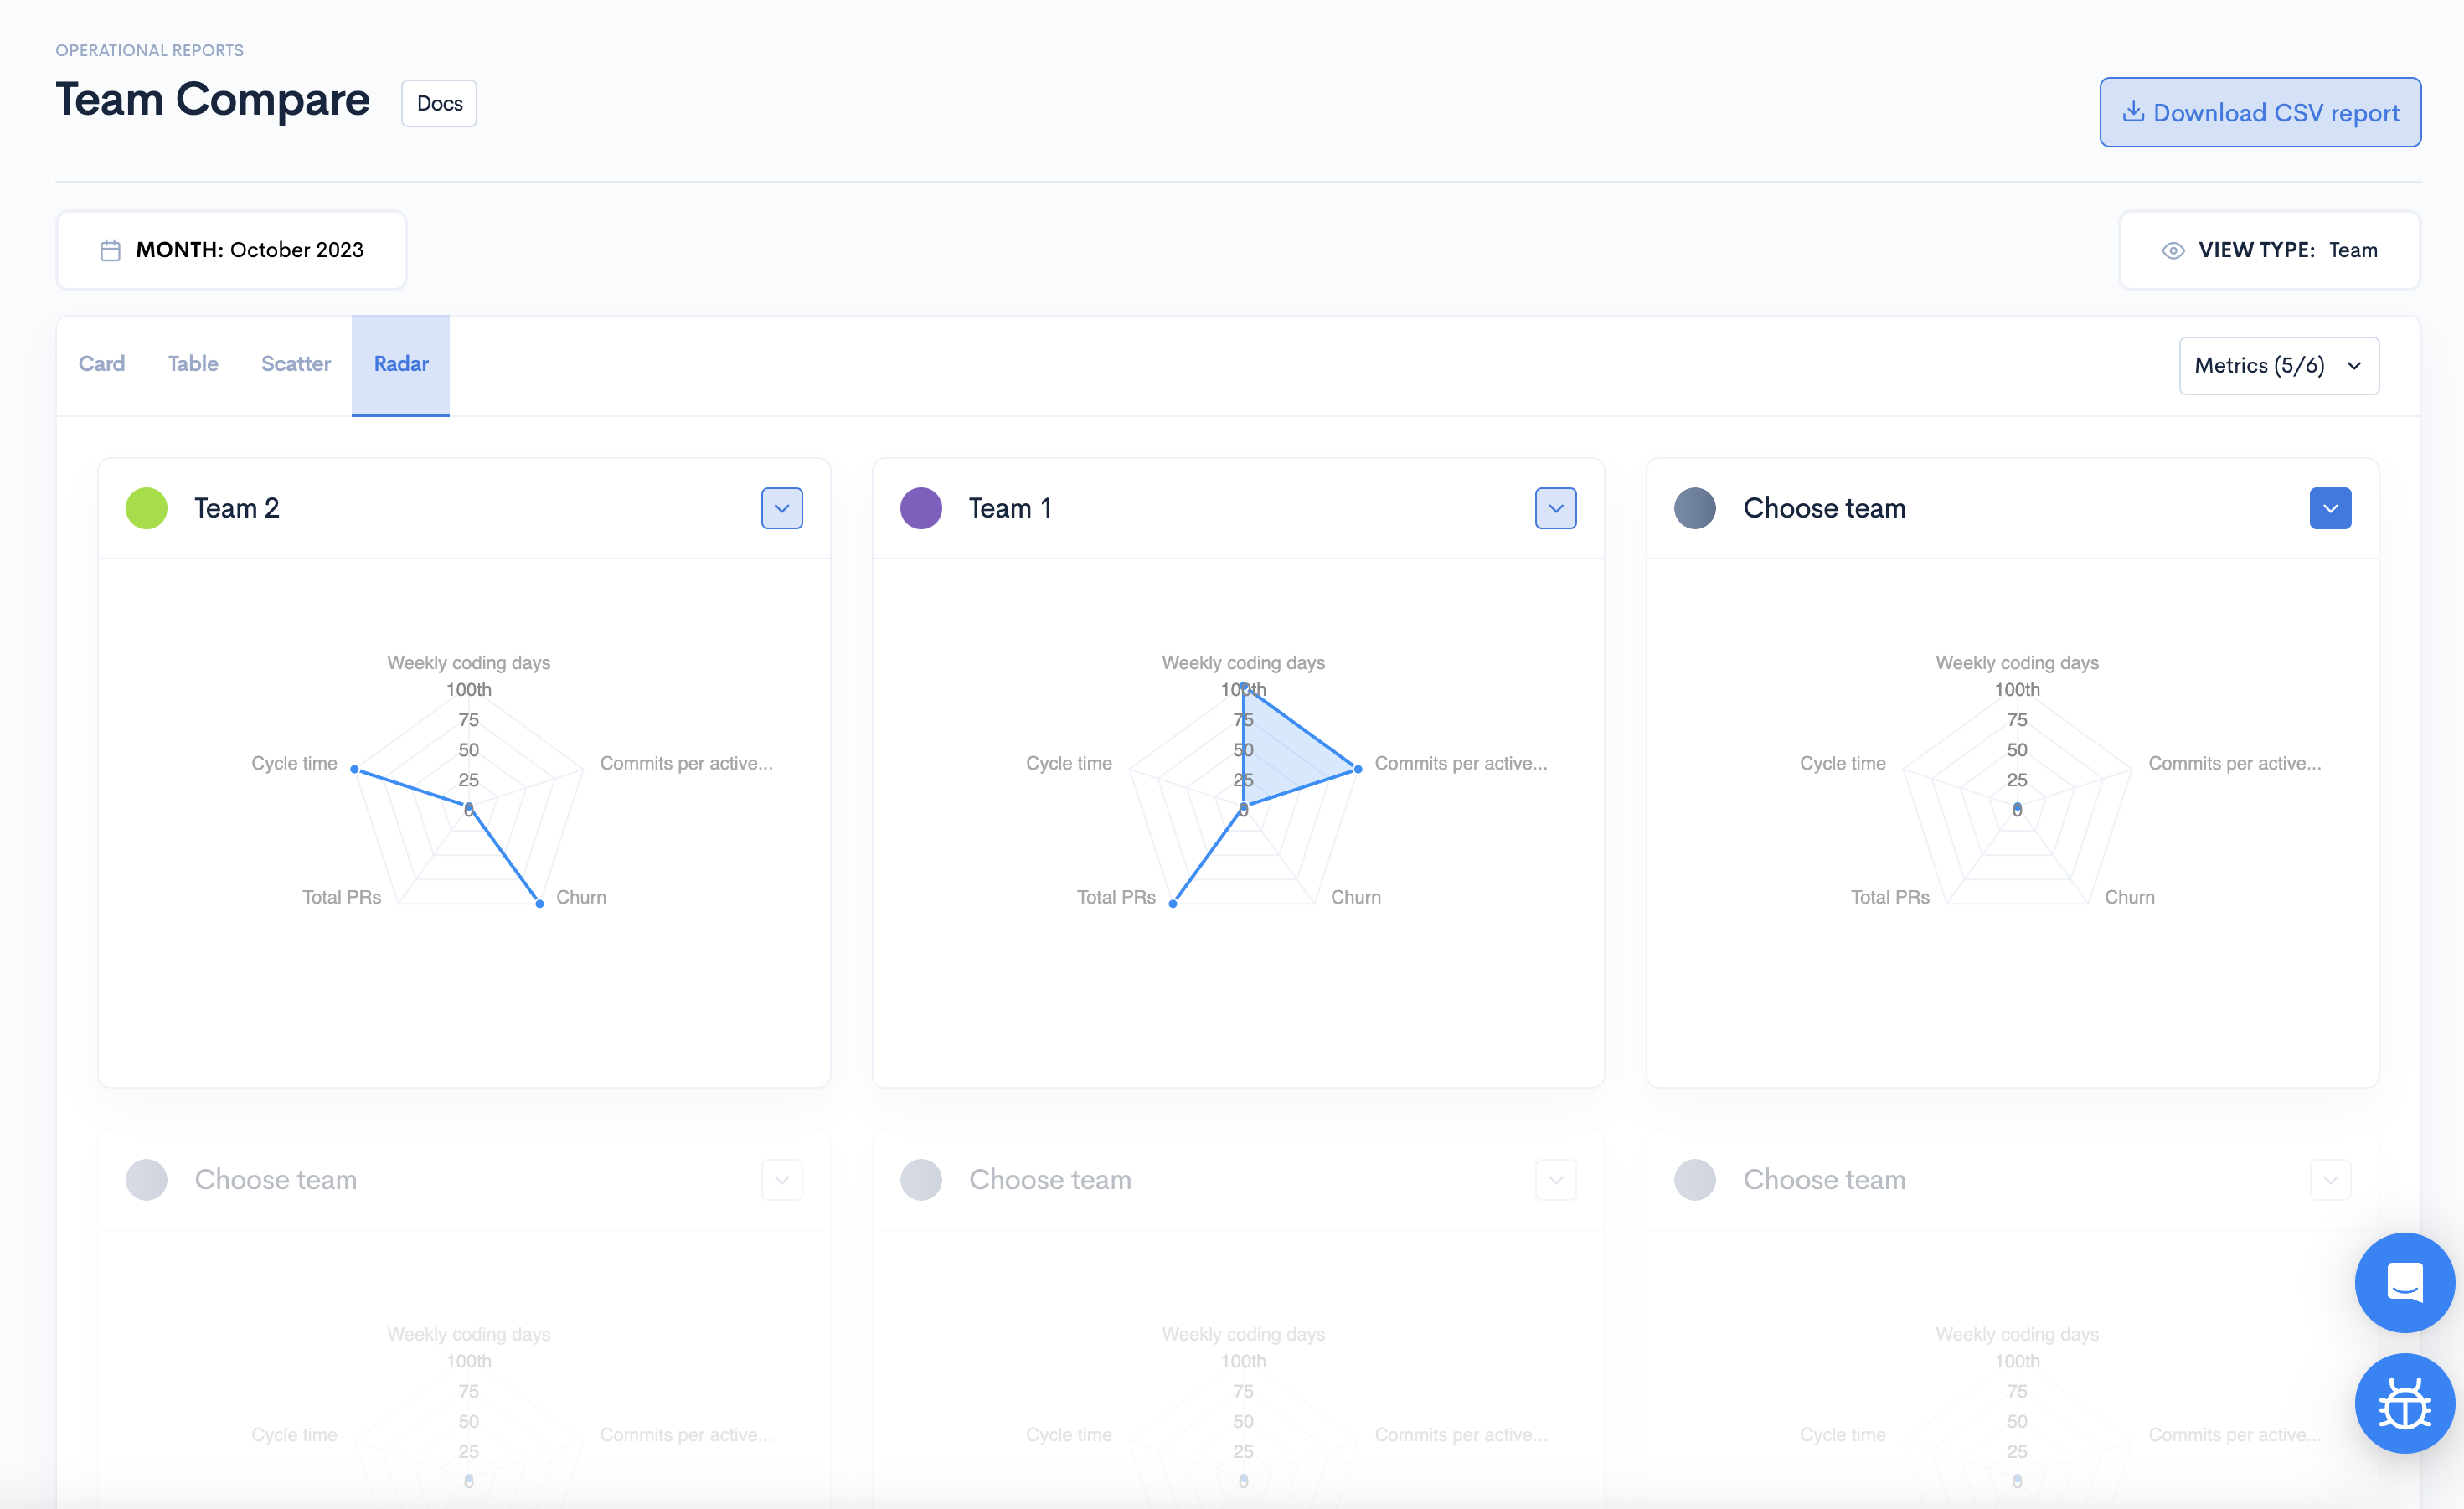
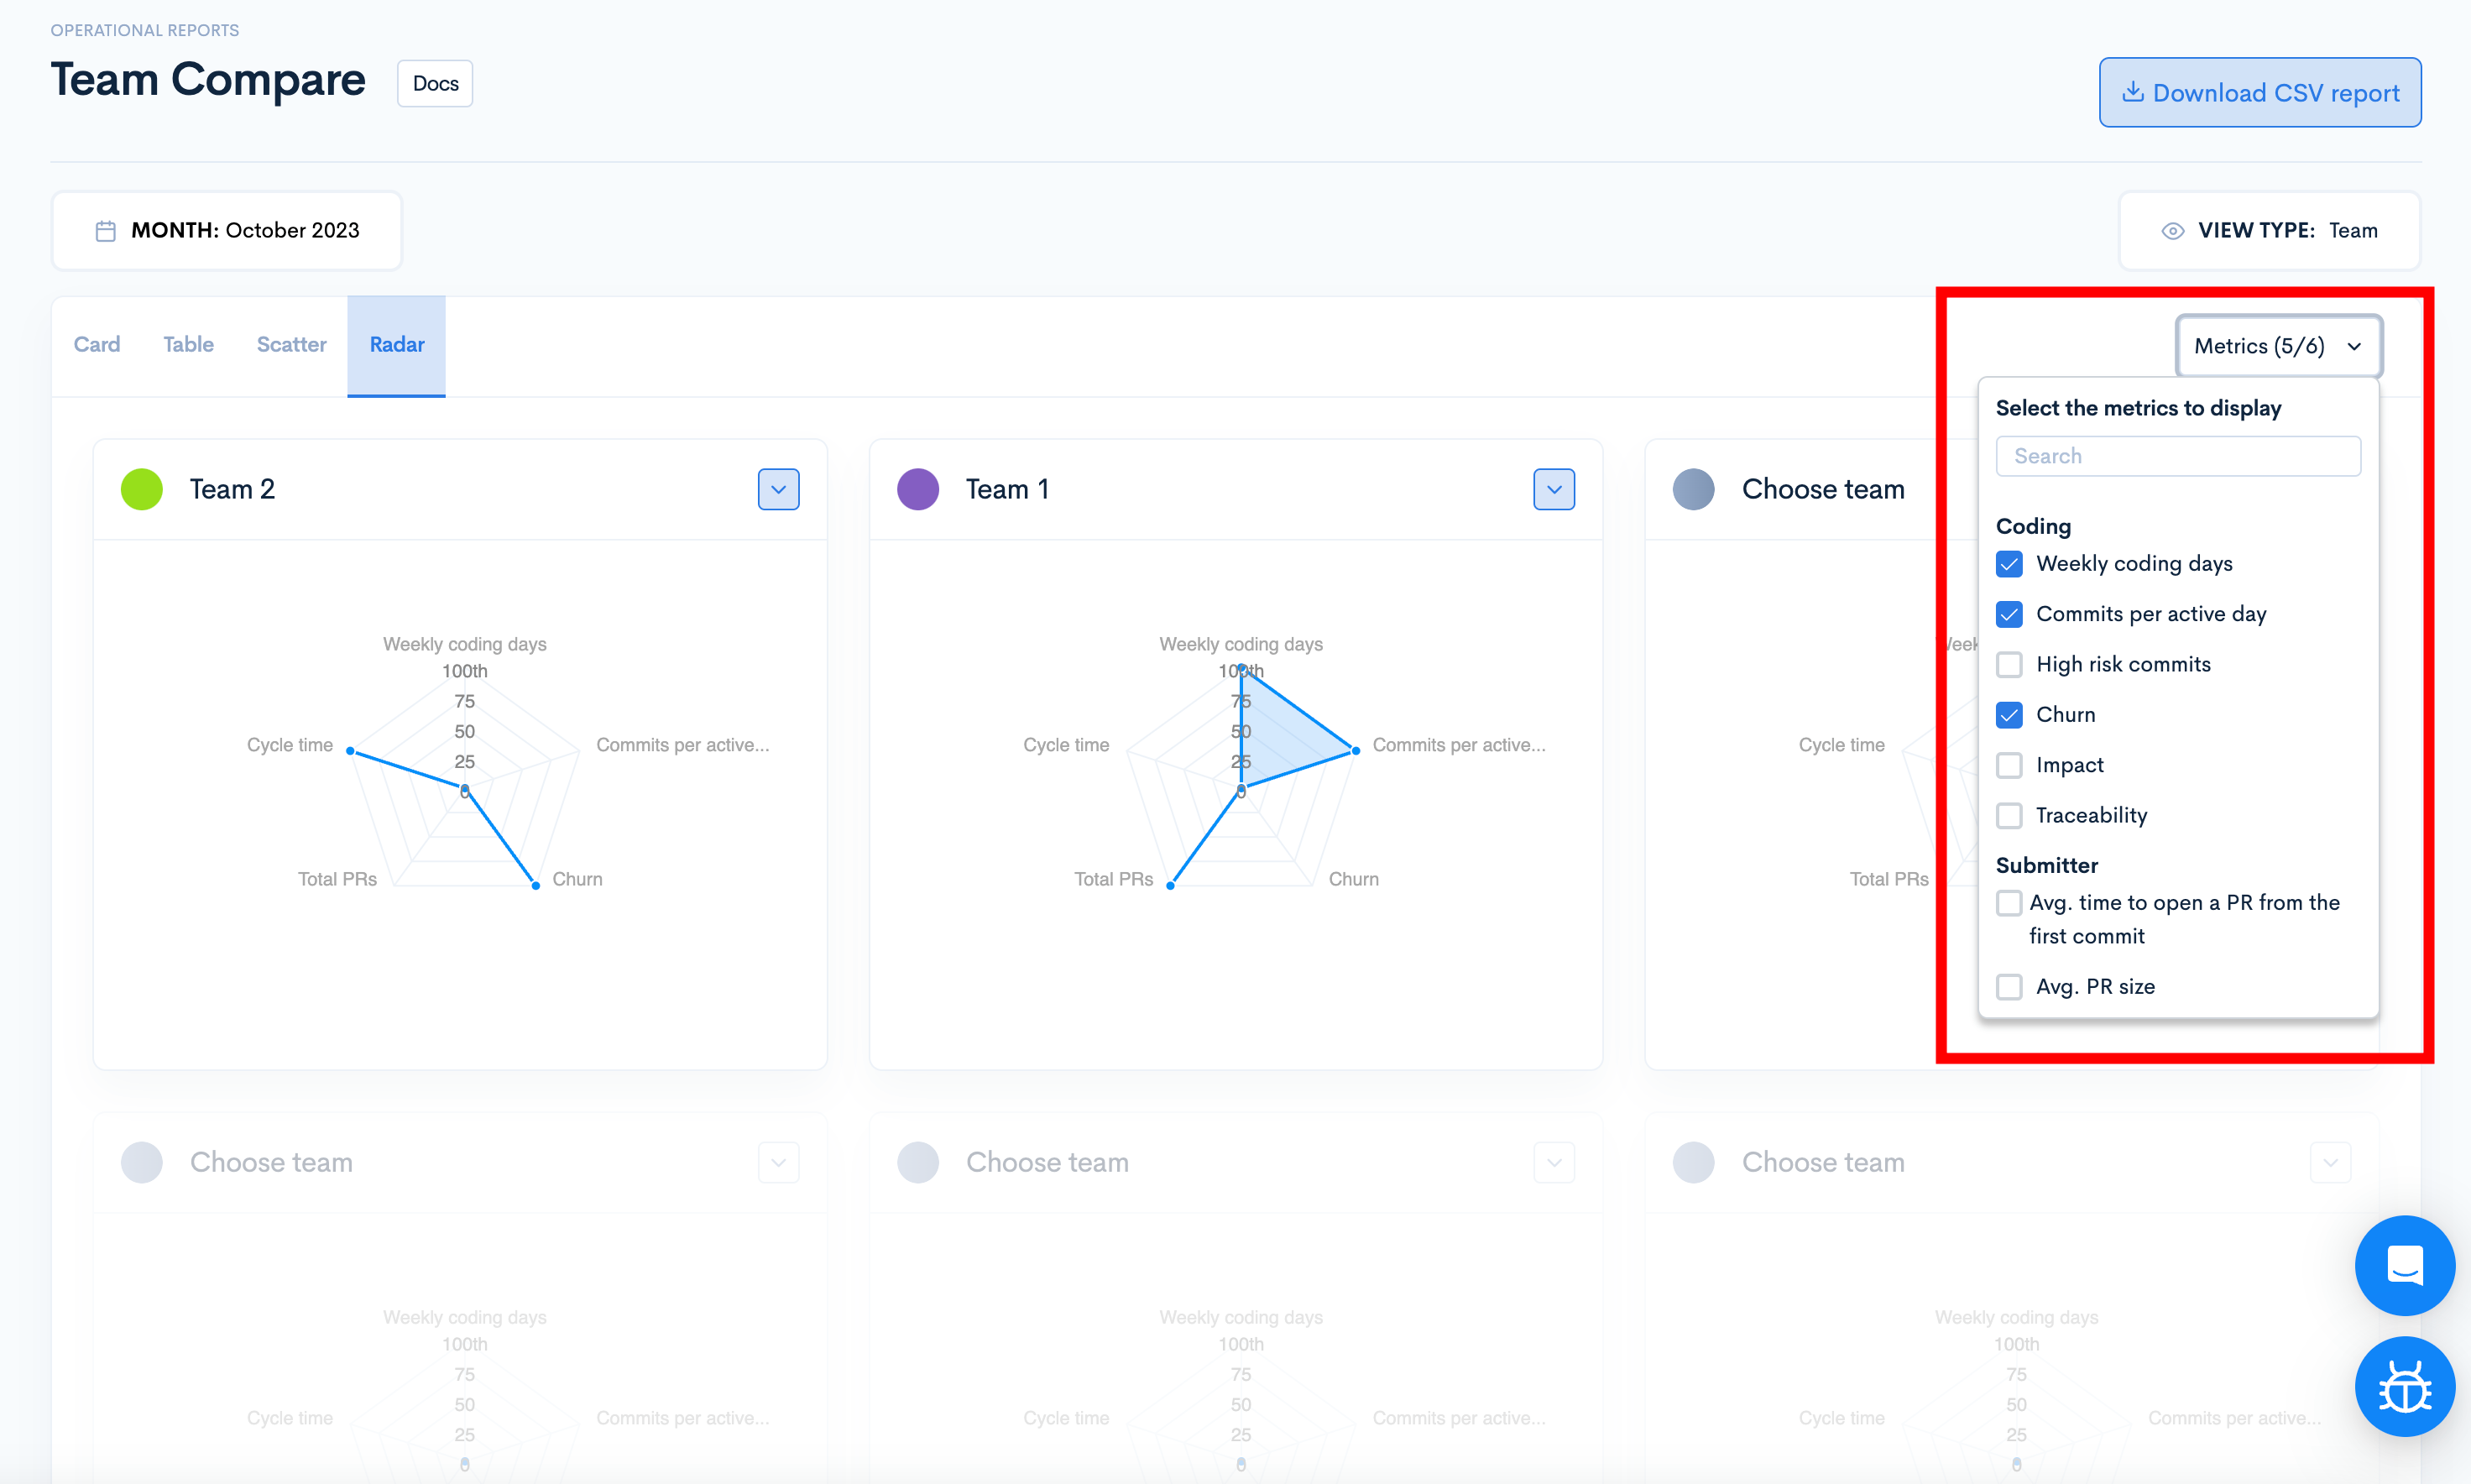
Select the desired metrics from the upper-right side dropdown.
You can assess which team is performing better in each metric by looking at how far along the axis the point is. The further from the center, the higher the value.
Updated about 2 months ago