

Benchmarks
Benchmarks
The Benchmarks report allows you to compare selected engineering metrics side by side across teams. It is accessible under Health in the left sidebar.
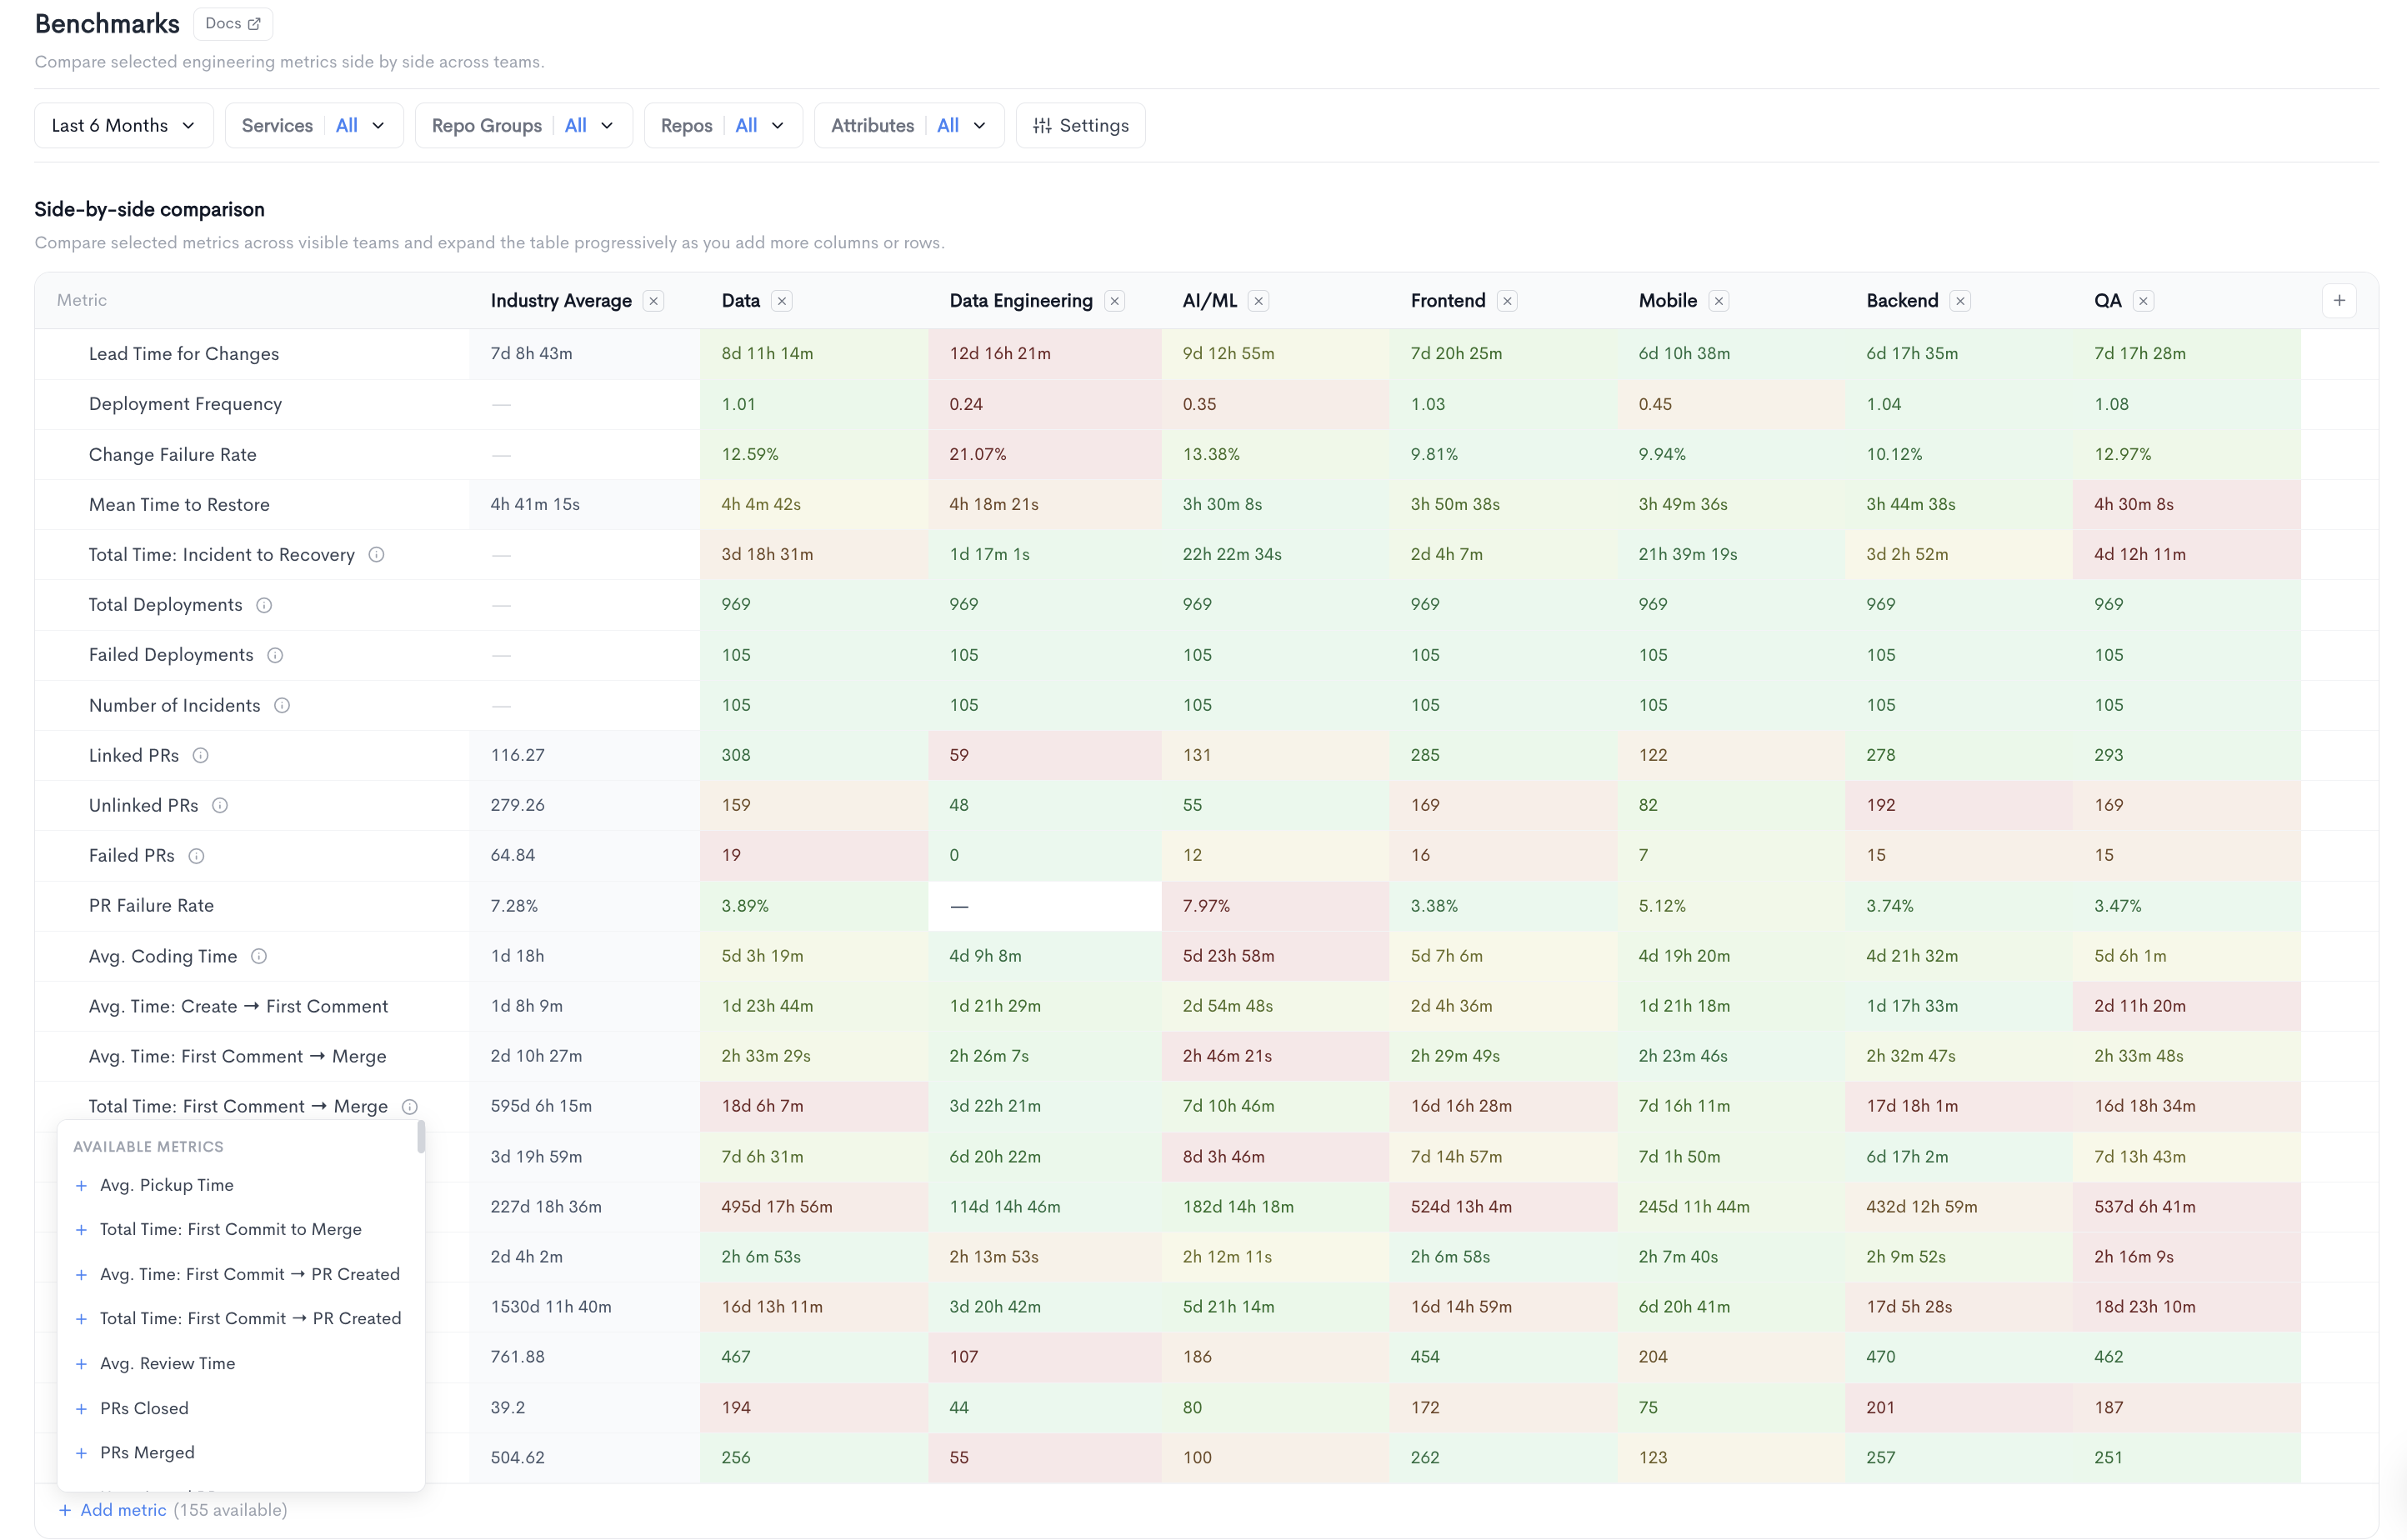
The report displays a Side-by-side comparison table where each column represents a team and each row represents a metric. Values are color-coded to highlight performance differences across teams, making it easy to identify outliers at a glance. New teams can be added to the comparison using the + button at the end of the column headers.
The following metrics are displayed by default:
- Lead Time for Changes - The median time from first commit to production deployment.
- Deployment Frequency - How often code is deployed to production.
- Change Failure Rate - The percentage of deployments that result in a failure.
- Mean Time to Restore - The average time to recover from a production incident.
- Deployments - The total number of deployments in the selected period.
- Linked PRs - The number of pull requests linked to a ticket or issue.
Additional metrics can be added to the table using the + Add metric button. There are 148 metrics available.
Filters available at the top of the report include date range, Repos, Attributes, and Groups.
Updated 25 days ago