

AI Metrics
AI Metrics is a preset dashboard covering adoption, engagement, throughput, and cost for your AI coding tools — the whole picture on one screen, without building a dashboard yourself.
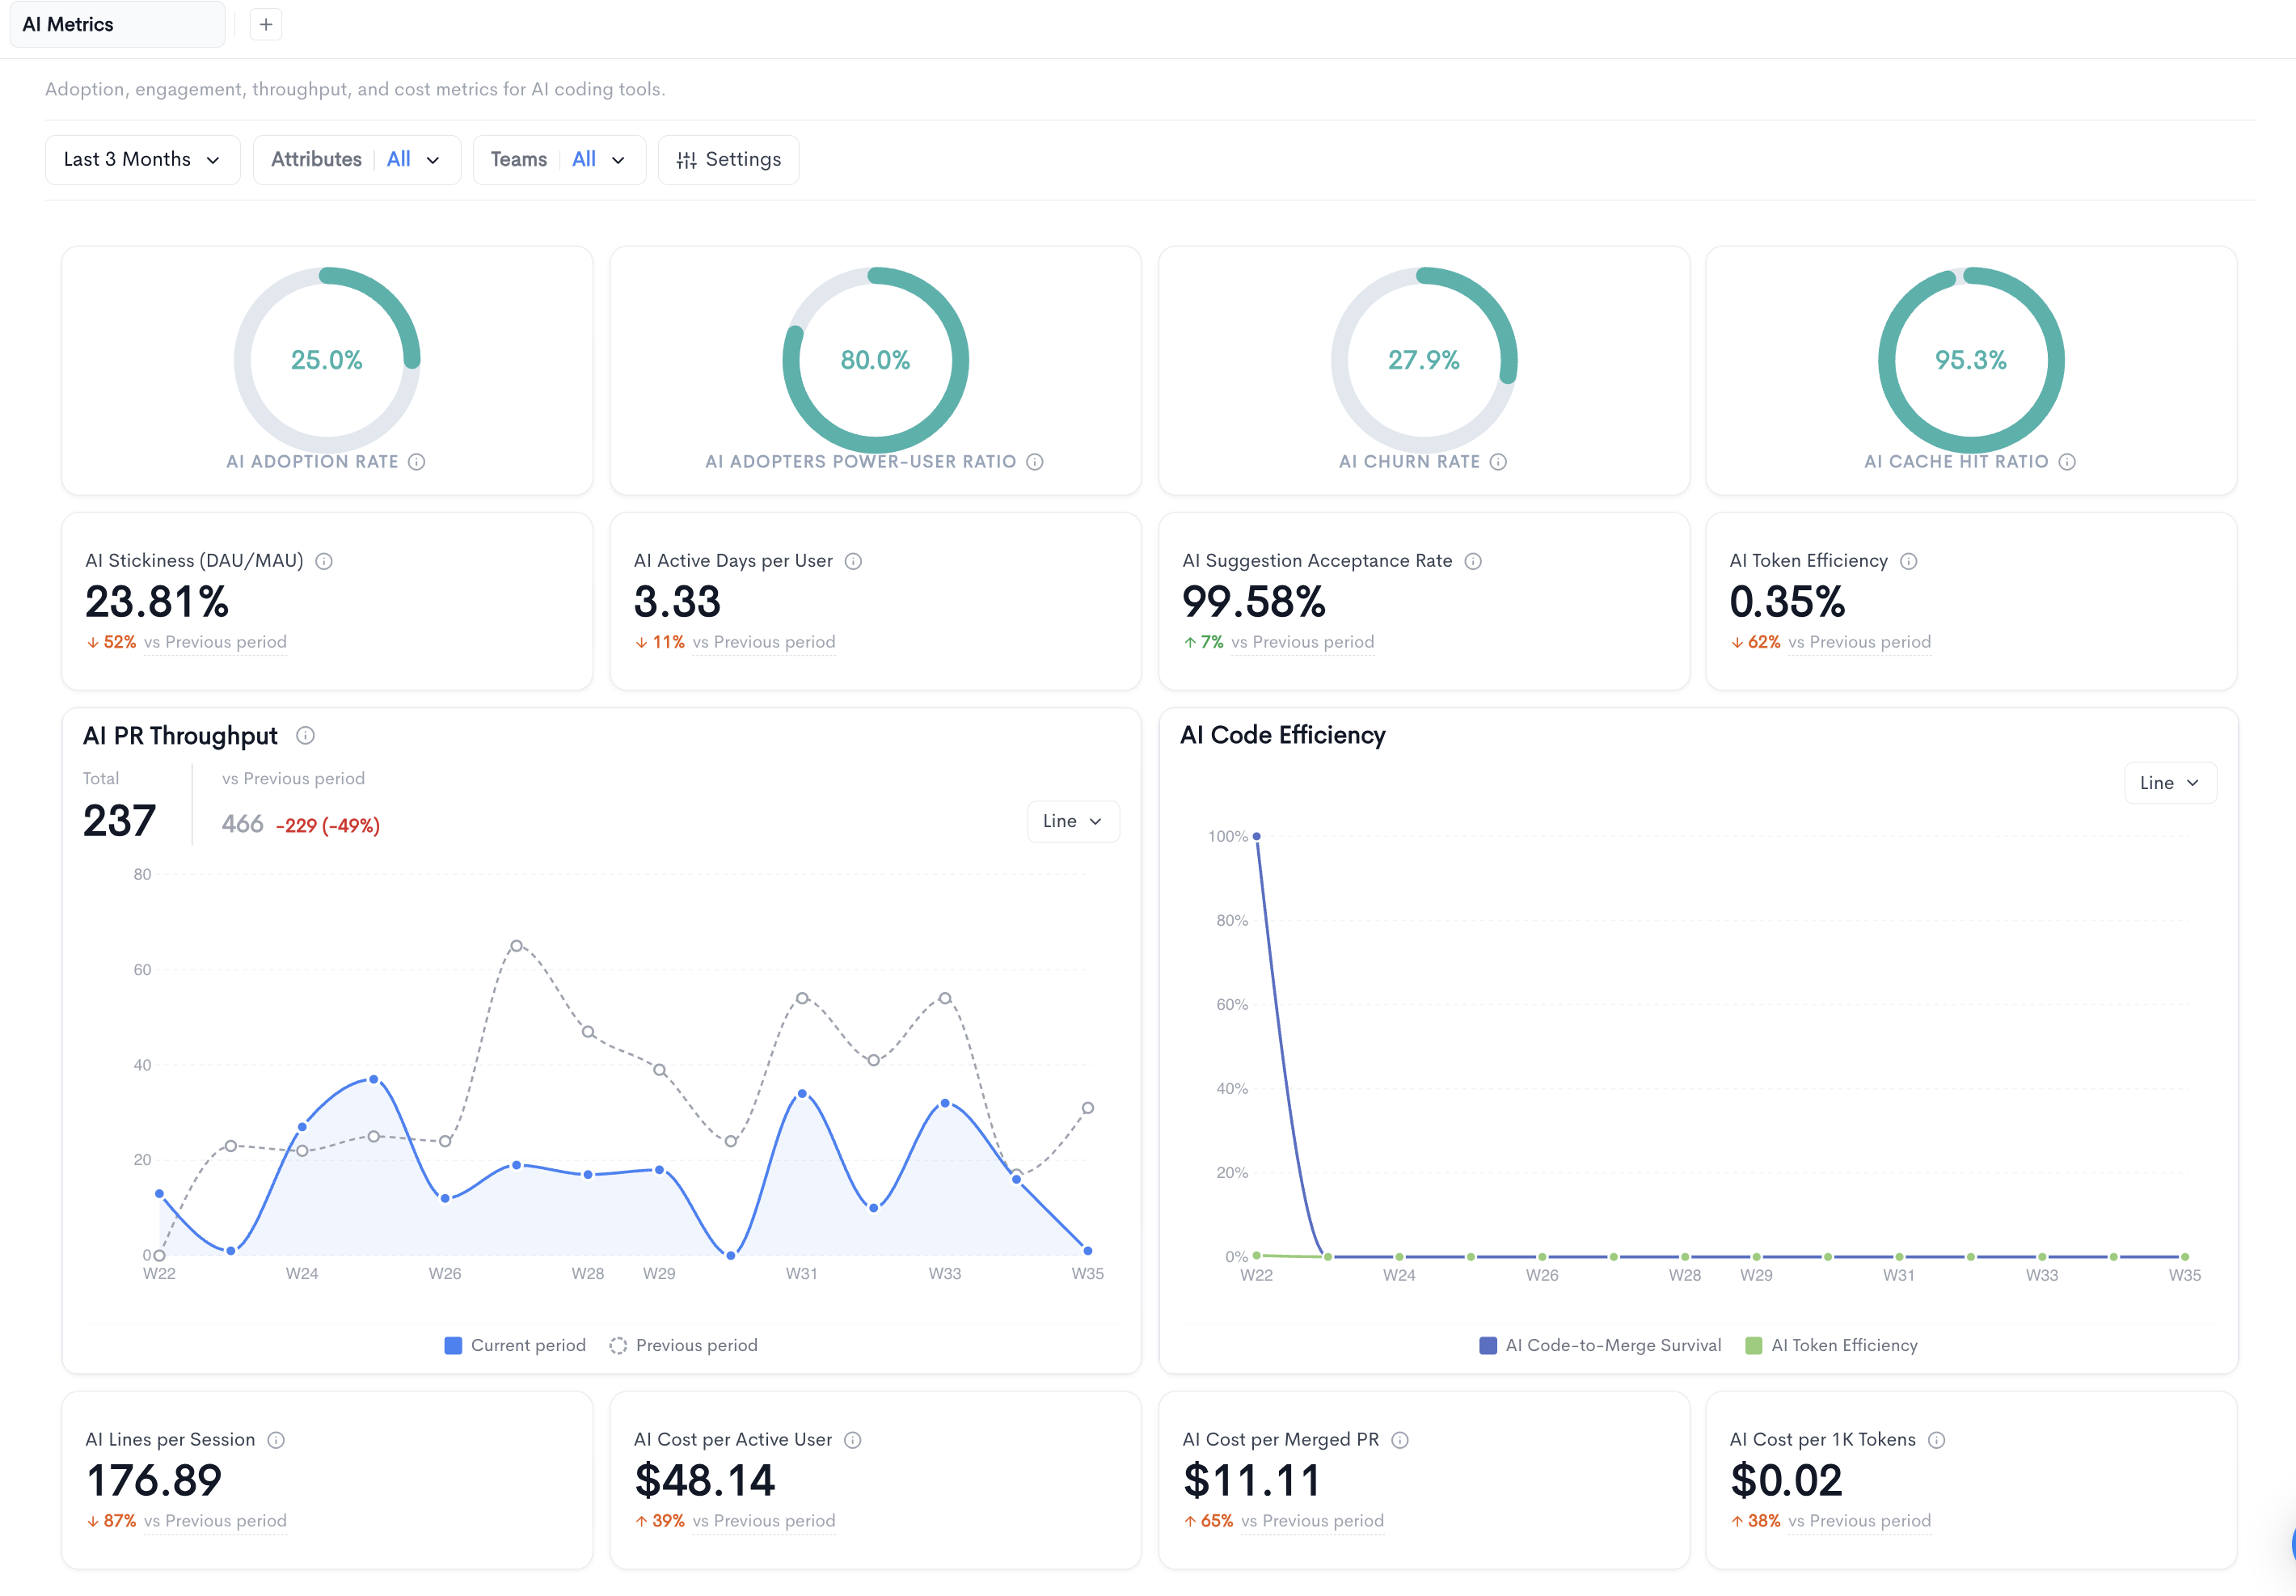
Adoption and engagement
AI Adoption Rate — The share of your people actively using AI tools, measured against your full user roster.
AI Adopters Power-User Ratio — Of everyone who has adopted AI at all, the share who use it heavily, meaning at least sixteen active days in a rolling twenty-eight-day window. This separates genuine daily reliance from occasional experimentation.
AI Stickiness (DAU/MAU) — How often AI users come back, comparing average daily active users against monthly active users over a trailing thirty days. A high figure means AI is part of the daily routine rather than something people return to now and then.
AI Active Days per User — The average number of days an active user actually used AI in the period.
Quality and trust
AI Suggestion Acceptance Rate — The share of AI suggestions your developers accepted. Low acceptance suggests the tool or its configuration isn't fitting your codebase.
AI Churn Rate — AI-written lines that were later removed, as a share of all AI-written lines. This is the one metric on the page where lower is better: it approximates how much AI output gets thrown away.
AI Cache Hit Ratio — Prompt tokens served from cache, as a share of all prompt tokens. Higher means you're paying less for the same work. Cache writes count as misses, since they aren't served from cache.
AI Token Efficiency — Output tokens as a share of all tokens consumed — how much of your token spend turns into generated content rather than context.
Output and impact
AI PR Throughput — Merged pull requests containing commits from AI tool users, counted by merge date. Use this to see whether adoption is translating into shipped work.
AI Code Efficiency — A combined chart of two metrics:
- AI Code-to-Merge Survival — lines in merged pull requests as a share of all pull-request lines touched by AI users. It answers whether AI-assisted work actually reaches production or stalls before merge.
- AI Token Efficiency — the same efficiency metric as above, plotted alongside for comparison.
AI Lines per Session — Average AI-generated lines per session.
Cost and efficiency
AI Cost per Active User — Total AI spend divided by the number of active users.
AI Cost per Merged PR — Total AI spend divided by merged pull requests containing AI users' commits. The most direct read on what a shipped change costs you in AI.
AI Cost per 1K Tokens — Blended cost across models, useful for spotting model-mix drift as teams move between cheaper and more expensive models.
Updated 16 days ago