

Resource Allocation
Resource Allocation shows how effort is distributed across the allocation categories you define, such as Bug Fixes, Feature Work, Infrastructure, or Technical Debt. Work that does not match a category is reported as Uncategorized.
Open it from Planning → Resource Allocations.
Filters
The filters at the top of the page apply to the chart, the category table, and every drill-down.
- Period — The date range. The chart and table are bucketed by the granularity chosen in Settings.
- Issues — Limit the report to selected issue collections.
- Attributes — Limit the report to selected attributes.
- Teams — Limit the report to selected teams.
- View — Switch the unit between % and FTE. Percentages are the share of effort in each period. FTE is the effort value.
- Settings — Set the granularity (day, week, or month, depending on the selected period). Granularity controls the columns in the category table and the buckets on the chart.
FTE by Issue Categories
The stacked bar chart shows how effort is split across categories in each period. Each category keeps its own color. Segment labels appear on the bar when they fit, and the full breakdown is always available in the tooltip, including the period and each category’s share.
Use the chart-type control in the top-right of the chart to switch between:
- Stacked Bar — Categories stacked in one bar per period. This is the default.
- Bar — Categories shown as separate bars.
- Line — One line per category.
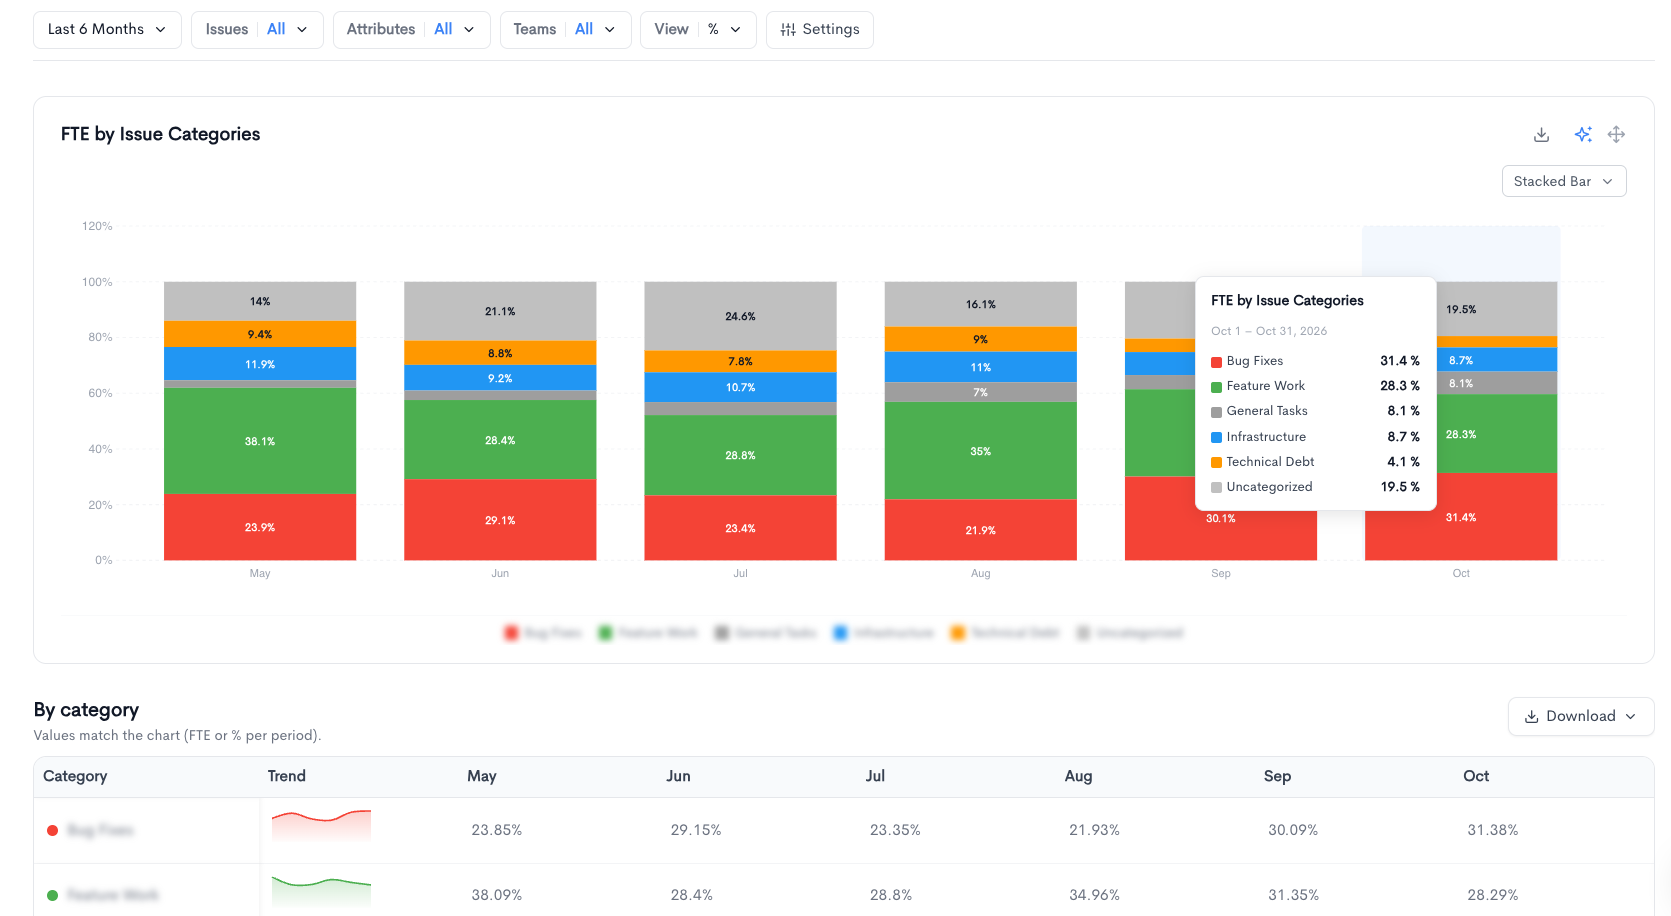
By category
The table under the chart uses the same values as the chart. Its description reads: “Values match the chart (FTE or % per period).”
| Column | What it shows |
|---|---|
| Category | The category name and its color. |
| Trend | A sparkline of that category across the selected periods. |
| Period columns | One column per bucket (for example May, Jun, Jul). Each cell is the FTE or percentage for that category in that period. |
Click anywhere on a category row to open the collections in that category.
Category drill-down
The category chart stays on the page. The table is replaced by the collections inside the category you opened. The breadcrumb shows the path, for example Category > Feature Work. Select Category to return to the category table.
| Column | What it shows |
|---|---|
| Name | The collection name. |
| FTE | Effort for that collection, shown as a value and a bar. |
| Est. Cost | Estimated cost for the collection. |
| Issues | Number of issues in the collection. |
| Story Points | Total story points in the collection. |
| Contributors | Avatars of the people who contributed. |
| Last Activity | Date of the most recent activity. |
Click a collection row to open its issues. The breadcrumb extends, for example Category > Feature Work > Development.
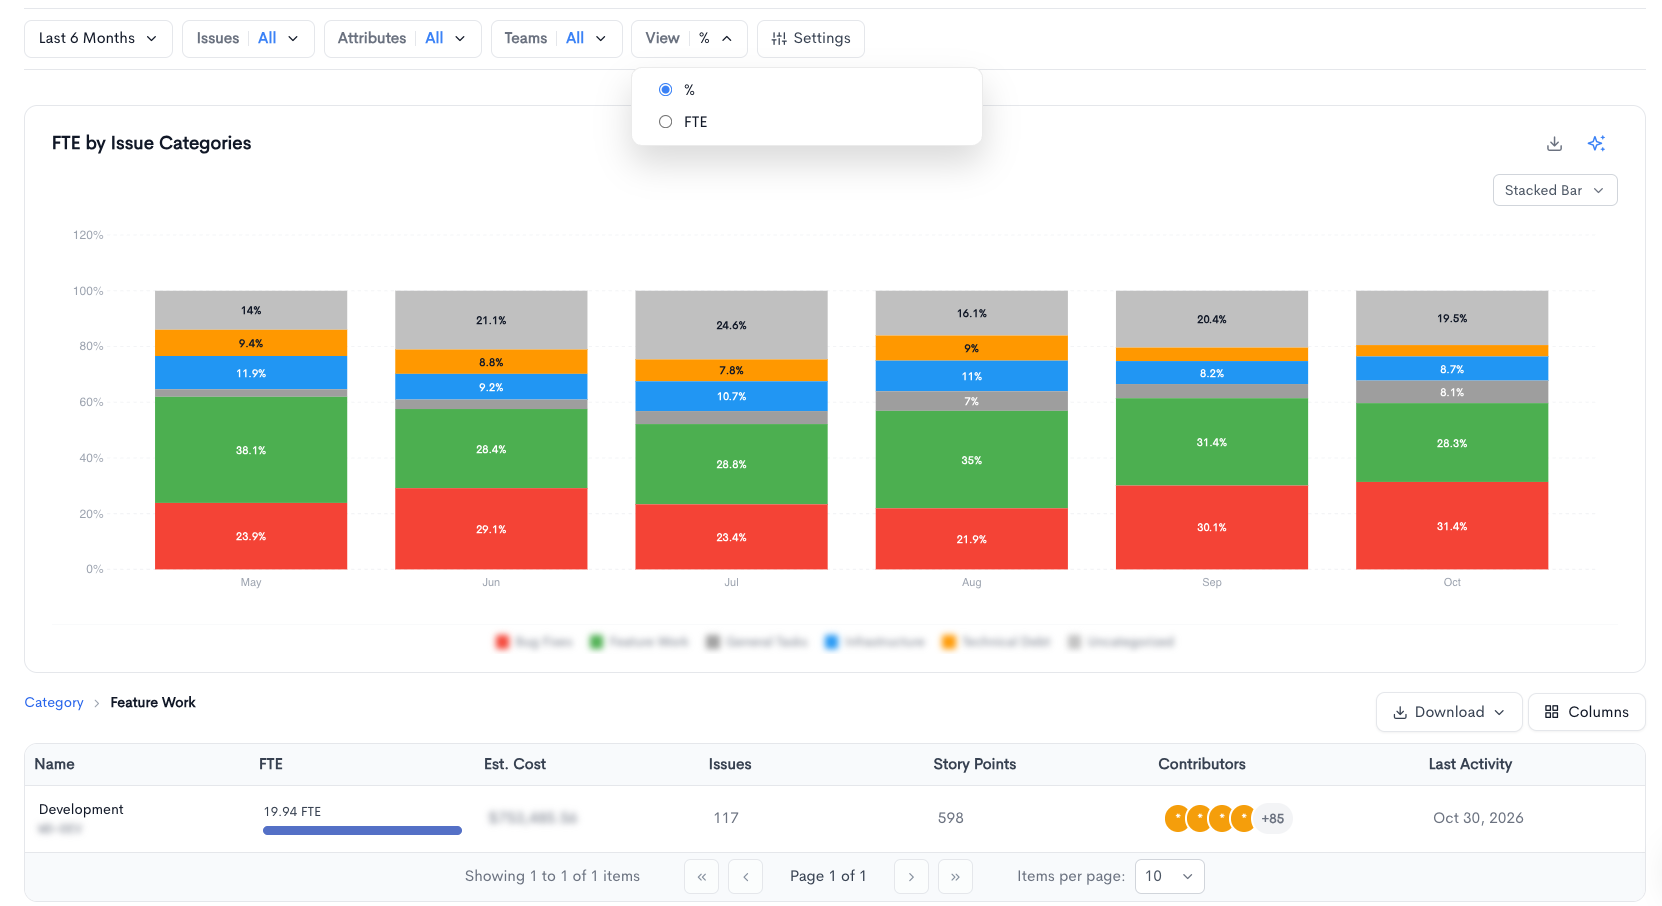
Issue drill-down
The issue table lists the issues in the selected collection.
| Column | What it shows |
|---|---|
| Title | Issue title. The external-link icon opens the issue in the source provider. |
| Issue Type | The issue’s type, such as Epic, Story, or Task. |
| State | Current state, such as in progress, code review, or in testing. |
| Effort | Effort recorded on the issue. |
| Story Points | Story points assigned to the issue. |
| Assignee | The person assigned to the issue. |
| Updated | Date the issue was last updated. |
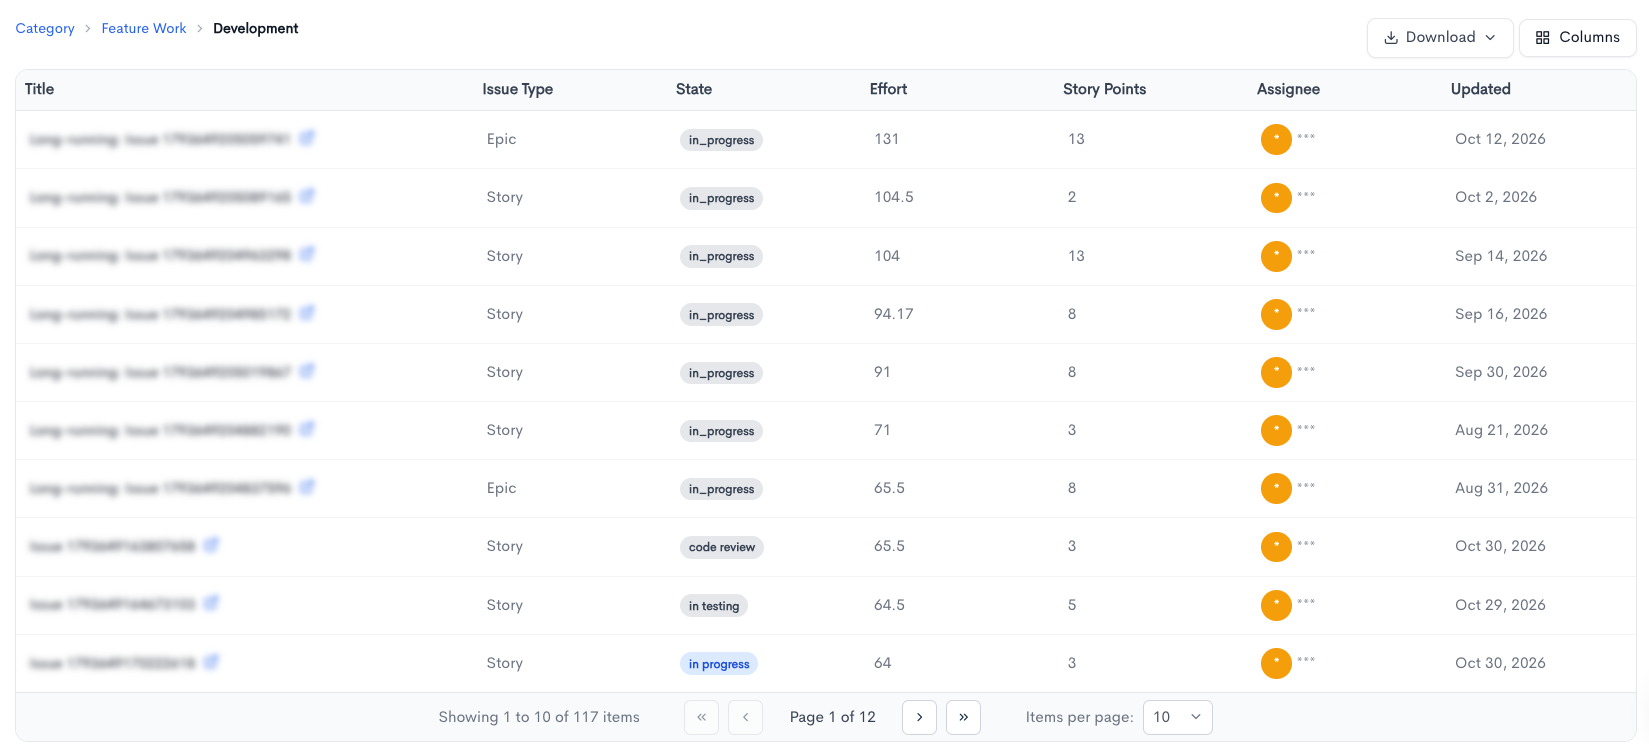
Allocation categories
Categories used on this report are managed in Settings → Aggregation → Resource Allocation. The Allocation Categories table lists each category with:
- Name — Category name and color.
- Work types — Work types mapped to the category.
- Labels — Labels mapped to the category.
- Custom fields — Custom-field rules mapped to the category.
- Actions — Edit or delete the category.
Create category adds a category. The form has:
- Name — A name for the category.
- Work types — Work types that belong to this category.
- Labels — Labels that belong to this category.
- Custom fields — Optional rules that match Jira select-list or Azure DevOps custom field values. An issue must match every rule, and any selected value within a rule.
- Color — The color used for this category in the chart and table. Enter a hex code or use the color picker.
Save with Create category, or Save changes when editing. Cancel returns to the category list without saving.
Updated about 2 hours ago